
Park Hotels & Resorts and Chesapeake
Lodging Trust Merger Presentation
MAY 6, 2019
PK: Waldorf Astoria Orlando
PK: Hilton Hawaiian Village Waikiki Beach ResortCHSP: Hyatt Regency Boston
2 |
(10.0%)
0.0%
10.0%
20.0%
30.0%
40.0%
50.0%
1/4/2017 4/20/2017 8/4/2017 11/18/2017 3/4/2018 6/18/2018 10/2/2018 1/16/2019 5/3/2019
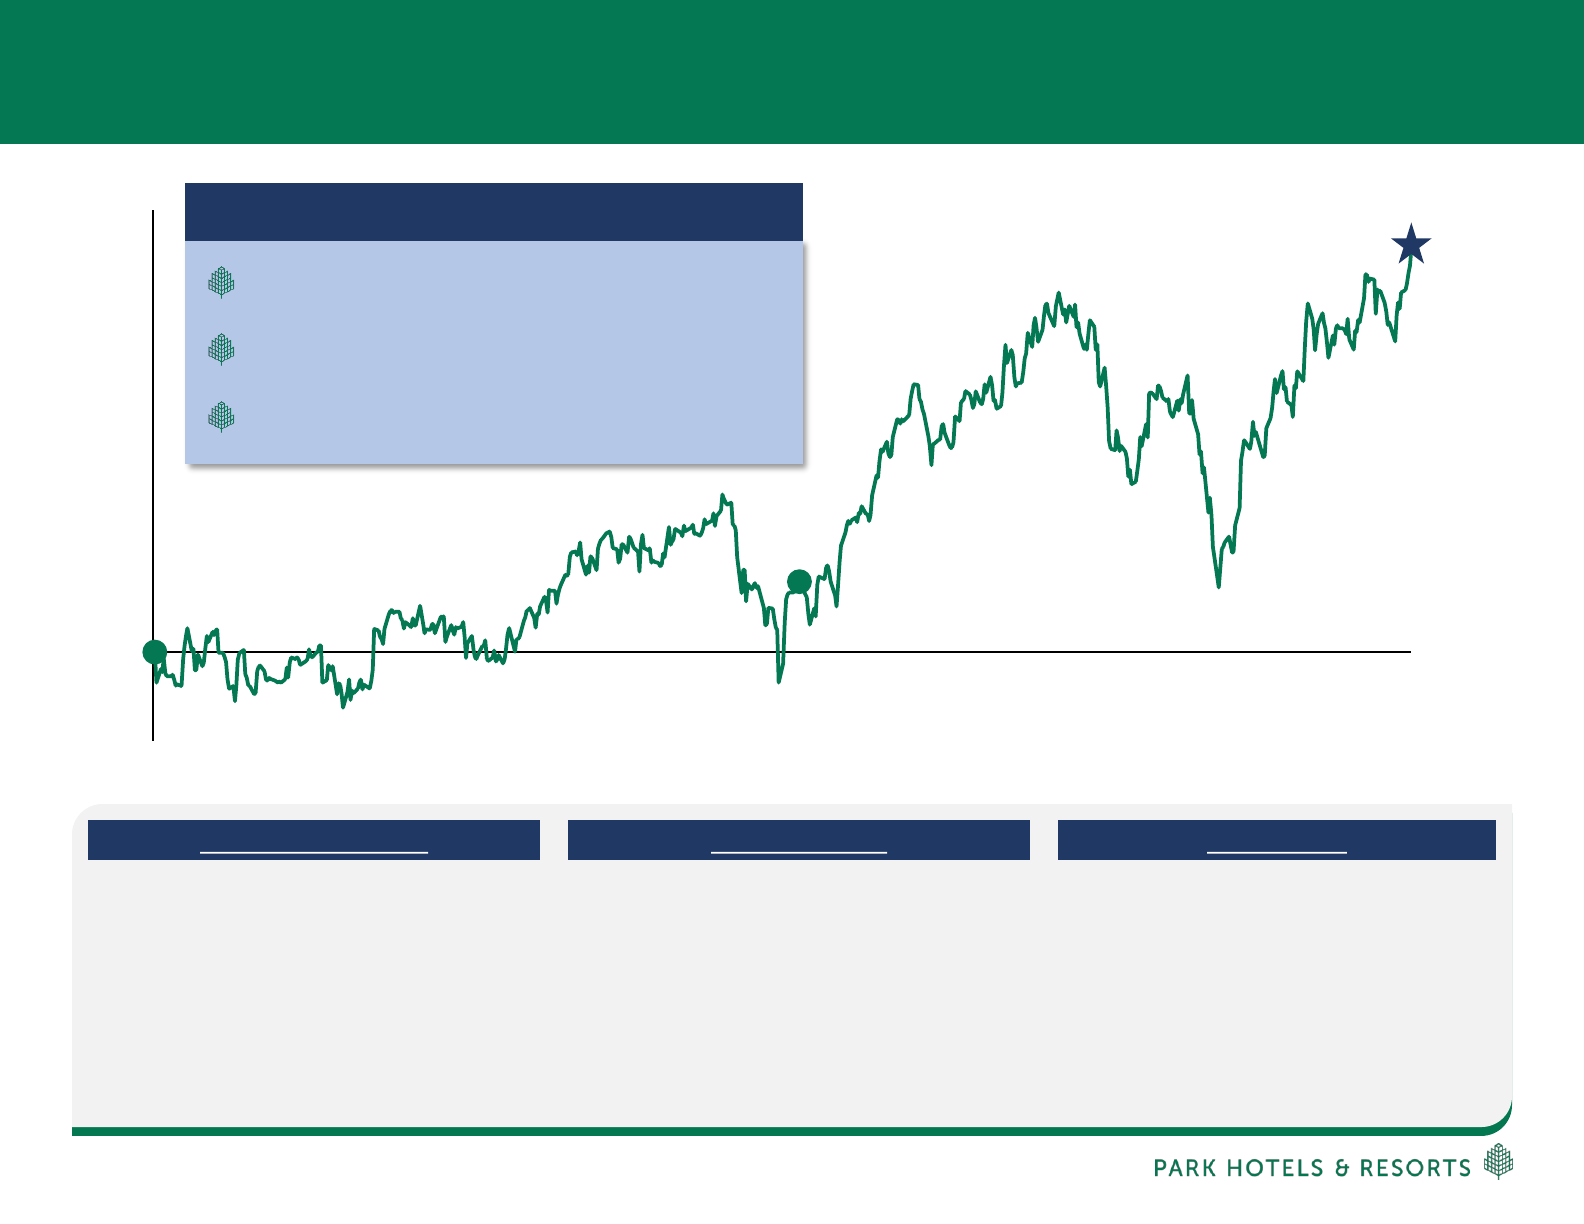
Park’s Track Record Since Spin-Off
Source: FactSet; data as of May 3, 2019
(1) Peers include all hotel REITs with a market-cap over $1 billion
(2) Excludes CHSP in 2019
(3) Pro Forma for PK hotels owned as of March 31, 2019
Hilton Spin
JAN 2017
HNA
Secondary
Follow-On
MAR 2018
CHSP
Merger
Announcement
MAY 2019
46% Total Return Since Spin-Off
3,400 bps Above Peers
(1)
Returned $2B in Capital
Operational Excellence Capital Allocation Balance Sheet
▪ Successfully sold 15 non-core assets for $590M,
while reducing exposure to international markets
to ~1% of Hotel Adjusted EBITDA
▪ Highly successful HNA secondary—buying back
14M shares at $24.85
▪ Returned $2B of capital to shareholders in the
form of dividends and HNA stock buyback
▪ Sector leading RevPAR growth in 2018 and 2019;
exceeded peers by 65bps in 2018 and expected to
exceed peers by more than 180bps in 2019
(2)
▪ Continuing to narrow the margin gap with peers;
forecasted to close the gap by an estimated 130bps
by year-end 2019
(2)
▪ Increased Group segmentation by 80bps to 32% for
Pro Forma Comp Top 25 hotels in 2018
▪ Net Debt/Adjusted EBITDA
(3)
of 3.9x as of 1Q19;
maintained Net Debt/2019E Adj. EBITDA within
stated target range of 3x to 5x
▪ $1B undrawn line of credit
▪ Well-covered dividend with sector leading yield;
increased recurring dividend from $0.43/share
to $0.45/share in 2019
Superior Results Delivered
3 |
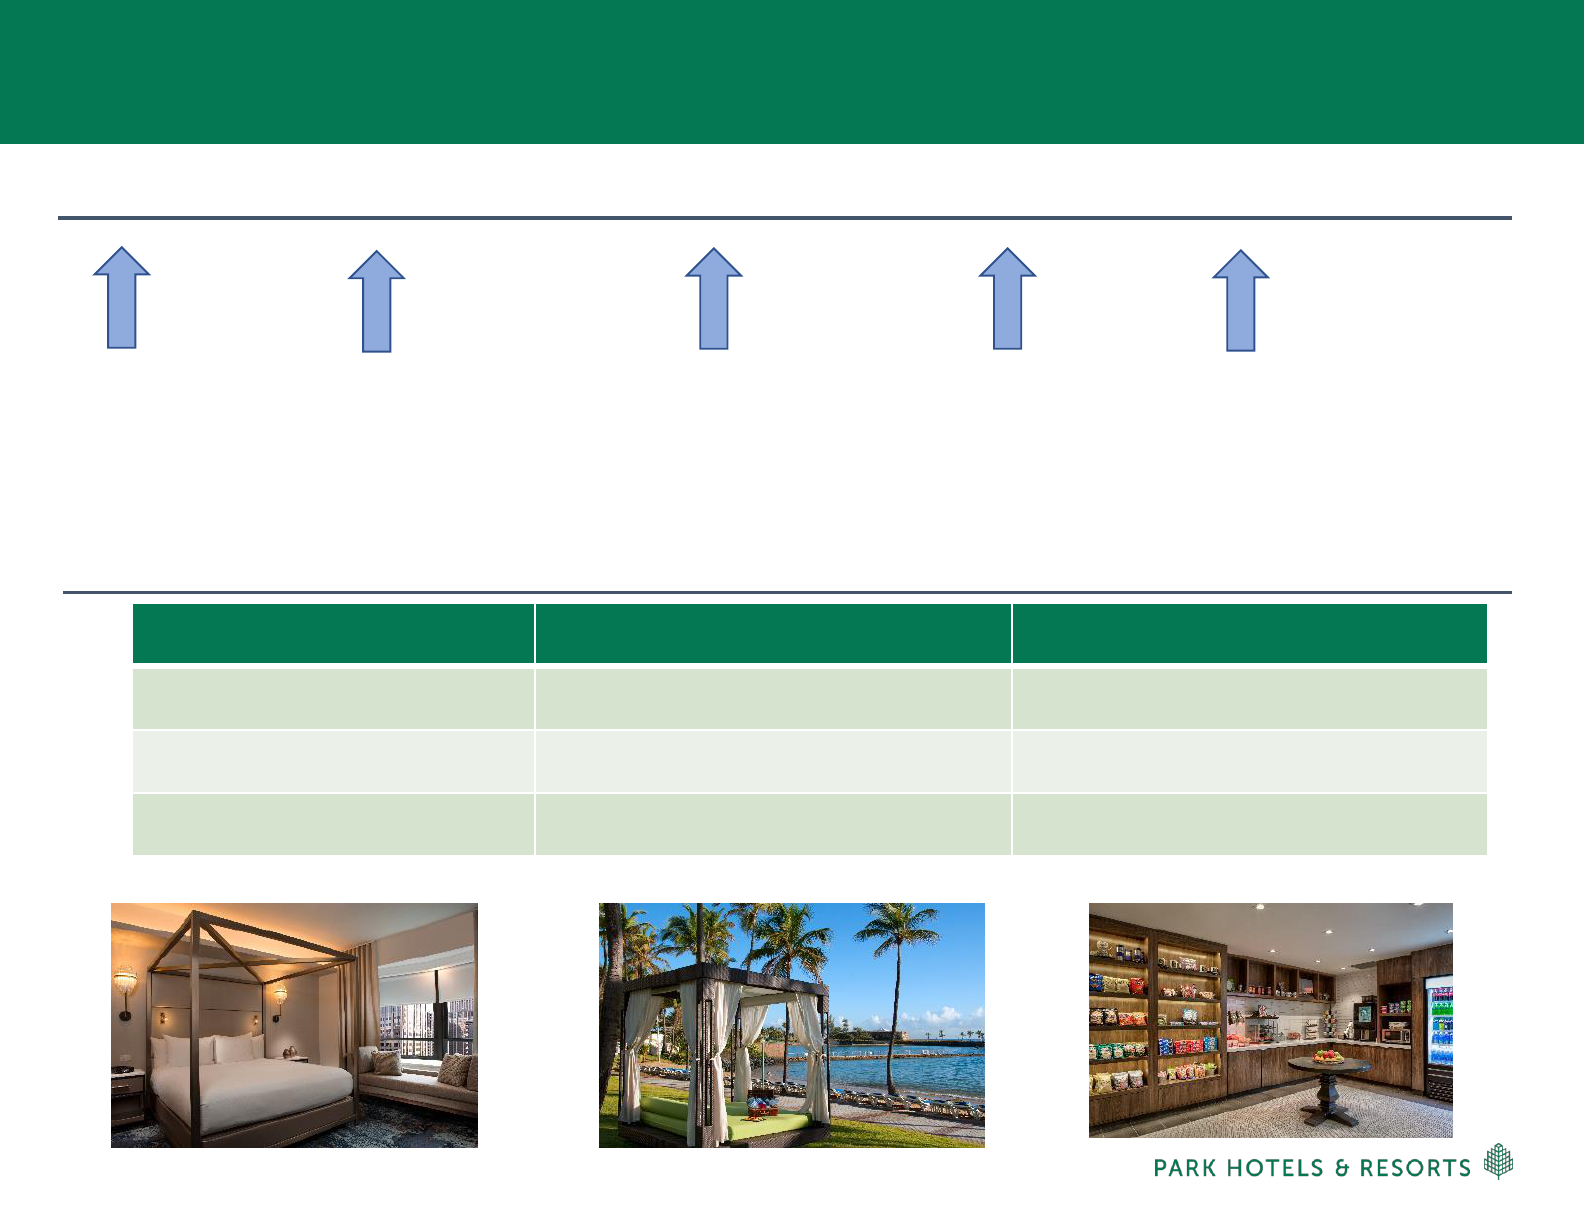
1Q19 Performance and Updated 2019 Outlook
Updated 2019 Outlook
1Q19: Strong Operating Results
4.5%
Comp
RevPAR
100bps
Comp Hotel
Adj. EBITDA
Margin
10.3% 8%
Increase in
‘Other Hotels
Revenues’
(1)
Group
Revenues
Metric Updated Guidance
Increase
Comp RevPAR Growth:
+2.5% to +4.5% +50bps
Comp EBITDA Margins:
+20bps to +80bps +20bps
Adjusted EBITDA:
$750M to $780M $5M
Note: Guidance does not include the impact of the proposed Chesapeake Lodging Trust merger and other future hotel acquisitions or dispositions
(1) Ancillary hotel revenues for our comparable hotels
480bps
Market
Share Gains

4 |
Experienced Team with Track Record of Creating Value
Chairman, President
& CEO
Tom Baltimore
EVP, GC
Tom Morey
EVP, HR
Jill Olander
EVP, CIO
Matt Sparks
EVP, Asset
Management
Rob Tanenbaum
EVP, CFO &
Treasurer
Sean Dell’Orto
SVP, CAO
Darren Robb
SVP, FP&A
Diem Larsen
SVP, Strategy
Ian Weissman
SVP, Tax
Scott Winer
Executive Management
Senior Management
EVP, D&C
Carl Mayfield
Finance: Team is responsible for balance sheet management, financial reporting, forecasting and budgeting (FP&A), tax matters, investor relations
and corporate strategy functions, and all capital markets activity
Asset Management: Diligent oversight of revenue management initiatives with a core focus on improving operating margin; Optimize food and
beverage operations; Responsible for identifying ROI opportunities to improve property level operating performance; Dedicated retail leasing and
revenue management functions
Design & Construction: Responsible for all capital expenditures including general maintenance, ROI redevelopment projects; Leverage internal design
team to yield cost effective and creative capital improvements; Deliver 10%+ yield on invested capital; Centralized procurement
Investments: Responsible for sourcing and underwriting single asset and portfolio acquisitions/dispositions
5 |
Strategic Rationale for Merger
Unique opportunity to acquire a high-quality, well-maintained portfolio
that is strategically consistent with Park’s existing platform
QUALITY
◼ CHSP: High RevPAR (2
nd
highest among peers) and high margin portfolio in outstanding
physical condition
◼ 12 of CHSP’s 18 assets are represented in Pro Forma Park’s top 25 assets by 2018 RevPAR
◼ Well-maintained portfolio; CHSP reinvested ~$35k per key over the past 5 years
GEOGRAPHIC
DIVERSITY
◼ Increased exposure to San Francisco, expected to be one of the strongest hotel markets over
the next two years, and penetration into key submarkets (Miami Beach, Downtown LA,
Boston, San Diego & Denver)
◼ Reduces Park’s exposure to Hawaii from 24% to 20% of 2018 Pro Forma Hotel Adj. EBITDA
(1)
BRAND & OPERATOR
DIVERSITY
◼ Broadens Park’s brand mix, providing exposure to Marriott, Hyatt and IHG
◼ Diversifies Park’s operator mix, adding exposure to 8 new operators, including Marriott, Hyatt
and other third party operators
UPSIDE
OPPORTUNITY
POSITIVE
FINANCIAL IMPACT
◼ Outsized organic growth profile positions the combined company for enhanced NAV growth
◼ Opportunity to aggressively asset manage the portfolio to drive higher margins
◼ Source attractive / accretive ROI opportunities, including meeting space expansions and
additional keys
◼ Accretive to Adjusted FFO per share in 2020 and beyond
(1)
◼ RevPAR accretive – improves comparable RevPAR from $176 to $182 (3.5%)
(1)
◼ Post asset sales, Park maintains a well-capitalized and flexible balance sheet to support
future growth
GROWTH
◼ Combined portfolio will include 66 hotels in 17 states and D.C.
(1)
◼ Combined enterprise value of $12.0B
(1)
, solidifying Park’s position as the 2nd largest lodging
REIT
◼ Enhanced liquidity and potential cost of capital advantages
10
(1) Reflects the following Pro Forma changes – the anticipated sales, prior to the closing of the merger with Chesapeake, of the two Chesapeake New York properties (the
122-room Hyatt Herald Square New York and the 185-room Hyatt Place New York Midtown South) and three non-core PK legacy hotels that are currently under contract.
This pro forma presentation is referred to throughout as “Pro Forma PK” or “Pro Forma Park”, which includes 48 legacy Park hotels, plus 18 Chesapeake hotels

6 |
Transaction Overview
Park to acquire 100% of Chesapeake stock for $2.7B
– Consideration of $31.00/share -- 0.628x fixed exchange ratio; $11.00 per share of cash
Pro-forma ownership of ~84% Park / ~16% Chesapeake
Transaction equates to a 13.9x multiple on 2019E Adjusted EBITDA; 12.7x on 2020E Adjusted EBITDA
(1)
Park anticipates Chesapeake’s two NYC hotels and three Park hotels being sold at or prior to closing
Park executives maintain existing management positions
At closing, Park’s Board of Directors will be expanded by two seats to be filled from members of
Chesapeake’s Board
Estimated annual general and administrative cost savings of $17M (current base of $19M)
– $9M cash G&A savings / $8M non-cash G&A savings
Potential for $8M of incremental EBITDA in 2020 and $17M in 2021
(2)
from asset management initiatives,
including grouping up, enhanced food & beverage profitability and increased ancillary income
Expected closing in late 3Q / early 4Q 2019
Requires Chesapeake shareholder approval, regulatory approval and customary closing conditions
Park stockholder approval not required
Strategic combination creates premier, best-in-class lodging REIT
TRANSACTION
DETAILS
BOARD
COMPOSITION &
MANAGEMENT
SYNERGIES
TIMING &
APPROVALS
Pro Forma Adjusted FFO per share expected to be accretive in 2020 (2.0%) and 2021 (3.0%+)
Pro Forma Net Debt to Adjusted EBITDA expected to fall to 4.4x when accounting for planned asset sales
(3)
Park expects to maintain its quarterly dividend of $0.45 per share
Park continues to have ample liquidity to execute on its strategic initiatives – $1B undrawn Credit Facility
FINANCIAL
IMPACT
(1) Based on Park’s underwriting of Chesapeake 20-hotels portfolio, inclusive of anticipated synergies
(2) Net of incremental property taxes
(3) Reflects the following Pro Forma changes – the anticipated sales, prior to the closing of the merger with Chesapeake, of the two Chesapeake New York properties
(the 122-room Hyatt Herald Square New York and the 185-room Hyatt Place New York Midtown South) and three non-core PK legacy hotels that are currently under
contract
8
7 |
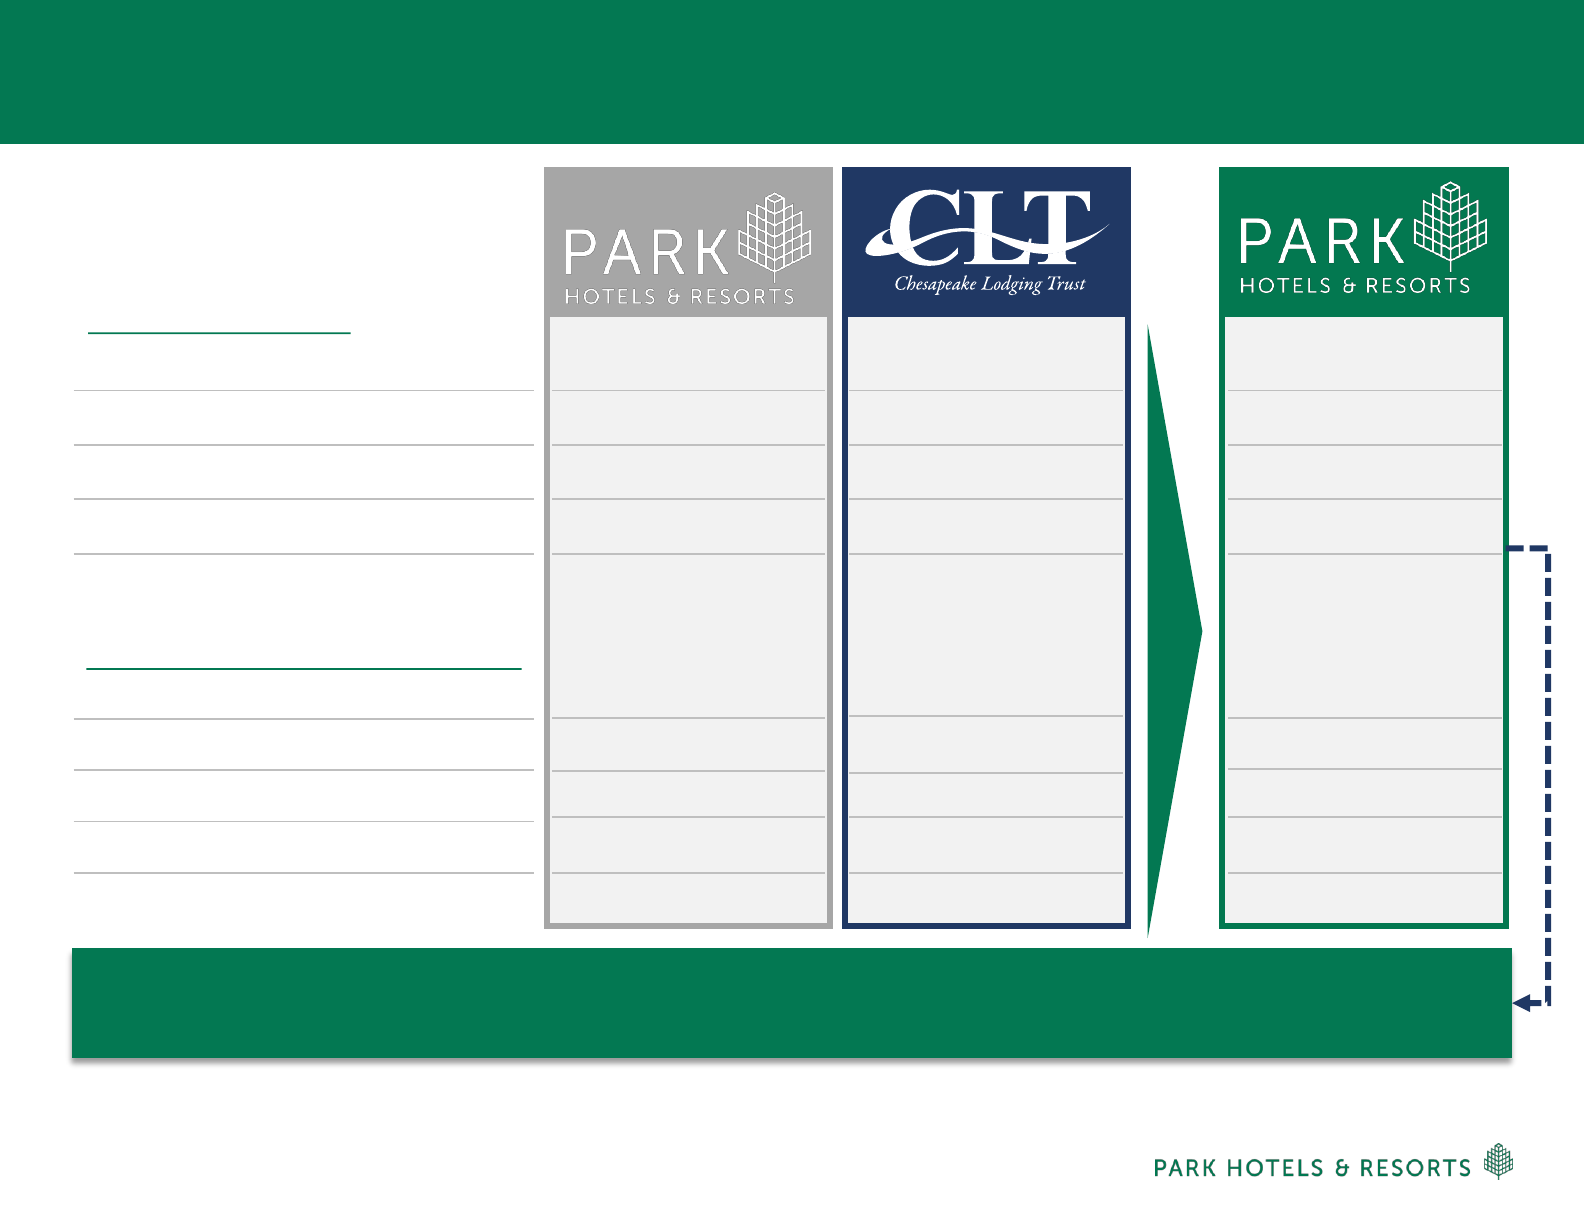
Transaction Overview
Key Elements of the Transaction
Planned
Asset Sales
(1) Net of incremental property taxes
8
Financing
Synergies
Misc.
Phase I: Sale of five non-core assets at or prior to closing including both of Chesapeake’s New York City
hotels (the 122-room Hyatt Herald Square New York and the 185-room Hyatt Place New York Midtown
South) in addition to three non-core Park hotels located in secondary markets
– Gross proceeds from these sales are expected to be approximately $300M
Phase II: Post closing, Park plans to sell 2 additional non-core hotels; proceeds expected to be $170 to
$180M
Park has secured a financing commitment for $1.1B to fund the following:
– $0.7B equity cash component
– $0.4B repayment of Chesapeake debt (term loan and two mortgages)
– Portion of transaction costs
Financing commitment to be reduced if assets are sold prior to funding
Synergies:
2020: ~$24M ($17M G&A savings + $8M net
(1)
Asset Management initiatives)
2021: ~$34M ($17M G&A savings + $17M net
(1)
Asset Management initiatives)
$8 to $12M of additional upside: (Ancillary fees, parking, ROI)
Chesapeake shareholders expected to receive their normal quarterly dividend payment between signing
and closing
8 |
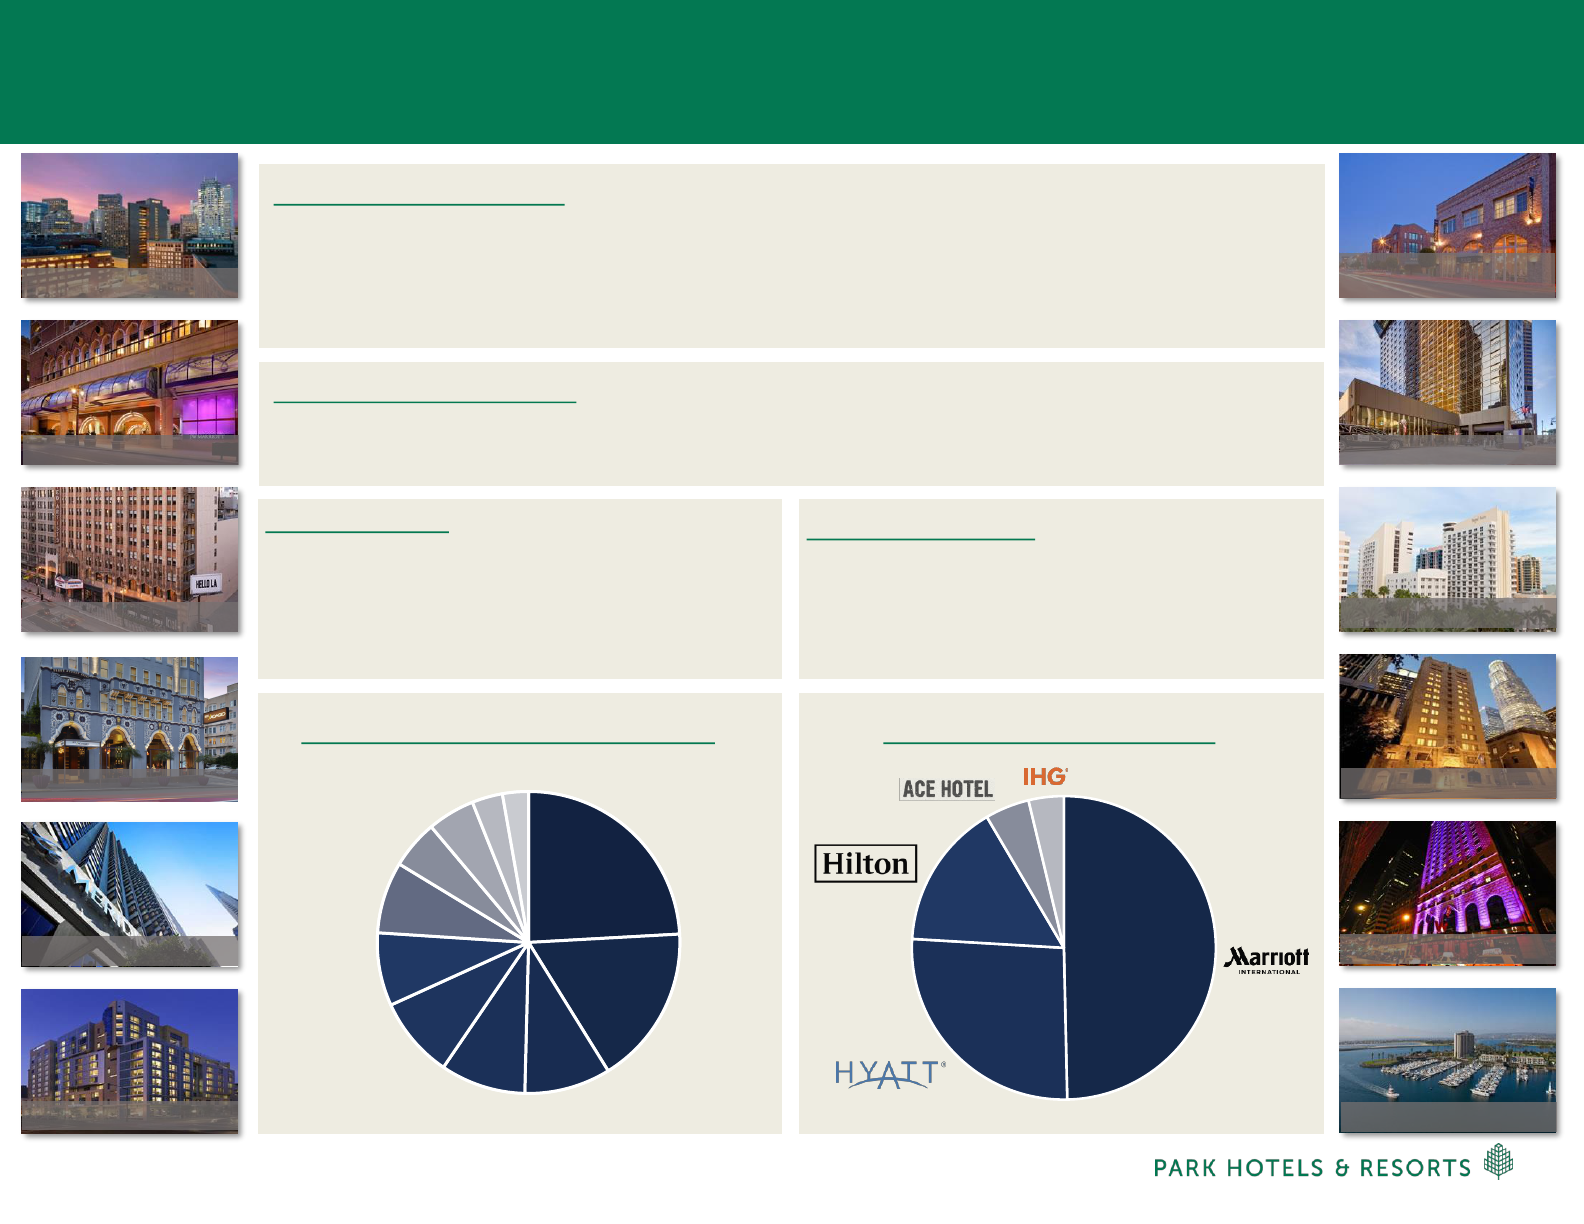
Chesapeake Lodging Trust at a Glance
COMPANY OVERVIEW
▪ Full-service hotel REIT with an ownership in 20 high quality hotels (6,288 keys). The portfolio is
concentrated across several high growth markets including San Francisco, Boston, Miami, Denver, San
Diego, Los Angeles and Chicago
OPERATING STATISTICS
▪ ‘18 RevPAR: $195 (2
nd
highest among peers)
▪ ‘18 Hotel Adj. EBITDA Margins: 32.4% (2
nd
highest among peers)
2018 RESULTS
▪ ’18 RevPAR Growth: +4.3% (highest among
peers)
▪ ’18 Hotel Adj. EBITDA Margins: +80bps (2
nd
highest among peers)
2019 OUTLOOK
(2)
▪ RevPAR Growth: +1.5% to +3.5% (peers at 1.7%)
▪ Hotel Adj. EBITDA Margins: -15bps to +60bps
(50bps above peers)
BRAND DIVERSIFICATION
(1)
50%
26%
15%
5%
4%
GEOGRAPHIC DIVERSIFICATION
(1)
San
Francisco
Boston
Denver
Miami
San
Diego
Los
Angeles
Chicago
New Orleans
New York
Seattle
D.C.
24%
17%
9%
9%
9%
8%
8%
5%
5%
3%
3%
(1) Based on 2018 Adjusted Hotel EBITDAre as reported for CHSP’s 20 hotels
(2) Based on full-year guidance provided by Chesapeake on February 21, 2019
Hyatt Regency Boston
JW Marriott San Francisco
Ace Hotel and Theater
Hotel Adagio, Autograph
Le Meridien San Francisco
Hotel Indigo San Diego
Hyatt Centric Fisherman’s Wharf
Royal Palm South Beach
Hilton Checkers LA
W Chicago City Center
Hyatt Regency Mission Bay
6
Hilton Denver City Center
9 |
Combination Creates Unparalleled Portfolio of High Quality
Upper Upscale and Luxury Hotels
COMPARABLE OPERATING METRICS
(4)
Occupancy (FY 2018)
Average Daily Rate (FY 2018)
Room RevPAR (FY 2018)
82.7%
$221
$182
82.0% 85.5%
$215 $229
$176 $195
PRO FORMA
# of Keys (at 100%)
Meeting Space (SF)
35,383
2,694K
# of Hotels
66
51 20
30,500 6,288
2,499K 259K
2018 Hotel Adjusted EBITDA per Key
(2)
$29.7K
$29.0K $30.3K
(1) Standalone Park property level data excludes Hilton Chicago O’Hare Airport, where the ground lease expired in December 2018, Pointe Hilton Squaw Peak Resort sold in
February 2019 and Hilton Nuremberg sold in March 2019
(2) Hotel Adjusted EBITDA per key figures based on consolidated properties plus unconsolidated JVs at share
(3) Includes Park’s pro rata share of EBITDA from unconsolidated joint ventures
(4) 2018 operating results based on comparable portfolio of 57 hotels. Comparable operating metrics exclude unconsolidated joint venture properties and Caribe Hilton, and
assets disposed of prior to 3/31/19. Pro Forma Park also excludes assets anticipated to be sold in the contemplated transaction
12
PROPERTY LEVEL DATA
Prior to closing, Park expects that the sales of both of Chesapeake’s NYC hotels, plus three non-core PK legacy hotels, will be
completed. Gross proceeds for all five hotels are expected to be approximately $300M
(1)
2018 Hotel Adjusted EBITDA
(3)
2018 Hotel Adjusted EBITDA Margin
$942M
29.7%
$779M $191M
29.1% 32.4%
# of Hotels
57
42 20
Note: Figures reflect the 48 legacy Park hotels, plus 18 Chesapeake hotels comprising Pro Forma Park. EBITDA in 2018 for the five hotels to be sold was approx. $27M

10 |
Strategic Rationale
PK: Waldorf Astoria Orlando CHSP: Royal Palm South Beach Miami
PK: Casa Marina, A Waldorf-Astoria Resort CHSP: Hotel Adagio San Francisco
9

11 |
Quality: CHSP Complements PK with a High Quality Portfolio
Top 25 Hotels by RevPAR
(1)
Contribute 58% of Total Pro Forma PK Hotel EBITDA
$197
Legacy PK
Top 25 Hotel RevPAR
$235
Pro Forma PK
Top 25 Hotel RevPAR
12 (shaded blue) of CHSP’s 18 assets are in the Top 25 Hotels of Pro Forma Park by 2018 RevPAR
13
Rooms
2018 Operating Results
2018 EBITDA /
Hotel City State
(UJV At Share)
RevPAR Margin EBITDA Key
1. JW Marriott San Francisco Union Square San Francisco CA 344 $310 28.0% $14 $40K
2. Casa Marina, A Waldorf Astoria Resort Key West FL 311 299 39.7% 20 $66K
3. Le Meridien San Francisco San Francisco CA 360 289 35.9% 16 $45K
4. The Reach, A Waldorf Astoria Resort Key West FL 150 280 37.2% 8 $55K
5. New York Hilton Midtown New York NY 1,878 260 18.4% 53 $28K
6. Hotel Adagio SF Autograph Collection San Francisco CA 171 253 37.8% 7 $39K
7. Hilton Hawaiian Village Waikiki Beach Resort Honolulu HI 2,860 244 39.6% 159 $56K
8. Parc 55 San Francisco - a Hilton Hotel San Francisco CA 1,024 241 31.6% 33 $32K
9. Hyatt Centric Fishermans Wharf San Francisco CA 316 237 27.8% 10 $30K
10. Ace Hotel and Theater Los Angeles Los Angeles CA 182 234 30.8% 9 $49K
11. Hilton San Francisco Union Square San Francisco CA 1,921 232 28.8% 66 $35K
12. Hyatt Regency Boston Boston MA 502 232 40.5% 22 $43K
13. Waldorf Astoria Orlando Orlando FL 502 221 29.7% 22 $44K
14. Juniper Hotel Cupertino, Curio Collection by Hilton Cupertino CA 224 216 40.3% 9 $38K
15. W New Orleans French Quarter New Orleans LA 97 216 24.9% 3 $28K
16. Hilton Checkers Los Angeles Los Angeles CA 193 211 34.9% 6 $31K
17. Hilton Boston Logan Airport Boston MA 599 210 29.2% 17 $28K
18. Royal Palm South Beach Miami Miami FL 393 204 42.9% 17 $44K
19. Embassy Suites by Hilton Washington DC Georgetown Washington D.C. DC 197 193 35.8% 6 $30K
20. DoubleTree by Hilton Hotel San Jose San Jose CA 505 193 30.8% 15 $30K
21. Hilton Santa Barbara Beachfront Resort Santa Barbara CA 180 192 38.0% 15 $83K
22. Hotel Indigo San Diego Gaslamp Quarter San Diego CA 210 186 42.2% 7 $34K
23. W Chicago City Center Chicago IL 403 183 22.0% 7 $19K
24. Homewood Suites Seattle Seattle WA 195 181 45.5% 6 $32K
25. Embassy Suites by Hilton Austin Downtown Town Lake Austin TX 259 163 31.4% 5 $21K
Pro Forma Top 25 Hotels by RevPAR - Total / Wtd. Avg. 13,976 $235 31.8% $552 $40k
Total Pro Forma Portfolio (66 Hotels) - Total / Wtd. Avg. 31,503 $182 29.7% $942 $30k
Note: 2018 operating results based on comparable portfolio of 57 hotels. Comparable operating metrics exclude Unconsolidated Joint Venture properties and Caribe Hilton, and
assets disposed of prior to 3/31/19. Pro Forma Park also excludes assets anticipated to be sold in the contemplated transaction
(1) Top 25 excludes unconsolidated joint venture properties
12 |
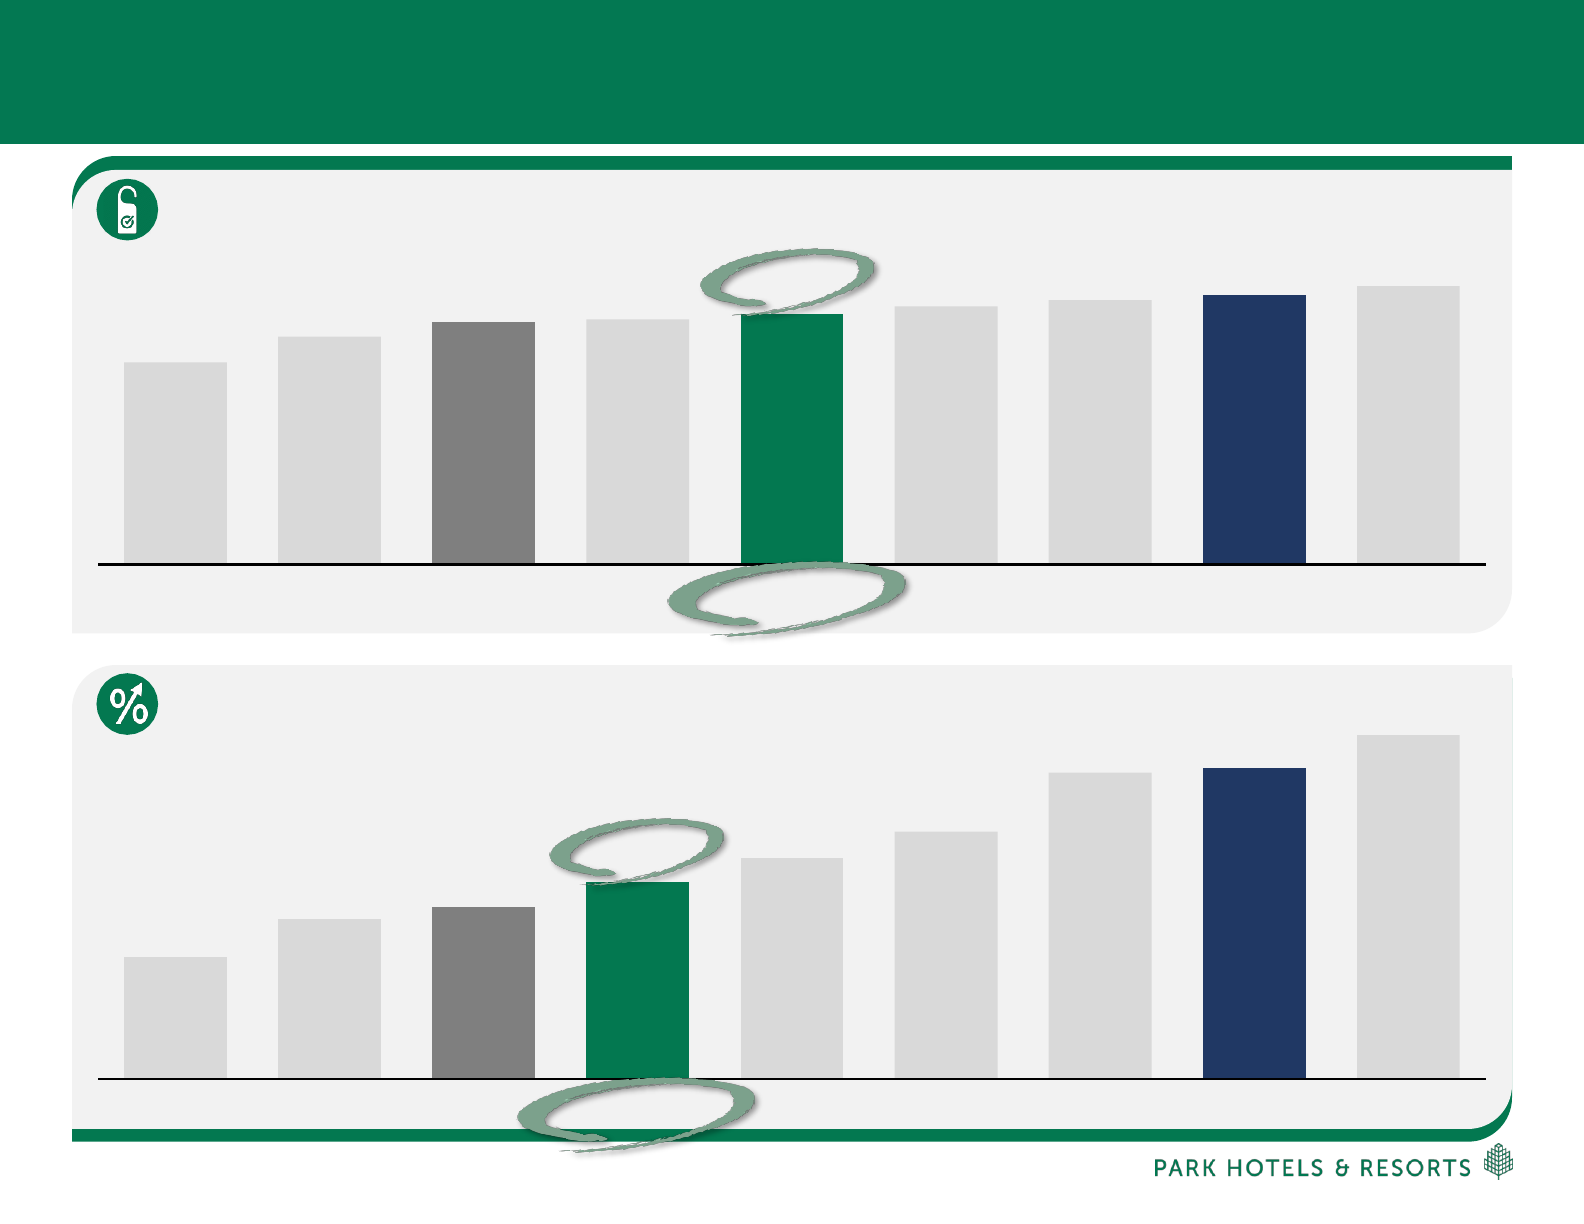
$202
$195
$192
$187
$182
$178 $176
$165
$147
PEBCHSPSHODRHPro Forma PKHSTPKXHRRHP
33.2%
32.4%
32.3%
30.9%
30.3%
29.7%
29.1%
28.8%
27.9%
RHPCHSPPEBSHODRHPro Forma PKPKHSTXHR
Quality: Accretive to Key Operating Metrics
2018 Comparable RevPAR: PRO FORMA PK vs. PEERS
2018 Comparable Hotel EBITDA Margin: PRO FORMA PK vs. PEERS
13 |
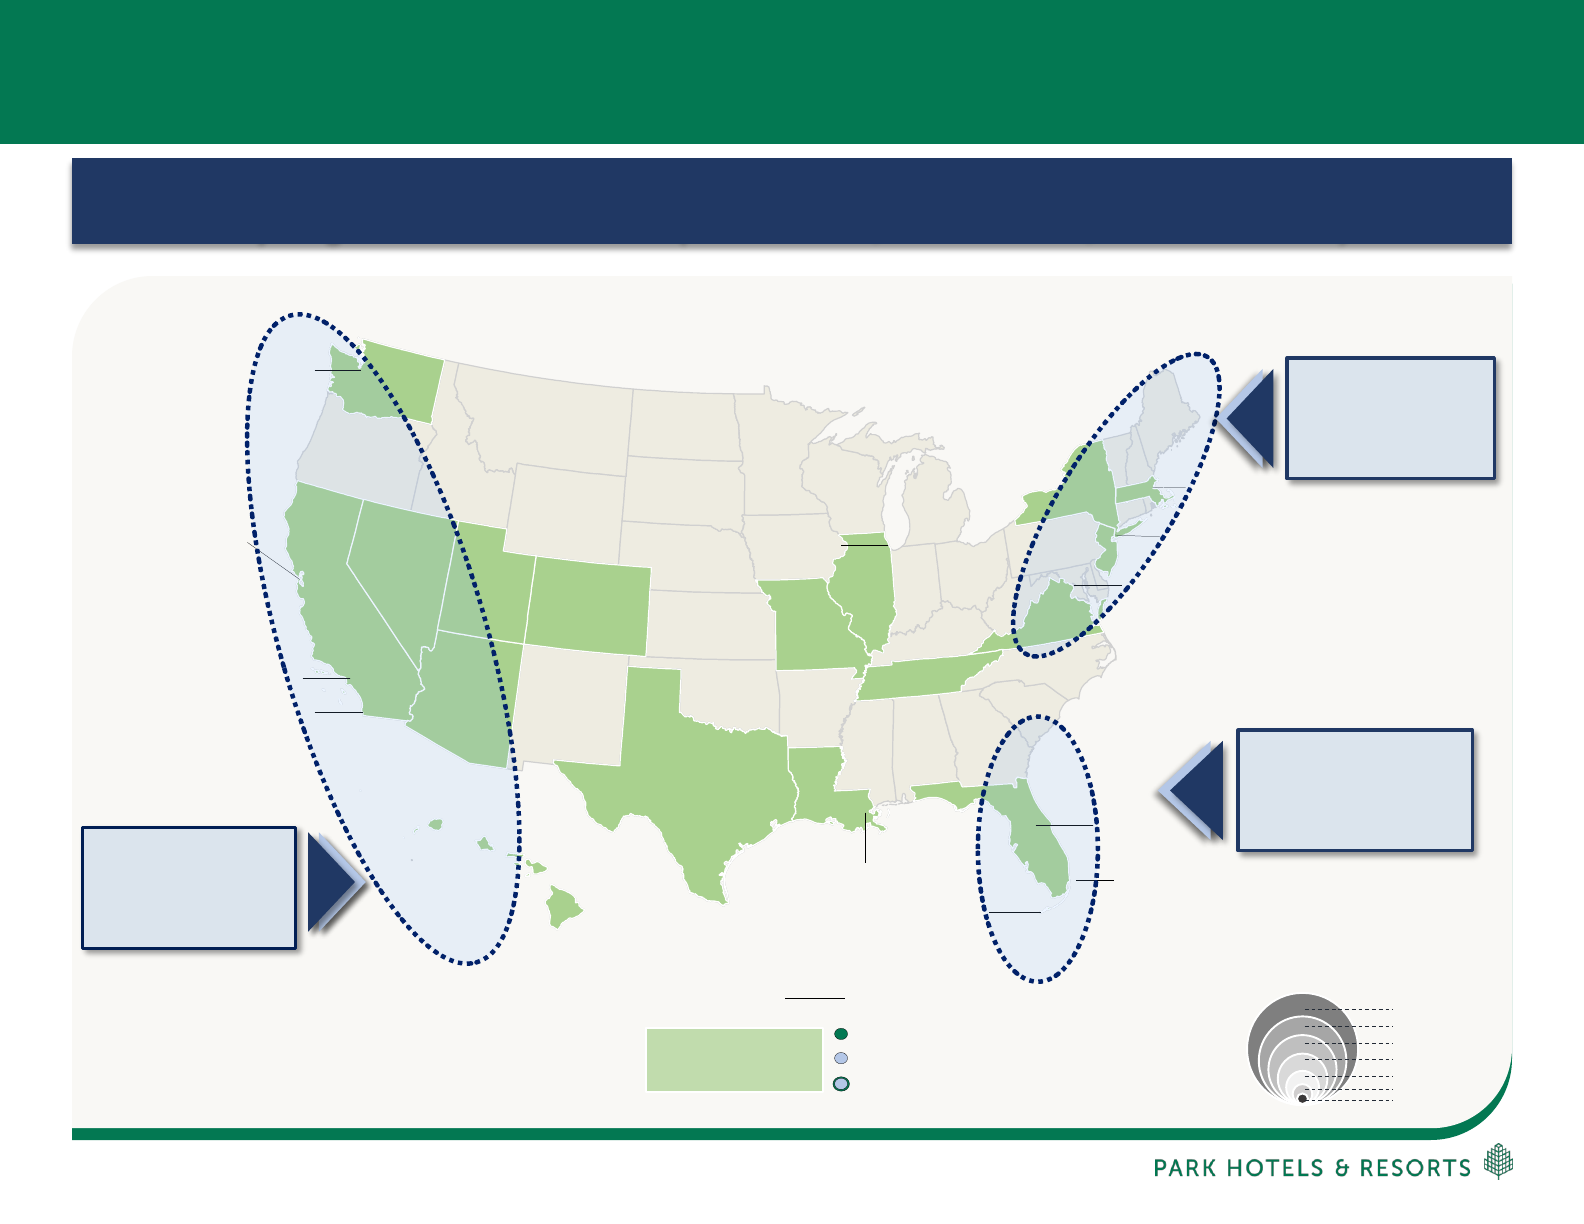
Diversification: Pro Forma Park Operating Portfolio
14
Transaction expands presence across San Francisco, San Diego and New Orleans, while
layering in several new markets (Miami Beach, Downtown LA, Boston & Denver)
$100M+
$50M+
$25M+
$10M+
$5–10M
<$5M
$200M+
⚫
⚫
⚫
⚫
⚫
⚫
⚫
⚫
⚫
⚫
⚫
⚫
⚫
⚫
⚫
⚫
⚫
⚫
⚫
⚫
⚫
⚫
⚫
⚫
⚫
⚫
⚫
⚫
1175587_2.wor (NY008V6E)
New York
New York
New York
New York
New York
New York
New York
New York
New York
New York
New York
New York
New York
New York
New York
New York
New York
New York
New York
New York
New York
New York
New York
New York
New York
New York
New York
New York
New York
New York
New York
New York
New York
New York
New York
New York
New York
New York
New York
New York
New York
New York
New York
New York
New York
New York
New York
New York
New York
Boston
Boston
Boston
Boston
Boston
Boston
Boston
Boston
Boston
Boston
Boston
Boston
Boston
Boston
Boston
Boston
Boston
Boston
Boston
Boston
Boston
Boston
Boston
Boston
Boston
Boston
Boston
Boston
Boston
Boston
Boston
Boston
Boston
Boston
Boston
Boston
Boston
Boston
Boston
Boston
Boston
Boston
Boston
Boston
Boston
Boston
Boston
Boston
Boston
Washington D.C.
Washington D.C.
Washington D.C.
Washington D.C.
Washington D.C.
Washington D.C.
Washington D.C.
Washington D.C.
Washington D.C.
Washington D.C.
Washington D.C.
Washington D.C.
Washington D.C.
Washington D.C.
Washington D.C.
Washington D.C.
Washington D.C.
Washington D.C.
Washington D.C.
Washington D.C.
Washington D.C.
Washington D.C.
Washington D.C.
Washington D.C.
Washington D.C.
Washington D.C.
Washington D.C.
Washington D.C.
Washington D.C.
Washington D.C.
Washington D.C.
Washington D.C.
Washington D.C.
Washington D.C.
Washington D.C.
Washington D.C.
Washington D.C.
Washington D.C.
Washington D.C.
Washington D.C.
Washington D.C.
Washington D.C.
Washington D.C.
Washington D.C.
Washington D.C.
Washington D.C.
Washington D.C.
Washington D.C.
Washington D.C.
Los Angeles
Los Angeles
Los Angeles
Los Angeles
Los Angeles
Los Angeles
Los Angeles
Los Angeles
Los Angeles
Los Angeles
Los Angeles
Los Angeles
Los Angeles
Los Angeles
Los Angeles
Los Angeles
Los Angeles
Los Angeles
Los Angeles
Los Angeles
Los Angeles
Los Angeles
Los Angeles
Los Angeles
Los Angeles
Los Angeles
Los Angeles
Los Angeles
Los Angeles
Los Angeles
Los Angeles
Los Angeles
Los Angeles
Los Angeles
Los Angeles
Los Angeles
Los Angeles
Los Angeles
Los Angeles
Los Angeles
Los Angeles
Los Angeles
Los Angeles
Los Angeles
Los Angeles
Los Angeles
Los Angeles
Los Angeles
Los Angeles
San Diego
San Diego
San Diego
San Diego
San Diego
San Diego
San Diego
San Diego
San Diego
San Diego
San Diego
San Diego
San Diego
San Diego
San Diego
San Diego
San Diego
San Diego
San Diego
San Diego
San Diego
San Diego
San Diego
San Diego
San Diego
San Diego
San Diego
San Diego
San Diego
San Diego
San Diego
San Diego
San Diego
San Diego
San Diego
San Diego
San Diego
San Diego
San Diego
San Diego
San Diego
San Diego
San Diego
San Diego
San Diego
San Diego
San Diego
San Diego
San Diego
New Orleans
New Orleans
New Orleans
New Orleans
New Orleans
New Orleans
New Orleans
New Orleans
New Orleans
New Orleans
New Orleans
New Orleans
New Orleans
New Orleans
New Orleans
New Orleans
New Orleans
New Orleans
New Orleans
New Orleans
New Orleans
New Orleans
New Orleans
New Orleans
New Orleans
New Orleans
New Orleans
New Orleans
New Orleans
New Orleans
New Orleans
New Orleans
New Orleans
New Orleans
New Orleans
New Orleans
New Orleans
New Orleans
New Orleans
New Orleans
New Orleans
New Orleans
New Orleans
New Orleans
New Orleans
New Orleans
New Orleans
New Orleans
New Orleans
Key West
Key West
Key West
Key West
Key West
Key West
Key West
Key West
Key West
Key West
Key West
Key West
Key West
Key West
Key West
Key West
Key West
Key West
Key West
Key West
Key West
Key West
Key West
Key West
Key West
Key West
Key West
Key West
Key West
Key West
Key West
Key West
Key West
Key West
Key West
Key West
Key West
Key West
Key West
Key West
Key West
Key West
Key West
Key West
Key West
Key West
Key West
Key West
Key West
Miami
Miami
Miami
Miami
Miami
Miami
Miami
Miami
Miami
Miami
Miami
Miami
Miami
Miami
Miami
Miami
Miami
Miami
Miami
Miami
Miami
Miami
Miami
Miami
Miami
Miami
Miami
Miami
Miami
Miami
Miami
Miami
Miami
Miami
Miami
Miami
Miami
Miami
Miami
Miami
Miami
Miami
Miami
Miami
Miami
Miami
Miami
Miami
Miami
Orlando
Orlando
Orlando
Orlando
Orlando
Orlando
Orlando
Orlando
Orlando
Orlando
Orlando
Orlando
Orlando
Orlando
Orlando
Orlando
Orlando
Orlando
Orlando
Orlando
Orlando
Orlando
Orlando
Orlando
Orlando
Orlando
Orlando
Orlando
Orlando
Orlando
Orlando
Orlando
Orlando
Orlando
Orlando
Orlando
Orlando
Orlando
Orlando
Orlando
Orlando
Orlando
Orlando
Orlando
Orlando
Orlando
Orlando
Orlando
Orlando
Seattle
Seattle
Seattle
Seattle
Seattle
Seattle
Seattle
Seattle
Seattle
Seattle
Seattle
Seattle
Seattle
Seattle
Seattle
Seattle
Seattle
Seattle
Seattle
Seattle
Seattle
Seattle
Seattle
Seattle
Seattle
Seattle
Seattle
Seattle
Seattle
Seattle
Seattle
Seattle
Seattle
Seattle
Seattle
Seattle
Seattle
Seattle
Seattle
Seattle
Seattle
Seattle
Seattle
Seattle
Seattle
Seattle
Seattle
Seattle
Seattle
Chicago
Chicago
Chicago
Chicago
Chicago
Chicago
Chicago
Chicago
Chicago
Chicago
Chicago
Chicago
Chicago
Chicago
Chicago
Chicago
Chicago
Chicago
Chicago
Chicago
Chicago
Chicago
Chicago
Chicago
Chicago
Chicago
Chicago
Chicago
Chicago
Chicago
Chicago
Chicago
Chicago
Chicago
Chicago
Chicago
Chicago
Chicago
Chicago
Chicago
Chicago
Chicago
Chicago
Chicago
Chicago
Chicago
Chicago
Chicago
Chicago
San Francisco
San Francisco
San Francisco
San Francisco
San Francisco
San Francisco
San Francisco
San Francisco
San Francisco
San Francisco
San Francisco
San Francisco
San Francisco
San Francisco
San Francisco
San Francisco
San Francisco
San Francisco
San Francisco
San Francisco
San Francisco
San Francisco
San Francisco
San Francisco
San Francisco
San Francisco
San Francisco
San Francisco
San Francisco
San Francisco
San Francisco
San Francisco
San Francisco
San Francisco
San Francisco
San Francisco
San Francisco
San Francisco
San Francisco
San Francisco
San Francisco
San Francisco
San Francisco
San Francisco
San Francisco
San Francisco
San Francisco
San Francisco
San Francisco
⚫
1175587_1.wor (NY008V6E)
Hawaii
Hawaii
Hawaii
Hawaii
Hawaii
Hawaii
Hawaii
Hawaii
Hawaii
Hawaii
Hawaii
Hawaii
Hawaii
Hawaii
Hawaii
Hawaii
Hawaii
Hawaii
Hawaii
Hawaii
Hawaii
Hawaii
Hawaii
Hawaii
Hawaii
Hawaii
Hawaii
Hawaii
Hawaii
Hawaii
Hawaii
Hawaii
Hawaii
Hawaii
Hawaii
Hawaii
Hawaii
Hawaii
Hawaii
Hawaii
Hawaii
Hawaii
Hawaii
Hawaii
Hawaii
Hawaii
Hawaii
Hawaii
Hawaii
⚫
⚫
Puerto Rico International
15%
2018 Hotel EBITDA
(1)
Northeast Markets
17%
2018 Hotel EBITDA
(1)
Florida Markets
50%
2018 Hotel EBITDA
(1)
West Coast &
Hawaii Markets
States with
PF PK Presence
PK
CHSP
Overlapping
Legend
Note: Circle Size Based on Hotel EBITDA
(1) Pro Forma 2018 Hotel Adjusted EBITDA
14 |
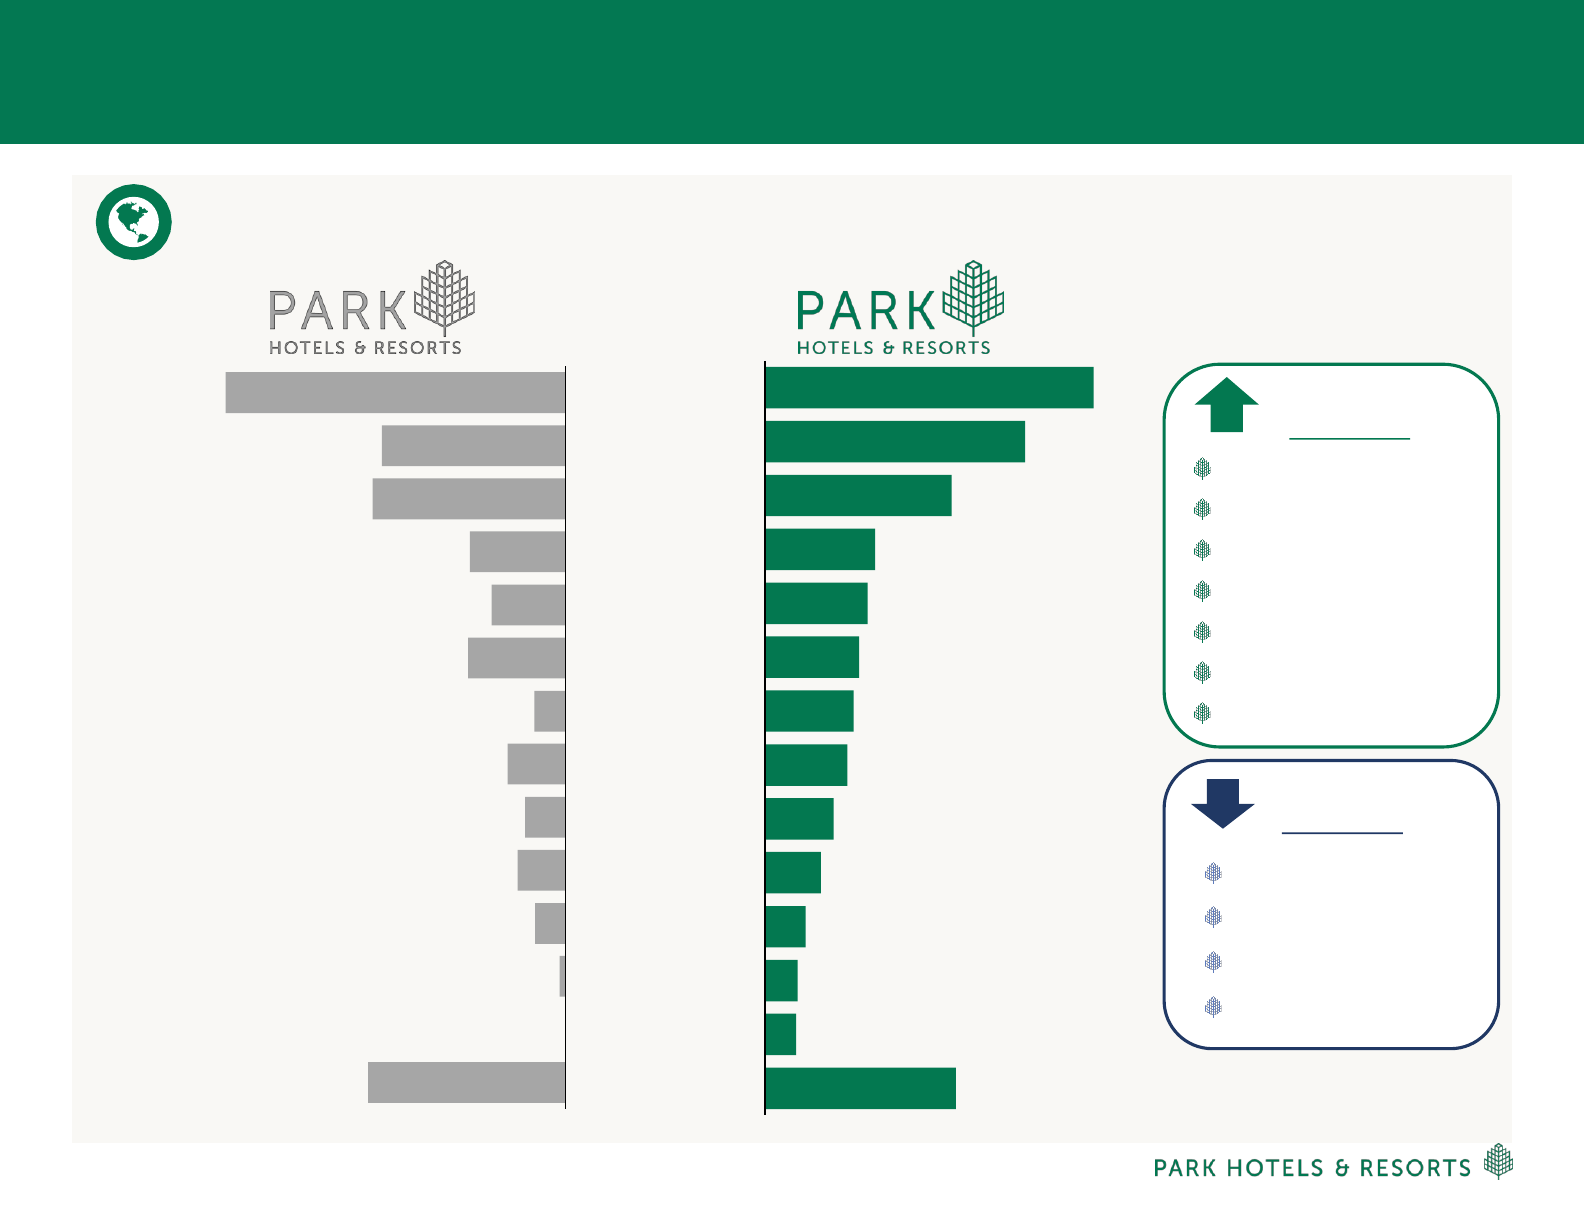
Diversification: Enhanced Geographic Exposure
(1) Defined by FY 2018 Hotel Adjusted EBITDA by market on an as reported and Pro Forma basis, respectively
STANDALONE PK VS. PRO FORMA PK GEOGRAPHIC DIVERSITY
(1)
Increased
Exposure
San Francisco: +300bps
Boston: +300bps
Los Angeles: +200bps
Denver: +200bps
South Florida: +100bps
San Diego: +100bps
Chicago: +100bps
Reduced
Exposure
Hawaii: -400bps
Orlando: -300bps
New York: -100bps
Other: -300bps
PRO FORMASTANDALONE
15
20%
16%
11%
7%
6%
6%
5%
5%
4%
3%
2%
2%
2%
11%
Hawaii
San Francisco
Orlando
New Orleans
New York
South Florida
Boston
Chicago
San Diego
Washington D.C.
Seattle
Los Angeles
Denver
Other
24%
13%
14%
7%
5%
7%
2%
4%
3%
3%
2%
0%
0%
14%
15 |
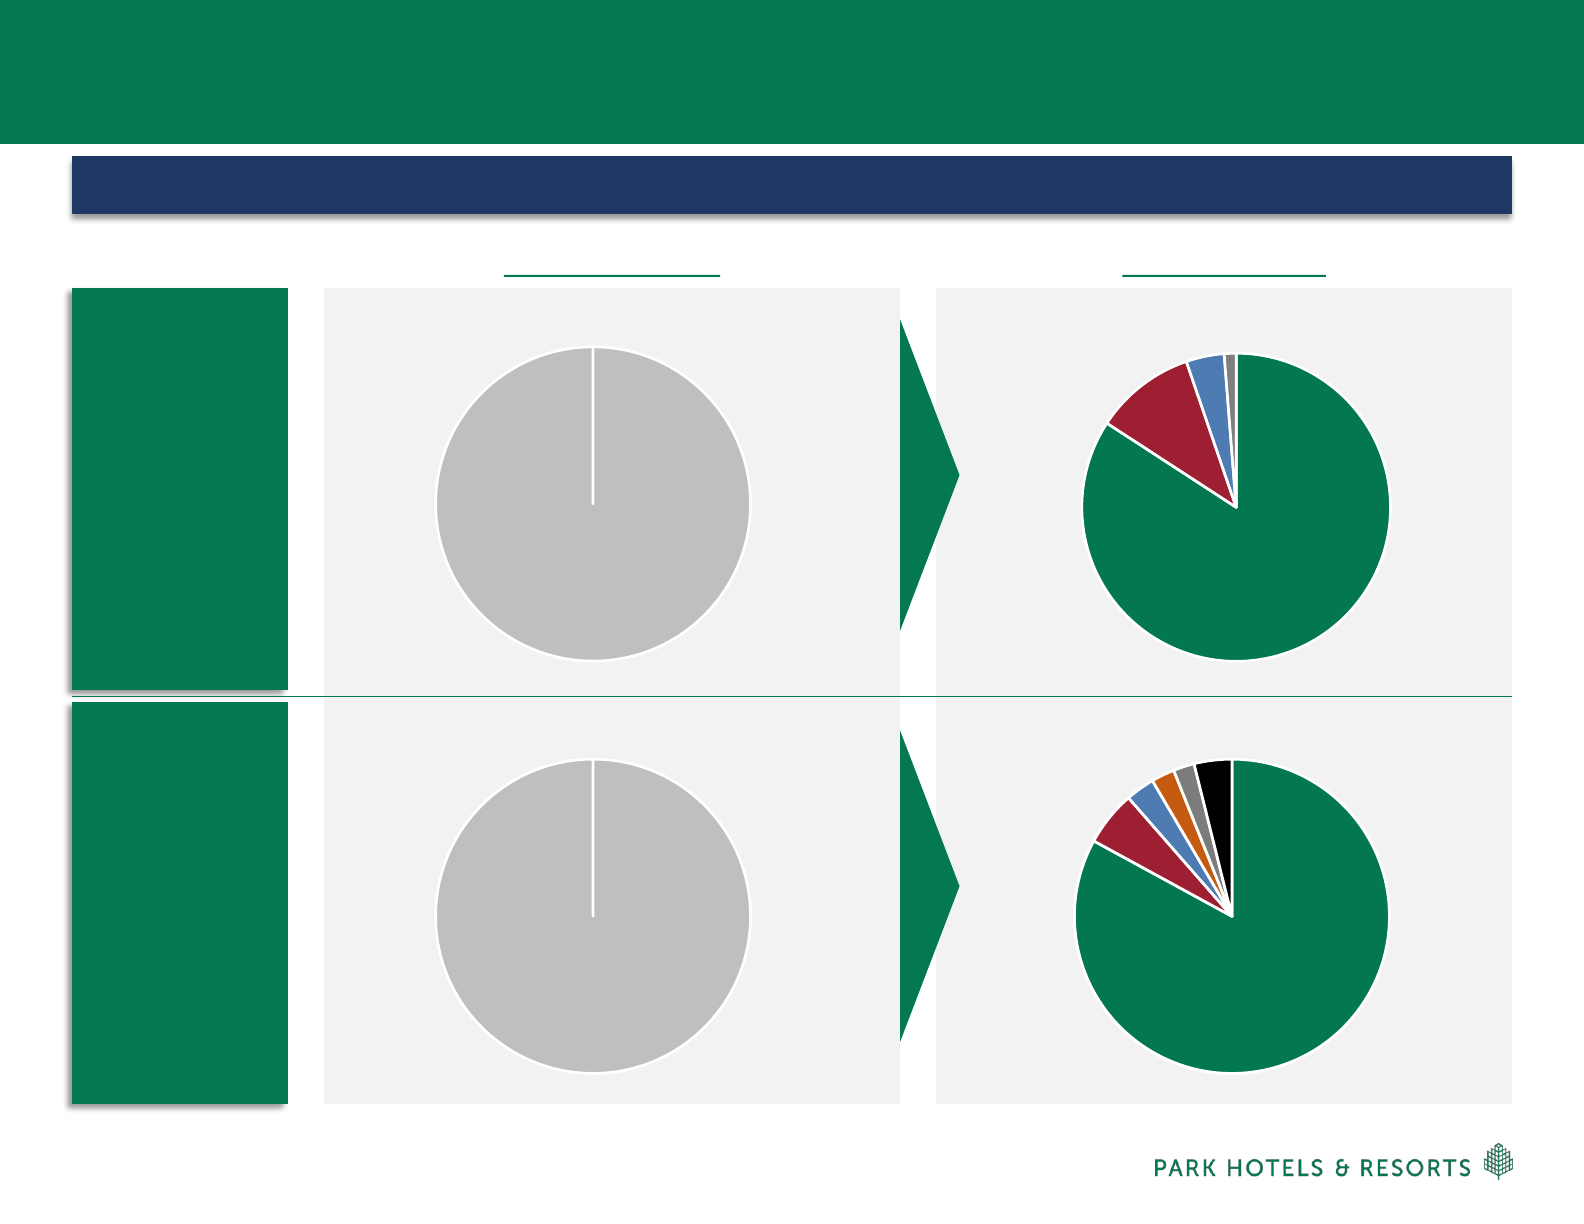
Hilton
100%
Hilton
84%
Marriott ⁽¹⁾
11%
Hyatt ⁽¹⁾
4%
Other ⁽¹⁾
1%
Hilton
100%
Diversification: Brand and Operator Mix
Transaction advances Park’s brand strategy, providing exposure to Marriott and Hyatt
Note: Based on the total number of guestrooms (consolidated + Unconsolidated JVs at share) of the Pro Forma combined company
Note: Other Brands include IHG and Ace. Other Operators include TPG Hospitality, Crestline Hotels & Resorts, IHG and Ace Hotel Group
(1) Pro Forma Park will own 51 Hilton branded hotels, 10 Marriott branded hotels, 3 Hyatt branded hotels, 1 IHG branded hotel and 1 Ace branded hotel
Standalone Park Pro Forma Park
Hilton
Marriott
Hyatt
HEI
Aimbridge
Other
83%
6%
3%
2%
2%
4%
16
BRAND
MIX
OPERATOR
MIX
16 |
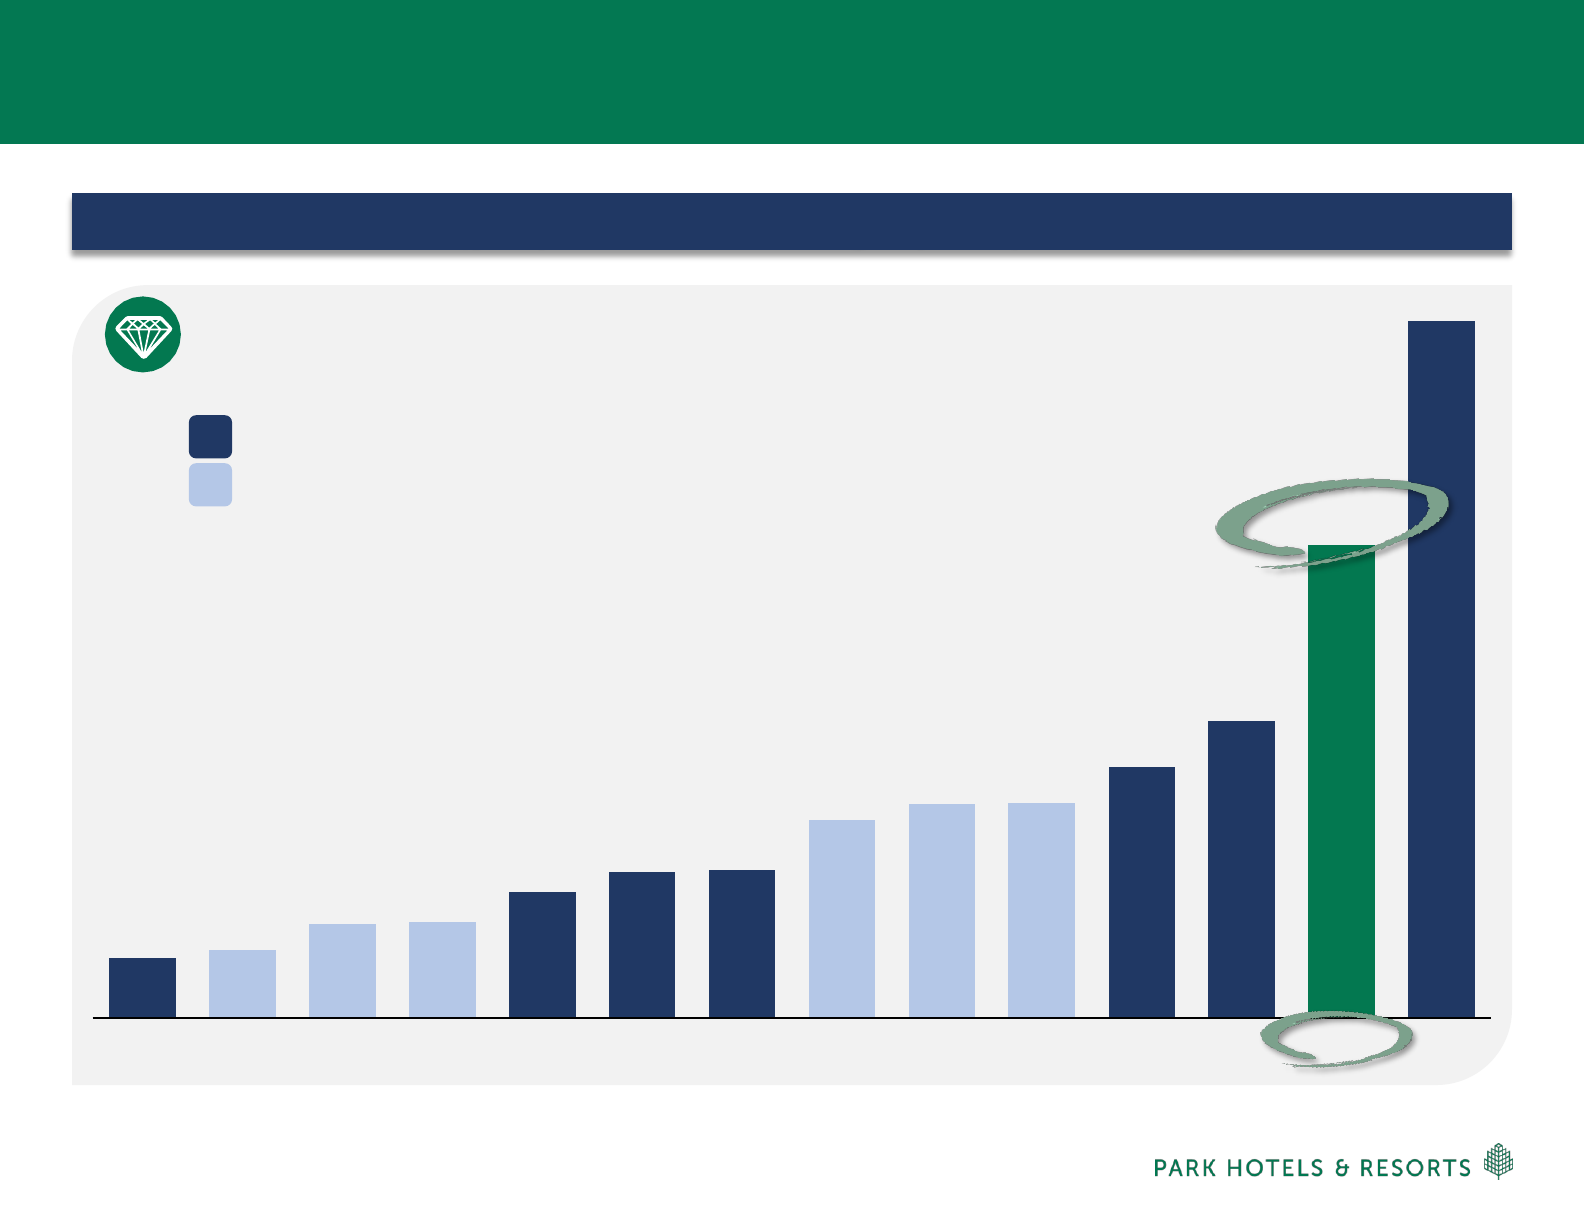
Park will solidify its position as the 2nd largest publicly traded Lodging REIT
Source: Public company filings as of December 31, 2018 and FactSet. Market data as of May 3, 2019
(1) Average Lodging REIT Total Enterprise Value equates to $4.1 billion, which excludes HST and PK
ENTERPRISE VALUE: PRO FORMA PK vs. PEERS
Full Service
Mixed & Limited Service
$1.5B
$1.7B
$2.4B
$2.5B
$3.2B
$3.7B
$3.8B
$5.0B
$5.4B
$5.5B
$6.4B
$7.6B
$12.0B
$17.7B
BHR CLDT INN HT DRH XHR SHO AHT APLE RLJ RHP PEB PF PARK HST
Size & Scale: Nearly 3x the Size of the Average Lodging REIT
(1)
17 |
Value Creation: Internal Growth Story 2.0
G&A Savings
8
Near-Term
Revenue
Synergies
Expense
Savings
Incremental
Expenses
Future
Potential
Expect to Realize Full-Run Rate in 2+ Years 2020 2021
Estimated Synergies
Estimated Synergies
~$24 Million
~$34 Million
◼ Cash G&A of $9M
◼ Non-Cash comp of $8M
$17M
$17M
◼ New Destination Fees
◼ Parking upside
◼ Other fee reductions
◼ ROI Projects: Additional keys; Expand meeting space
$8M to $12M
◼ Revenue Management: Grouping Up (150bps of upside) and Remixing the Mix
◼ F&B Revenues: Menu engineering/pricing, added group catering contribution
◼ Destination Fees: Marginally increase rates, while improving capture rate
$11M
$20M
◼ Renegotiate fees
◼ Franchise conversions
◼ F&B Expense: Food costs, menu engineering, productivity, hours of operations
$2M
$3M
◼ Incremental property tax (Prop 13) and insurance expense
($5M)
($6M)
Incremental EBITDA of Approx. $24M in 2020 & $34M in 2021
Translating into ~$375M
(1)
of Value Creation, or $1.50+ per share
(1) Assumes a 12.5x valuation multiple, discounted back 2 years
Note: Actual future incremental EBITDA may differ materially from this hypothetical presentation. Please see the forward-looking statements disclaimer on slide 36 of this presentation for a
discussion of the risks that could cause actual results to differ materially from any potential or estimated results
18 |
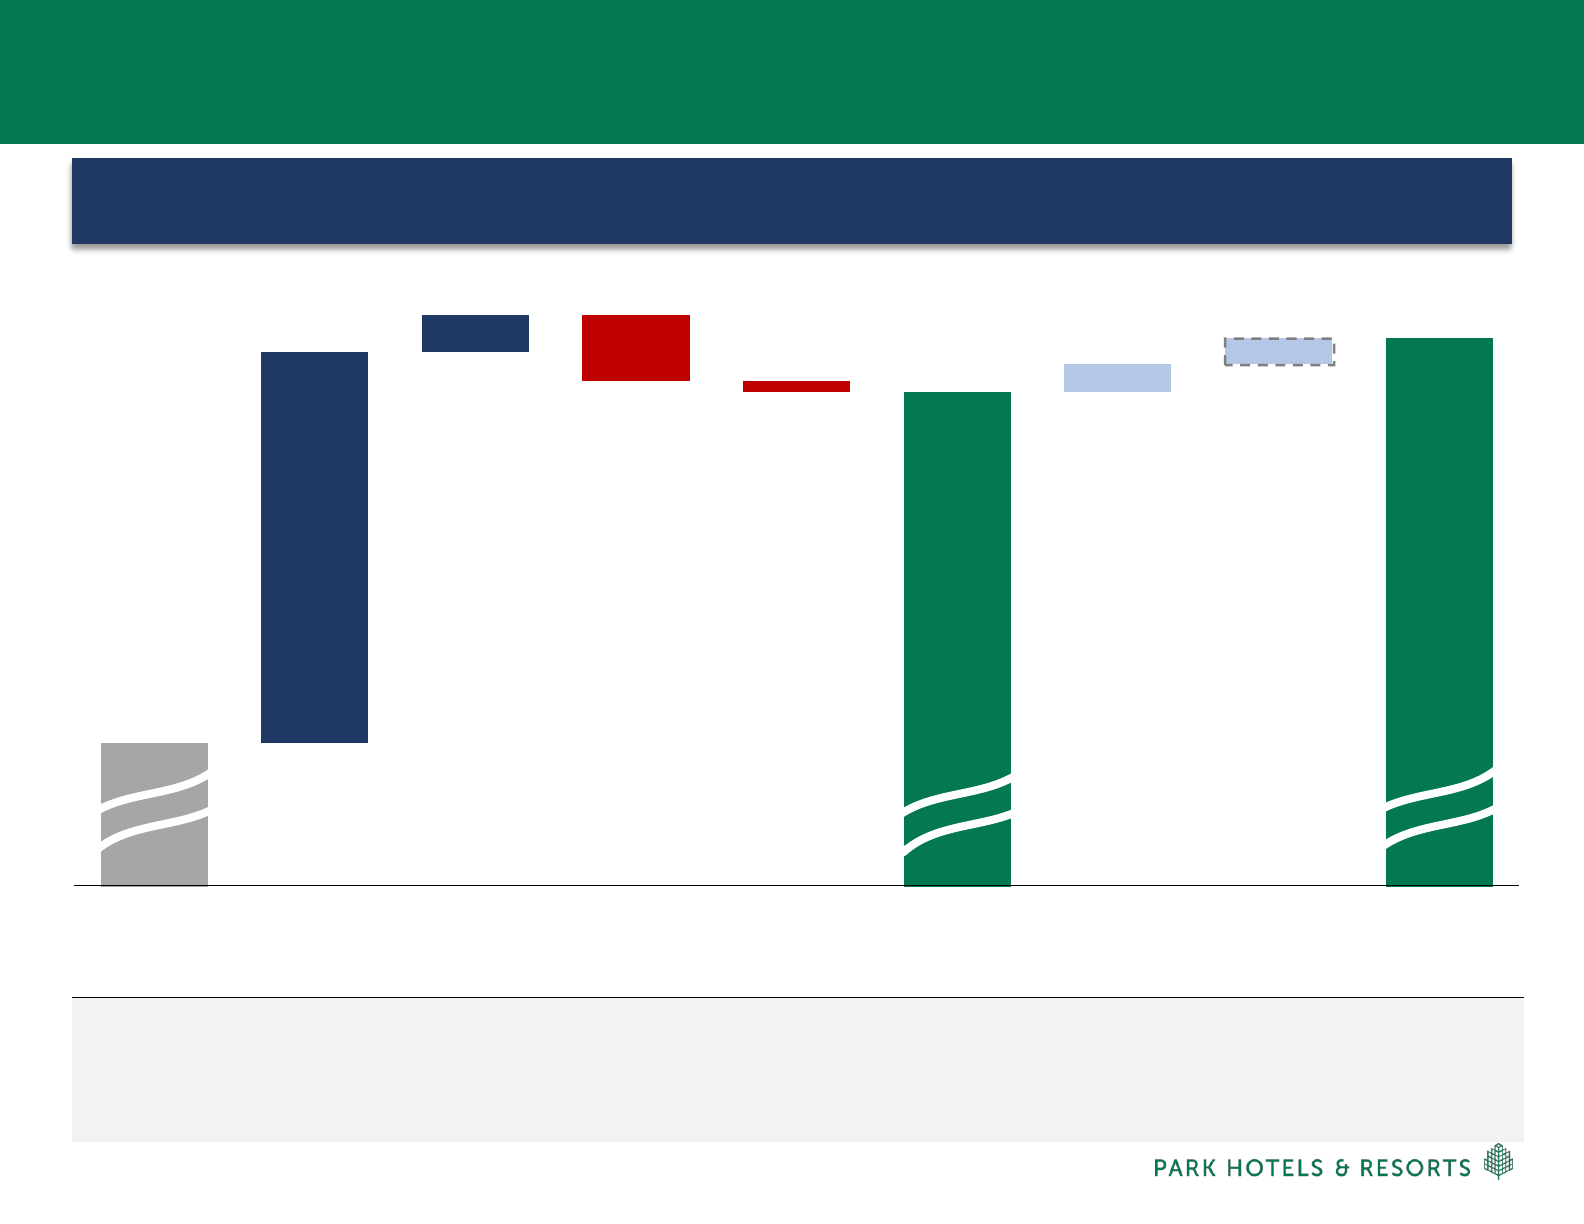
Adjusted EBITDA Bridge
$925
$950
$178
$17
($30)
($5)
$13
$8 to $12M
$765
2019E PK
Standalone
Adj. EBITDA
+ 2019E CHSP
Standalone
Corporate
Adj. EBITDAre
+ Corporate G&A
Savings
- Hotel EBITDA from
Asset Sales
- Incremental
Property Tax &
Insurance
Pro Forma
Adj. EBITDA
+ 2020E Upside
Opportunities
+ Future Upside
Opportunities
Combined
Company with
Upside
Opportunities
Combined company projected to generate ~$925M of Adjusted EBITDA on a run-rate basis Pro Forma for 2019
and potential for an additional ~$25M of incremental EBITDA from upside opportunities over time
Addition of
destination fees,
parking upside &
select ROI projects;
see slide 17 for
details
2020E Asset
management
initiatives, see slide
17 for details
Mgmt. estimate,
assumes ~$2M of
incremental G&A
to operate
combined platform
Includes sale of
CHSP’s 2 NYC
assets and 3 non-
core legacy Park
assets
1Q19 Updated
Outlook, Midpoint
2019 Outlook, as
reflected in CHSP’s
2/21/19 press
release,
Midpoint
(1)
ASSUMPTIONS:
Note: Dollar in millions
Mgmt. estimate;
see slide 17 for
details
Note: Actual future Adj. Corporate EBITDA may differ materially from this hypothetical presentation. Please see the forward-looking statements disclaimer on slide 36 of this
presentation for a discussion of the risks that could cause actual results to differ materially from any potential or estimated results
(1)
Chesapeake’s 2019 Outlook was prepared by Chesapeake in February 2019 (and has not been updated) and is based on a number of factors, many of which are outside Chesapeake’s
control and all of which are subject to change (and do not reflect the impacts and other effects of the proposed merger transactions).
19 |
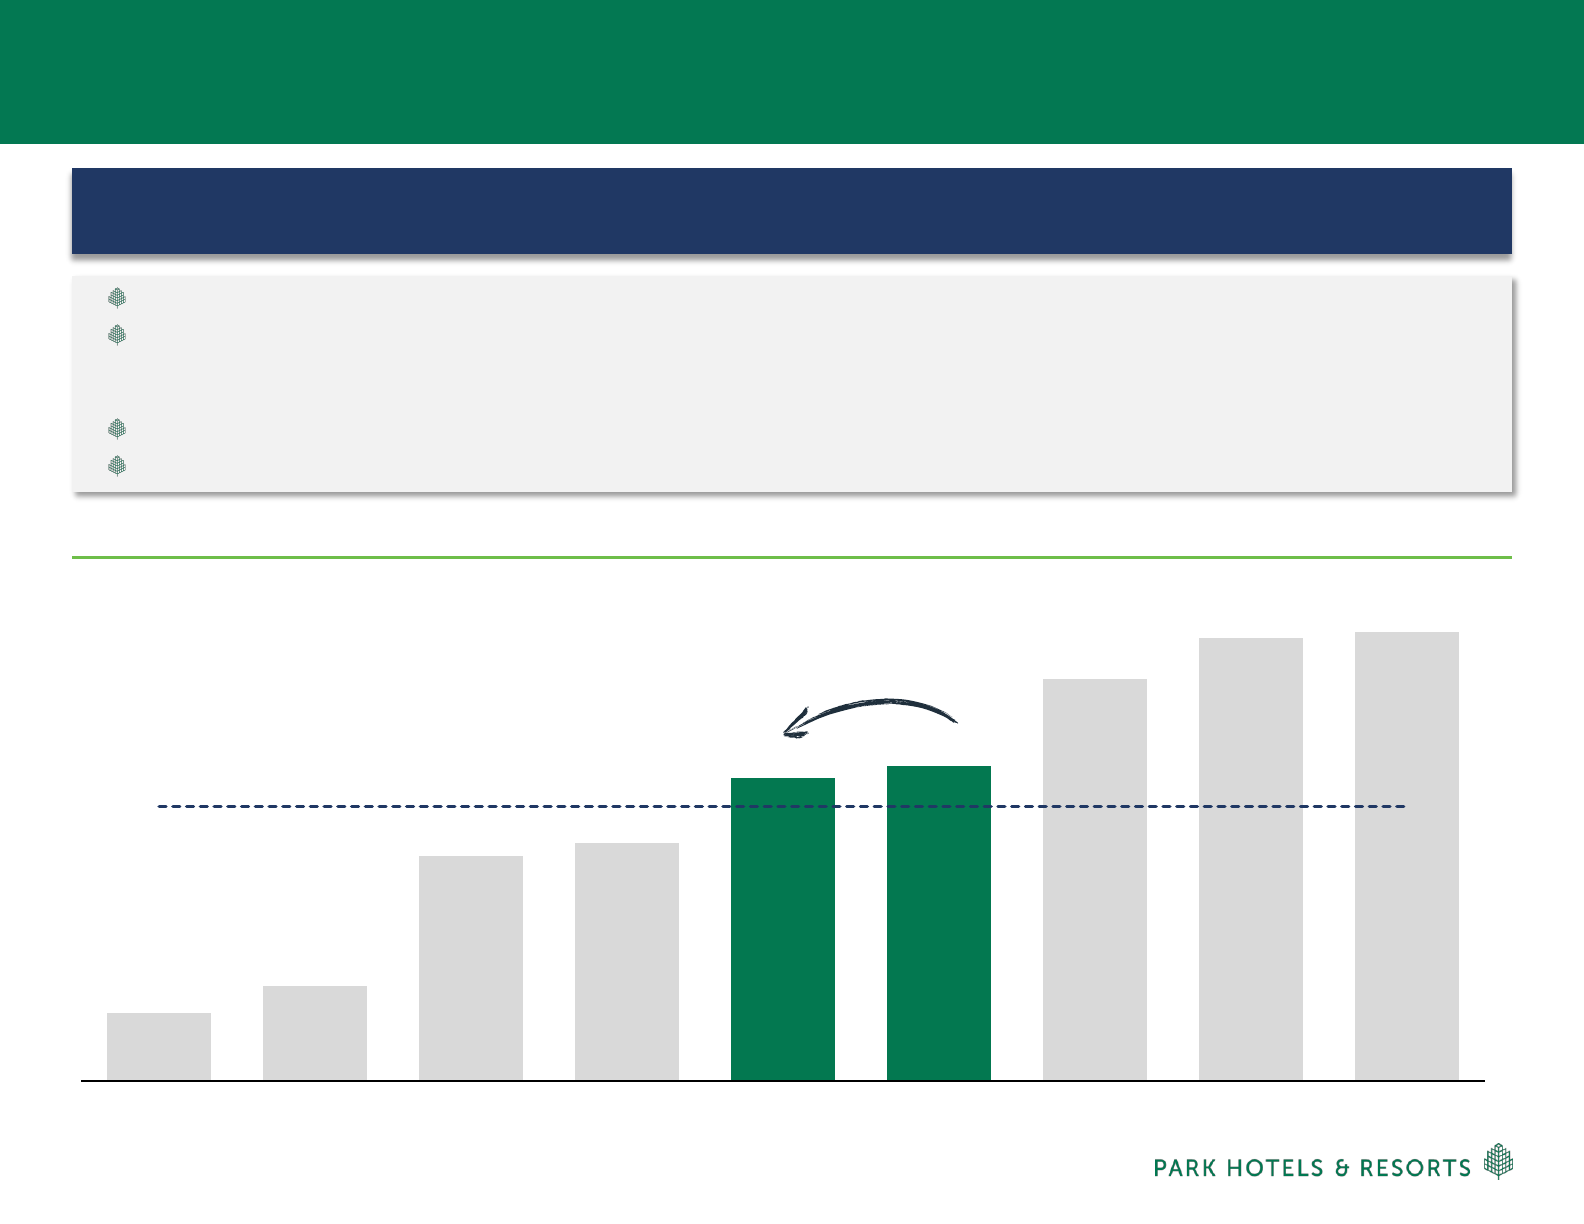
1.0x
1.4x
3.3x
3.5x
4.4x
4.6x
5.9x
6.5x
6.6x
SHO HST XHR DRH Pro Forma PK ⁽²⁾ Pro Forma PK
(At Announcement)
RHP BHR PEB
Peer Average (Excl. PK): 4.0x
Proactive Deleveraging Plan
Park Plans To Reduce Leverage By Selling Up To $500M Of Assets Pre And Post Transaction
Transaction results in modest increase in leverage with Net Debt to Adjusted EBITDA
(1)
increasing to 4.6x from 3.9x as of 1Q19
Phase I (Pre-Closing): Disposition of five identified assets including both of Chesapeake’s NYC hotels (Hyatt Herald Square New York and
Hyatt Place New York Midtown South) in addition to three non-core Park hotels at or prior to closing. Gross proceeds are expected to be
approximately $300M. Post Phase I asset sales, net debt to Adjusted EBITDA falls to 4.4x
Phase II (Post-Closing): Disposition of two additional assets for $170M to $180M to reduce overall leverage to 4.3x
Since spin, Park has preserved a strong and flexible balance sheet within its targeted leverage ratio of 3x to 5x
Pro Forma Park Leverage vs. Peers
(1)
Asset Sales Post
Announcement of
Transaction
23
(1) Benchmarking based on net debt and Adjusted EBITDA for peers as of 12/31/2018 and projected net debt and Adjusted EBITDA of Pro Forma Park as of 3/31/2019
(2) Reflects the following Pro Forma changes – the anticipated sales, prior to the closing of the merger with Chesapeake, of the two Chesapeake New York properties (the
122-room Hyatt Herald Square New York and the 185-room Hyatt Place New York Midtown South) and three non-core PK legacy hotels that are currently under contract
20 |
Pro Forma Capitalization
(1) As of 3/31/2019 and held constant for all periods; includes unvested share-based compensation on a diluted basis
(2) Reflects the anticipated sales, prior to closing of the two Chesapeake New York properties and three non-core PK legacy hotels that are currently under contract
(3) Excludes Park's unamortized deferred financing costs, debt discounts, and capitalized lease obligations
(4) Adjusted EBITDA reflects midpoint of PK 2019 full year guidance provided on May 6, 2019 and the midpoint of Chesapeake’s 2019 full year guidance provided on February
21, 2019. 2019 guidance is based on a number of factors, many of which are outside Park’s and Chesapeake’s control and all of which is subject to change and do not
reflect, among other things, the impacts of the proposed transaction
22
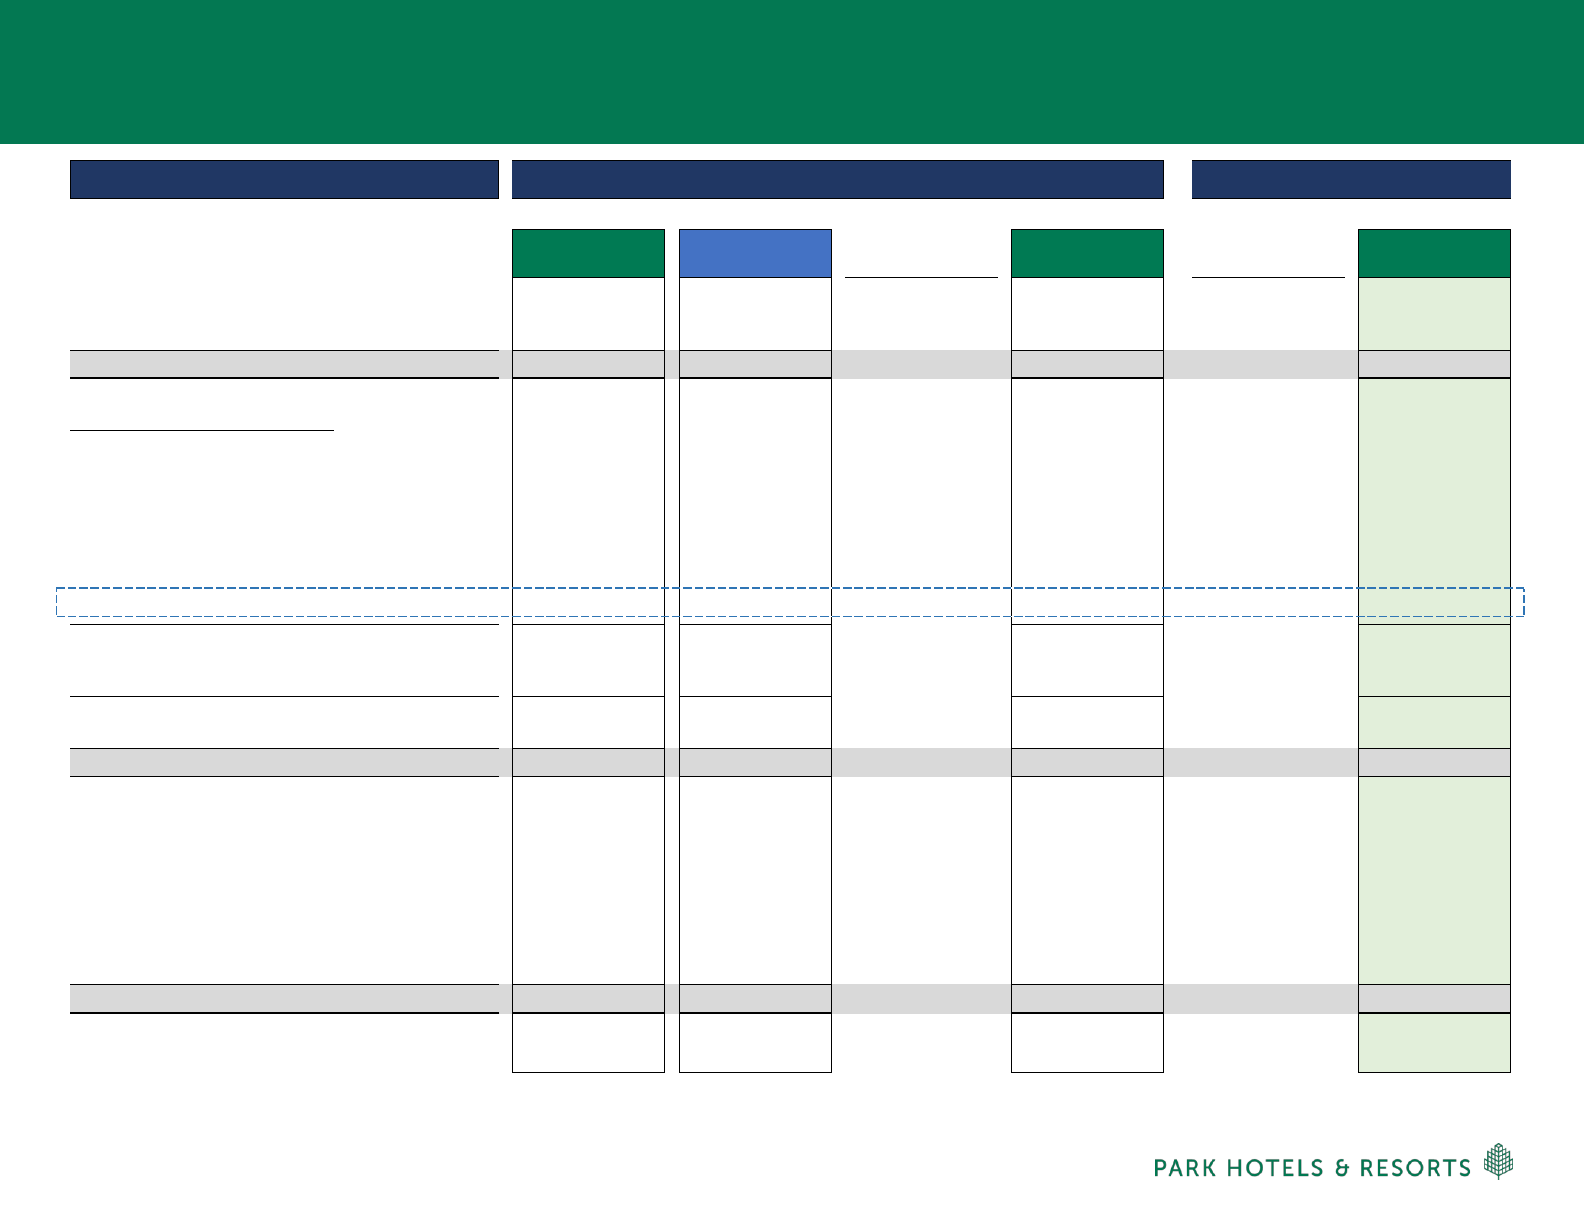
$ in millions (except per share) amounts
Transaction Phase I
Adjustments
Asset Sales
(2)
Stock Price (as of 05/03/2019) 32.98$ 29.31$ 32.98$ 32.98$
Shares Outstanding (at end of period)
(1)
202.0 60.8 38.2 240.2 240.2
Equity Market Capitalization 6,662$ 1,781$ 7,920$ 7,920$
Debt
(1)(3)
Secured Debt - Wholly Owned 2,000$ 529$ (129) 2,400$ (86) 2,314$
Secured Debt - Consolidated Joint Venture 207 - - 207 - 207
Unsecured Term Loans (Existing) 750 225 (225) 750 - 750
Revolving Credit Facility - - - - - -
Pro Rata Share Of Unconsolidated Joint Ventures
234 - - 234 - 234
New Term Loan Issuances - - 990 990 (214) 776
Total Debt 3,191$ 754$ 4,581$ 4,281$
Less: Cash & Cash Equivalents
(1)
(276) (46) 152 (170) - (170)
Net Debt 2,915$ 708$ 4,412$ 4,112$
Total Enterprise Value (TEV) 9,577$ 2,489$ 12,332$ 12,032$
Net Debt / TEV 30.4% 28.4% 35.8% 34.2%
2019E Adjusted EBITDA
(4)
765$ 178$ 943$ - 943$
Plus: G&A Synergies - - 17 17 - 17
Less: EBITDA From Asset Dispositions
- - - (30) (30)
Less: Incremental Fixed Costs - - (5) (5) - (5)
Pro Forma 2019E Adjusted EBITDA 765$ 178$ 955$ 925$
Net Debt / Pro Forma 2019E Adjusted EBITDA 3.8x 4.0x 4.6x 4.4x
PK Capitalization
PK
CHSP
PF PK
PF PK
Excludes Potential Asset Dispositions
Includes Phase I Asset Dispositions

21 |
Transaction Sources & Uses: Assumes Phase I Asset Sales
34
Note: Debt figures as of 3/31/2019
U.S. $ in millions
SOURCES AND USES
Sources
$ %
Stock Issued to Target Shareholders $1,215 44%
Assumed Mortgage Debt 314 11%
Cash from Target's Balance Sheet 125 5%
Cash from Acquirer's Balance Sheet 27 1%
Cash from Phase I Asset Sales (Net of Selling Costs) 300 11%
New Debt 776 28%
Total Sources
$2,758
Uses
$ %
Target Stock Consideration $1,215 44%
Target Cash Consideration 668 24%
CHSP Repaid Term Loan 225 8%
CHSP Repaid Mortgage Debt 129 5%
Repaid Mortgage Debt (Associated with Phase I Asset Sales) 86 3%
Assumed Mortgage Debt 314 11%
Transaction Costs 120 4%
Total Uses
$2,758
22 |
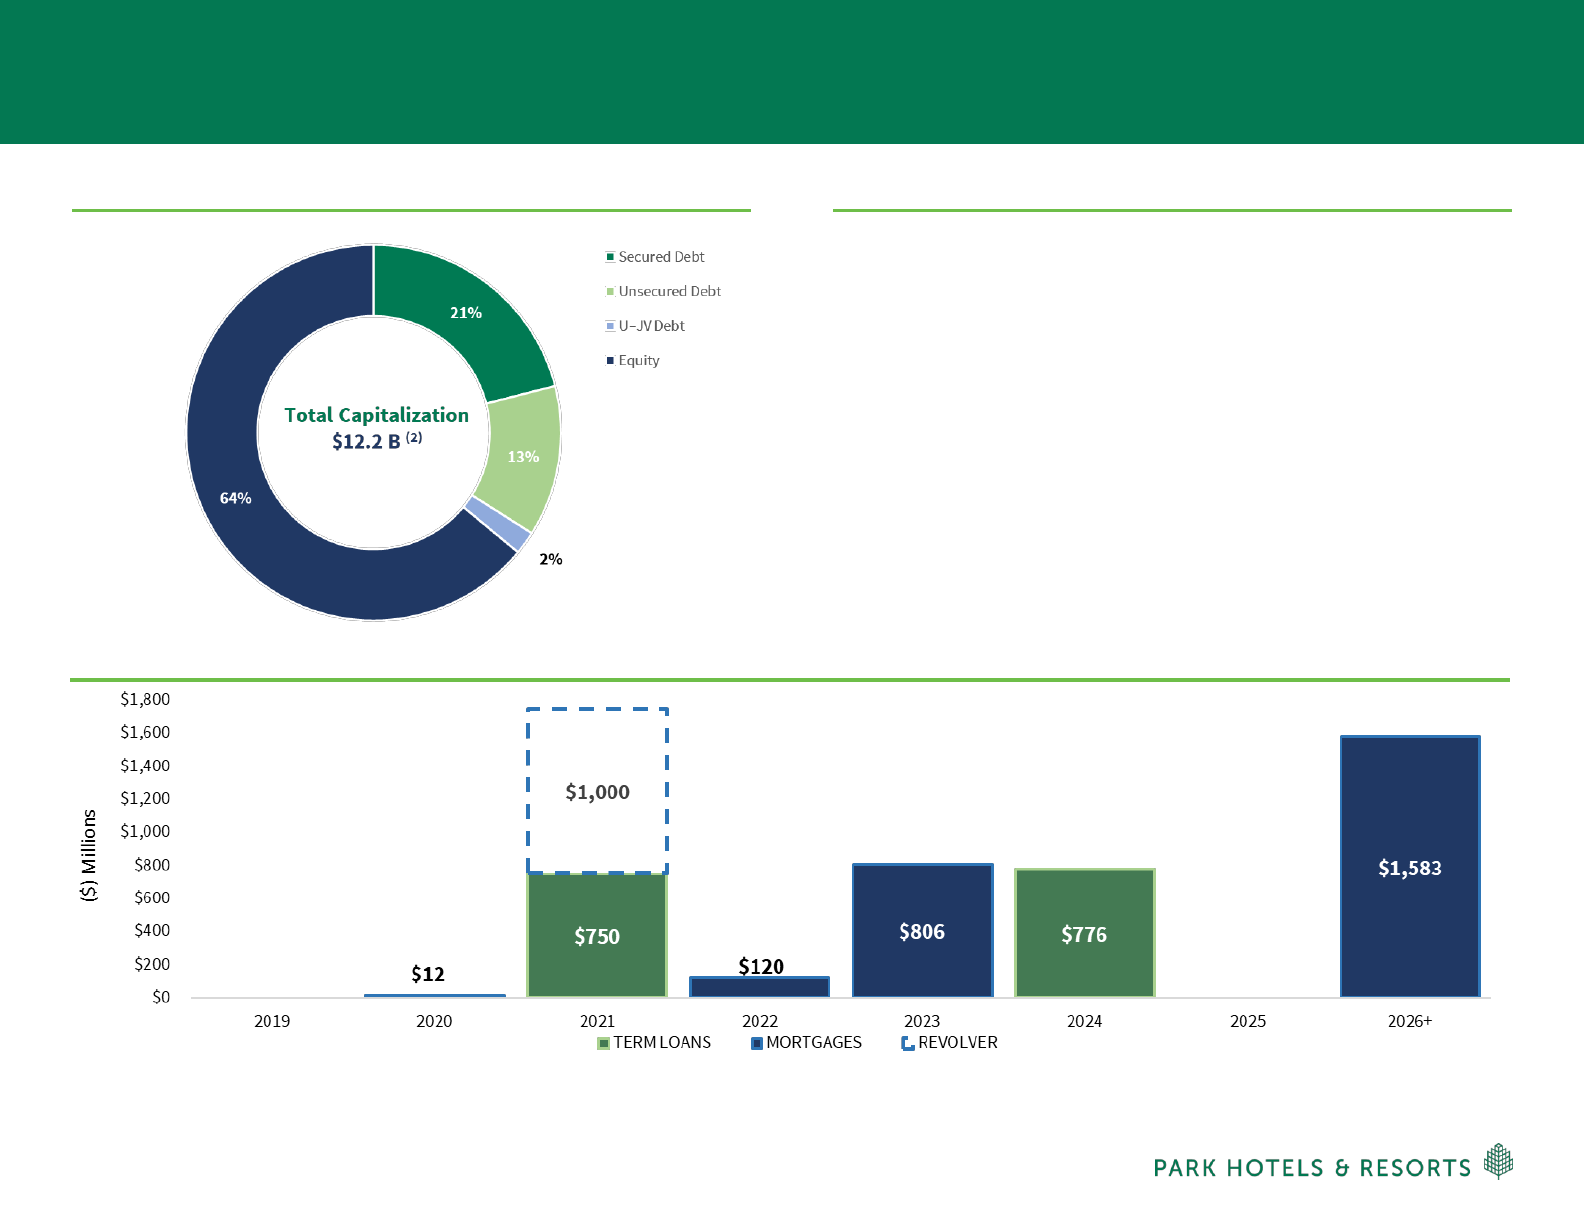
Pro Forma Balance Sheet & Credit Metrics
Pro Forma Capital Structure
(1)(2)
Post Transaction Position Highlights
Pro Forma Debt Maturity Schedule
(5)
(1) Reflects actual debt balances for 3/31/19 after approx. $440 million of existing CHSP debt paydowns
(2) Equity capitalization based on market pricing of equity as of 5/3/19 and Pro Forma debt balances as of 3/31/2019; includes $170 million of cash
(3) Adjusted EBITDA reflects midpoint of PK 2019 full year guidance provided on May 6, 2019 and the midpoint of Chesapeake’s 2019 full year guidance provided on February 21, 2019. 2019 guidance is based on a number of factors, many of
which are outside Park’s and Chesapeake’s control and all of which are subject to change and do not reflect, among other things, the impacts of the proposed transaction
(4) Includes PK 2023 Convertible Notes, Capital Leases, and PK pro-rata share of unconsolidated joint venture debt
(5) Excludes pro-rata share of unconsolidated joint venture debt
(6) Reflects prepayment of Hilton Denver City Center mortgage on the “At Par” date of 2/1/2022 stated in the loan agreement, which is before the stated maturity in 8/1/2042
▪ 50 unencumbered hotels, or 62% of Adjusted EBITDA
(3)
▪ Despite increase in leverage, Pro Forma WACD remains
constant at 4.1% to PK standalone
▪ Undrawn $1 billion revolving credit facility
▪ 59% Fixed Debt vs. 41% Floating Debt
(4)
▪ 36% Unsecured Debt vs. 64% Secured Debt
(4)
(6)

23 |
Appendix: Non-GAAP Financial Measures Reconciliations
PK: Parc 55 San Francisco – A Hilton Hotel CHSP: JW Marriott San Francisco Union Square
31

24 |
Non-GAAP Financial Measures Reconciliations
EBITDA and Adjusted EBITDA
Guidance (continued) EBITDA and Adjusted EBITDA Year Ending (unaudited, in millions) December 31, 2019 Low Case High Case Net income $ 294 $ 323 Depreciation and amortization expense 278 278 Interest income (8) (8) Interest expense 130 130 Income tax expense 13 14 Interest expense, income tax and depreciation and amortization included in equity in earnings from investments in affiliates 23 23 EBITDA 727 757 Share-based compensation expense 15 15 Adjusted EBITDA $ 745 $ 775
(1)
Included in other (loss) gain, net in the consolidated statement of operations.
(2)
For 2017, includes $18 million of distributions received from investments in affiliates in excess of the investment balance that
were included within equity in earnings from investments in affiliates in the consolidated statement of operations.
(unaudited, in millions)
2018 2017
Net income 477$ 2,631$
Depreciation and amortization expense 277 288
Interest income (6) (2)
Interest expense 127 124
Income tax expense (benefit) 23 (2,346)
Interest expense, income tax and depreciation and
amortization included in equity in earnings
from investments in affiliates
26 24
EBITDA 924 719
Loss (gain) on sales of assets, net (96) (1)
Gain on sale of investments in affiliates
(1)
(107) —
(Gain) loss on foreign currency transactions 3 4
Transition expense 3 9
Transaction expense 2 2
Severance expense 2 1
Share-based compensation expense 16 14
Casualty loss (gain) and impairment loss, net (1) 26
Other items
(2)
8 (17)
Adjusted EBITDA 754$ 757$
Year Ended
December 31,

25 |
Non-GAAP Financial Measures Reconciliations
Comparable Hotel Adjusted EBITDA and Comparable Hotel Adjusted EBITDA Margin
(unaudited, dollars in millions)
2018 2017
Adjusted EBITDA 754$ 757$
Less: Adjusted EBITDA from investments in affiliates 45 45
Less: All other
(1)
(52) (46)
Hotel Adjusted EBITDA 761 758
Less: Adjusted EBITDA from hotels disposed of 1 33
Less: Adjusted EBITDA from non-comparable hotels 44 44
Comparable Hotel Adjusted EBITDA 716$ 681$
2018 2017
Total Revenues 2,737$ 2,791$
Less: Other revenue 72 64
Less: Revenues from hotels disposed of 17 131
Less: Revenues from non-comparable hotels
(1)
161 184
Comparable Hotel Revenues 2,487$ 2,412$
(1)
Includes revenues from Park's non-comparable hotels and rental revenues from office space and antenna rent leases located at our hotels.
2018 2017 Change
(1)
Comparable Hotel Revenues 2,487$ 2,412$ 3.1%
Comparable Hotel Adjusted EBITDA 716$ 681$ 5.2%
Comparable Hotel Adjusted EBITDA margin 28.8% 28.2% 60 bps
December 31,
Year Ended
Year Ended
December 31,
Year Ended
December 31,
(1)
Includes other revenues and other expenses, non-income taxes on REIT leases included in other property-level expenses and corporate general and
administrative expenses

26 |
Non-GAAP Financial Measures Reconciliations
EBITDA and Adjusted EBITDA
(unaudited, in millions)
2019 2018
Net income 97$ 149$
Depreciation and amortization expense 62 70
Interest income (1) (1)
Interest expense 32 31
Income tax expense 7 —
Interest expense, income tax and depreciation and
amortization included in equity in earnings
from investments in affiliates
5 7
EBITDA 202 256
Gain on sales of assets, net (31) (89)
Gain on foreign currency transactions — (1)
Transition expense — 2
Severance expense 1 —
Share-based compensation expense 4 4
Other items — 2
Adjusted EBITDA 176$ 174$
Three Months Ended
March 31,

27 |
Non-GAAP Financial Measures Reconciliations
Comparable Hotel Adjusted EBITDA and Comparable Hotel Adjusted EBITDA Margin
(unaudited, dollars in millions)
2019 2018
Adjusted EBITDA 176$ 174$
Less: Adjusted EBITDA from investments in affiliates 10 12
Less: All other
(1)
(15) (12)
Hotel Adjusted EBITDA 181 174
Less: Adjusted EBITDA from hotels disposed of 1 8
Less: Adjusted EBITDA from non-comparable hotels (1) —
Comparable Hotel Adjusted EBITDA 181$ 166$
administrative expenses in the consolidated statement of operations.
2019 2018
Total Revenues 659$ 668$
Less: Other revenue 18 17
Less: Revenues from hotels disposed of 6 47
Less: Revenues from non-comparable hotels
(1)
3 3
Comparable Hotel Revenues 632$ 601$
2019 2018 Change
(1)
Comparable Hotel Revenues 632$ 601$ 5.2%
Comparable Hotel Adjusted EBITDA 181$ 166$ 9.0%
Comparable Hotel Adjusted EBITDA margin 28.7% 27.7% 100 bps
(1)
Percentages are calculated based on unrounded numbers.
Three Months Ended
March 31,
Three Months Ended
March 31,
Three Months Ended
March 31,
(1)
Includes other revenues and other expenses, non-income taxes on REIT leases included in other property-level expenses and corporate general and
(1)
Includes revenues from Park's non-comparable hotels and rental revenues from office space and antenna rent leases located at our hotels.

28 |
Non-GAAP Financial Measures Reconciliations
Net Debt and Net Debt to Pro-forma Adjusted EBITDA Ratio
(1)
See Slide 29 for Pro-forma Adjusted EBITDA at March 31, 2019. Pro-forma Adjusted EBITDA excludes results from the 13 hotels
disposed of in 2018, 1 hotel returned to the ground lessor in 2018 and 2 hotels disposed of in 2019.
(unaudited, in millions)
Debt 2,949$
Add: unamortized deferred financing costs 9
Long-term debt, including current maturities and excluding
unamortized deferred financing costs
2,958
Add: Park's share of unconsolidated affiliates debt,
excluding unamortized deferred financing costs
234
Less: cash and cash equivalents 276
Less: restricted cash 14
Net debt 2,902$
Pro-forma Adjusted EBITDA
(1)
739$
Net debt to Pro-forma Adjusted EBITDA ratio 3.9x
March 31, 2019

29 |
Non-GAAP Financial Measures Reconciliations
Pro-forma TTM Adjusted EBITDA
Year Ended
TTM
(1)
(unaudited, in millions)
December 31, March 31,
2018 2019 2018 2019
Net income 477$ 97$ 149$ 425$
Depreciation and amortization expense 277 62 70 269
Interest income (6) (1) (1) (6)
Interest expense 127 32 31 128
Income tax expense 23 7 — 30
Interest expense, income tax and depreciation and amortization
included in equity in earnings from investments in affiliates
26 5 7 24
EBITDA 924 202 256 870
Gain on sales of assets, net (96) (31) (89) (38)
Gain on sale of investments in affiliates
(2)
(107) — — (107)
Loss (gain) on foreign currency transactions 3 — (1) 4
Transition expense 3 — 2 1
Transaction expense 2 — — 2
Severance expense 2 1 — 3
Share-based compensation expense 16 4 4 16
Casualty (gain) loss and impairment loss, net (1) — — (1)
Other items 8 — 2 6
Adjusted EBITDA 754 176 174 756
Less: Adjusted EBITDA from hotels disposed of 23 1 8 16
Less: Adjusted EBITDA from investments in affiliates disposed of 2 — 1 1
Pro-forma Adjusted EBITDA
729$ 175$ 165$ 739$
Three Months Ended
March 31,
(1) TTM March 31, 2019 is calculatd as year ended December 31, 2018 plus the three months ended March 31, 2019 less the three months ended March 31, 2018.
(2) Included in other (loss) gain, net in the consolidated statement of operations.

30 |
Non-GAAP Financial Measures Reconciliations
Comparable Hotel Adjusted EBITDA
The financial information below is for the 42 comparable hotels owned as of March 31, 2019.
(1) Included in other (loss) gain, net in the consolidated statement of operations.
(2) Includes other revenues and other expenses, non-income taxes on REIT leases included in other property-level expenses and corporate general and administrative
expenses in the consolidated statement of operations.
Full Year
(unaudited, dollars in millions)
December 31,
2018
Net income
477$
Depreciation and amortization expense
277
Interest income
(6)
Interest expense
127
Income tax expense
23
Interest expense, income tax and depreciation and
amortization included in equity in earnings from
investments in affiliates
26
EBITDA
924
(Gain) loss on sales of assets, net
(96)
(Gain) loss on sale of investments in affiliates
(1)
(107)
Loss (gain) on foreign currency transactions
3
Transition expense
3
Transaction expense
2
Severance expense
2
Share-based compensation expense
16
Casualty loss (gain) and impairment loss, net
(1)
Other items
8
Adjusted EBITDA
754$
Less: Adjusted EBITDA from investments in affiliates
45
Less: All other
(2)
(52)
Hotel Adjusted EBITDA
761
Less: Adjusted EBITDA from hotels disposed of
23
Less: Adjusted EBITDA from non-comparable hotels
11
Comparable Hotel Adjusted EBITDA
727$

31 |
Non-GAAP Financial Measures Reconciliations
Comparable Hotel Metrics
The financial information below is for the 42 comparable hotels owned as of March 31, 2019.
(1)
Includes revenues from Park’s non-comparable hotels and rental revenues from office space and antenna rent leases located at our hotels.
Full Year
(unaudited, dollars in millions)
December 31,
2018
Total Revenues
2,737$
Less: Other revenue
72
Less: Revenues from hotels disposed of
135
Less: Revenues from non-comparable hotels
(1)
32
Comparable Hotel Revenues
2,498$
Comparable Hotel Adjusted EBITDA Margin
29.1%

32 |
Non-GAAP Financial Measures Reconciliations
Hotel Adjusted EBITDA Including Unconsolidated Joint Ventures
Full Year
(unaudited, dollars in millions)
December 31,
2018
Net income
477$
Depreciation and amortization expense
277
Interest income
(6)
Interest expense
127
Income tax expense
23
Interest expense, income tax and depreciation and
amortization included in equity in earnings from
investments in affiliates
26
EBITDA
924
(Gain) loss on sales of assets, net
(96)
(Gain) loss on sale of investments in affiliates
(1)
(107)
Loss (gain) on foreign currency transactions
3
Transition expense
3
Transaction expense
2
Severance expense
2
Share-based compensation expense
16
Casualty loss (gain) and impairment loss, net
(1)
Other items
8
Adjusted EBITDA
754$
Less: All other
(2)
(52)
Less: Adjusted EBITDA from hotels disposed of (including UJV)
27
Hotel Adjusted EBITDA (including UJV)
779$
(1) Included in other (loss) gain, net in the consolidated statement of operations.
(2) Includes other revenues and other expenses, non-income taxes on REIT leases included in other property-level expenses and corporate general and administrative
expenses in the consolidated statement of operations.

33 |
Guidance
EBITDA and Adjusted EBITDA
(unaudited, in millions)
Low Case High Case
Net income 358$ 386$
Depreciation and amortization expense 245 245
Interest income (8) (8)
Interest expense 128 129
Income tax expense 15 16
Interest expense, income tax and depreciation and amortization included in equity
in earnings from investments in affiliates
22 22
EBITDA 760 790
Gain on sale of assets, net (31) (31)
Severance expense 3 3
Share-based compensation expense 15 15
Other items 3 3
Adjusted EBITDA 750$ 780$
Year Ending
December 31, 2019
Park’s full-year 2019 guidance is based on a number of factors, many of which are outside Park’s control and all of which are subject to change. This guidance does not reflect the impacts
of the proposed merger transaction with Chesapeake. Park may change the guidance provided during the year as actual and anticipated results vary from these assumptions. Park
undertakes no obligation to update or revise publicly any guidance. Please see the forward-looking statements disclaimer on slide 36 of this presentation for a discussion of the risks that
could cause actual results to differ materially from any potential or estimated results.

34 |
Definitions
EBITDA, Adjusted EBITDA, Hotel Adjusted EBITDA and Hotel Adjusted EBITDA Margin
Earnings before interest expense, taxes and depreciation and amortization (“EBITDA”), presented herein, reflects net income excluding depreciation and amortization,
interest income, interest expense, income taxes and interest expense, income tax and depreciation and amortization included in equity in earnings from investments in
affiliates.
Adjusted EBITDA, presented herein, is calculated as EBITDA, as previously defined, further adjusted to exclude:
• Gains or losses on sales of assets for both consolidated and unconsolidated investments;
• Gains or losses on foreign currency transactions;
• Transition expense related to the Company’s establishment as an independent, publicly traded company;
• Transaction costs associated with hotel acquisitions or dispositions expensed during the period;
• Severance expense;
• Share-based compensation expense;
• Casualty and impairment losses; and
• Other items that management believes are not representative of the Company’s current or future operating performance.
Hotel Adjusted EBITDA measures hotel-level results before debt service, depreciation and corporate expenses of the Company’s consolidated hotels, including both
comparable and non-comparable hotels but excluding hotels owned by unconsolidated affiliates, and is a key measure of the Company’s profitability. The Company
presents Hotel Adjusted EBITDA to help the Company and its investors evaluate the ongoing operating performance of the Company’s consolidated hotels.
Hotel Adjusted EBITDA margin is calculated as Hotel Adjusted EBITDA divided by total hotel revenue.
EBITDA, Adjusted EBITDA, Hotel Adjusted EBITDA and Hotel Adjusted EBITDA margin are not recognized terms under United States (“U.S.”) GAAP and should not
be considered as alternatives to net income (loss) or other measures of financial performance or liquidity derived in accordance with U.S. GAAP. In addition, the
Company’s definitions of EBITDA, Adjusted EBITDA, Hotel Adjusted EBITDA and Hotel Adjusted EBITDA margin may not be comparable to similarly titled measures
of other companies.
The Company believes that EBITDA, Adjusted EBITDA, Hotel Adjusted EBITDA and Hotel Adjusted EBITDA margin provide useful information to investors about the
Company and its financial condition and results of operations for the following reasons: (i) EBITDA, Adjusted EBITDA, Hotel Adjusted EBITDA and Hotel Adjusted
EBITDA margin are among the measures used by the Company’s management team to make day-to-day operating decisions and to evaluate its operating
performance between periods and between REITs by removing the effect of its capital structure (primarily interest expense) and asset base (primarily depreciation and
amortization) from its operating results; and (ii) EBITDA, Adjusted EBITDA, Hotel Adjusted EBITDA and Hotel Adjusted EBITDA margin are frequently used by
securities analysts, investors and other interested parties as a common performance measure to compare results or estimate valuations across companies in the
industry.
EBITDA, Adjusted EBITDA, Hotel Adjusted EBITDA and Hotel Adjusted EBITDA margin have limitations as analytical tools and should not be considered either in
isolation or as a substitute for net income (loss) or other methods of analyzing results as reported under U.S. GAAP.

35 |
Definitions (cont’d)
Net Debt
Net debt, presented herein, is a non-GAAP financial measure that the Company uses to evaluate its financial leverage. Net debt is calculated as (i) long-term debt, including current maturities and
excluding unamortized deferred financing costs; and (ii) the Company’s share of investments in affiliate debt, excluding unamortized deferred financing costs; reduced by (a) cash and cash equivalents;
and (b) restricted cash and cash equivalents.
The Company believes Net debt provides useful information about its indebtedness to investors as it is frequently used by securities analysts, investors and other interested parties to compare the
indebtedness of companies. Net debt should not be considered as a substitute to debt presented in accordance with U.S. GAAP. Net debt may not be comparable to a similarly titled measure of other
companies.
Net Debt to Pro-forma Adjusted EBITDA Ratio
Net debt to Pro-forma Adjusted EBITDA ratio, presented herein, is a non-GAAP financial measure and is included as it is frequently used by securities analysts, investors and other interested parties to
compare the financial condition of companies. Net debt to Pro-forma Adjusted EBITDA ratio should not be considered as an alternative to measures of financial condition derived in accordance with
U.S. GAAP and it may not be comparable to a similarly titled measure of other companies.
Comparable Hotels
The following disclosure is applicable only to the non-GAAP financial measures reconciliations on slides 24-33 of this presentation: The Company presents certain data for its consolidated hotels on a
comparable hotel basis as supplemental information for investors. The Company defines its comparable hotels as those hotels that: (i) were active and operating in the Company’s portfolio since
January 1st of the previous year; and (ii) have not sustained substantial property damage, business interruption, undergone large-scale capital projects or for which comparable results are not
available. The Company presents comparable hotel results to help the Company and its investors evaluate the ongoing operating performance of its comparable hotels. Of the 43 hotels that the
Company consolidated as of March 31, 2019, 42 have been classified as comparable hotels. Due to the continued effects of business interruption from Hurricane Maria at the Caribe Hilton in Puerto
Rico, the results from that property were excluded from the Company’s comparable hotels. The Company’s comparable hotels as of March 31, 2019 also exclude one hotel returned to the lessor after
the expiration of the ground lease in December 2018 and two consolidated hotels that were sold in February and March 2019. Of the 46 hotels that the Company consolidated as of December 31,
2018, 44 hotels were classified as comparable hotels. Due to the conversion of a significant number of rooms at the Hilton Waikoloa Village to HGV timeshare units in 2017, and due to the effects of
business interruption from Hurricane Maria at the Caribe Hilton in Puerto Rico, the results from these properties were excluded from the Company’s comparable hotels. The Company’s comparable
hotels as of December 31, 2018 also exclude the 12 consolidated hotels that were sold in January and February 2018.
Pro-forma
The following disclosure is applicable only to the non-GAAP financial measures reconciliations on slides 24-33 of this presentation: Certain financial measures and other information have been adjusted
to reflect the effects of hotels disposed of during the periods presented. When presenting such information, the amounts are identified as “Pro-forma.”

36 |
About Park and Safe Harbor Disclosure
About Park Hotels & Resorts Inc.
Park (NYSE: PK) is the second largest publicly traded lodging real estate company with a diverse portfolio of market-leading hotels and resorts with significant underlying real estate value. Park’s portfolio
consists of 51 premium-branded hotels and resorts with over 30,000 rooms, primarily located in prime U.S. markets with high barriers to entry. Visit www.pkhotelsandresorts.com for more information.
Forward-Looking Statements
This press release contains forward-looking statements within the meaning of Section 27A of the Securities Act of 1933, as amended, and Section 21E of the Securities Exchange Act of 1934, as
amended. Forward-looking statements include, but are not limited to, statements related to Park’s current expectations regarding the performance of its business, financial results, liquidity and capital
resources, the effects of competition and the effects of future legislation or regulations, the expected completion of anticipated acquisitions and dispositions, the declaration and payment of future
dividends, statements about the benefits of the proposed transaction involving Park and Chesapeake and statements that address operating performance, events or developments that Park expects or
anticipates will occur in the future, including but not limited to statements regarding anticipated synergies and G&A savings, future financial and operating results, plans, objectives, expectations and
intentions, expected sources of financing, anticipated asset dispositions, anticipated leadership and governance, creation of value for stockholders, benefits of the proposed transaction to customers,
employees, stockholders and other constituents of the combined company, the integration of Park and Chesapeake, cost savings and the expected timetable for completing the proposed transaction,
and other non-historical statements. Forward-looking statements include all statements that are not historical facts, and in some cases, can be identified by the use of forward-looking terminology such
as the words “outlook,” “believes,” “expects,” “potential,” “continues,” “may,” “will,” “should,” “could,” “seeks,” “projects,” “predicts,” “intends,” “plans,” “estimates,” “anticipates” or the negative version of
these words or other comparable words.
Forward-looking statements involve risks, uncertainties and assumptions. Actual results may differ materially from those expressed in these forward-looking statements for various reasons, including risks
associated with Park’s ability to consummate the proposed transaction and the timing of the closing of the proposed transaction; the ability to satisfy conditions necessary to close the proposed
transaction; applicable regulatory changes; the availability of financing; risks associated with acquisitions generally, including the integration of the combined companies’ businesses; risks associated with
execution of anticipated asset dispositions; risks associated with achieving expected revenue synergies or cost savings; as well as other risks and uncertainties detailed from time to time in Park’s filings
with the SEC. You should not put undue reliance on any forward-looking statements and Park urges investors to carefully review the disclosures Park makes concerning risk and uncertainties in Item 1A:
“Risk Factors” in Park’s Annual Report on Form 10-K for the year ended December 31, 2018, as such factors may be updated from time to time in Park’s periodic filings with the SEC, which are
accessible on the SEC’s website at www.sec.gov. Except as required by law, Park undertakes no obligation to update or revise publicly any forward-looking statements, whether as a result of new
information, future events or otherwise.
Additional Information about the Proposed Transaction and Where to Find It
In connection with the proposed transaction, Park intends to file with the SEC a registration statement on Form S-4 that will include a proxy statement of Chesapeake and also constitutes a prospectus of
Park. Park and Chesapeake also plan to file other relevant documents with the SEC regarding the proposed transaction. INVESTORS AND SECURITY HOLDERS ARE URGED TO READ THE PROXY
STATEMENT/PROSPECTUS AND OTHER RELEVANT DOCUMENTS FILED WITH THE SEC, WHEN THEY BECOME AVAILABLE, BECAUSE THEY WILL CONTAIN IMPORTANT INFORMATION
ABOUT THE PROPOSED TRANSACTION. A definitive proxy statement/prospectus will be sent to Chesapeake’s shareholders. Investors may obtain a free copy of the proxy statement/prospectus (if and
when it becomes available) and other relevant documents filed by Park and Chesapeake with the SEC at the SEC’s website at www.sec.gov. Copies of the documents filed by Park with the SEC will be
available free of charge on Park’s website at http://www.pkhotelsandresorts.com or by contacting Park’s Investor Relations at (571) 302-5591. Copies of the documents filed by Chesapeake with the SEC
will be available free of charge on Chesapeake’s website at http://www.chesapeakelodgingtrust.com or by contacting Chesapeake’s Investor Relations at (571) 349-9452.
Chesapeake and its trustees and executive officers and other members of management and employees may be deemed to be participants in the solicitation of proxies in respect of the proposed
transaction. Information about trustees and executive officers of Chesapeake is available in the proxy statement for its 2019 Annual Meeting, which was filed with the SEC on April 30, 2019. Other
information regarding the participants in the proxy solicitation and a description of their direct and indirect interests, by security holdings or otherwise, will be contained in the proxy statement/prospectus
and other relevant materials filed with the SEC regarding the proposed transaction when they become available. Investors should read the proxy statement/prospectus carefully before making any voting
or investment decisions when it becomes available before making any voting or investment decisions. Investors may obtain free copies of these documents from Park or Chesapeake using the sources
indicated above.
This communication and the information contained herein shall not constitute an offer to sell or the solicitation of an offer to buy any securities, nor shall there be any sale of securities in any jurisdiction in
which such offer, solicitation or sale would be unlawful prior to registration or qualification under the securities laws of any such jurisdiction. No offering of securities shall be made except by means of a
prospectus meeting the requirements of Section 10 of the Securities Act of 1933, as amended.
