Electricity Market
Report 2023

The IEA examines the full spectrum of energy
issues including oil, gas and coal supply and
demand, renewable energy technologies,
electricity markets, energy efficiency, access to
energy, demand side management and much
more. Through its work, the IEA advocates
policies that will enhance the reliability,
affordability and sustainability of energy in its 31
member countries, 11 association countries and
beyond.
This publication and any map included herein are
without prejudice to the status of or sovereignty
over any territory, to the delimitation of
international frontiers and boundaries and to the
name of any territory, city or area.
Source: IEA.
International Energy Agency
Website: www.iea.org
IEA member countries:
Australia
Austria
Belgium
Canada
Czech Republic
Denmark
Estonia
Finland
France
Germany
Greece
Hungary
Ireland
Italy
Japan
Korea
Lithuania
Luxembourg
Mexico
Netherlands
New Zealand
Norway
Poland
Portugal
Slovak Republic
INTERNATIONAL ENERGY AGENCY
Spain
Sweden
Switzerland
Republic of Türkiye
United Kingdom
United States
The European Commission
also participates in the work
of the IEA
IEA association countries:
Argentina
Brazil
China
Egypt
India
Indonesia
Morocco
Singapore
South Africa
Thailand
Ukraine

Electricity Market Report 2023
P
AGE | 3
Abstract
IEA. CC BY 4.0.
Abstract
Electricity is central to many parts of life in modern societies and will
become even more so as its role in transport and heating expands
through technologies such as electric vehicles and heat pumps.
Power generation is currently the largest source of carbon dioxide
(CO
2
) emissions globally, but it is also the sector that is leading the
transition to net zero emissions through the rapid ramping up of
renewables such as solar and wind. At the same time, the current
global energy crisis has placed electricity security and affordability
high on the political agenda in many countries.
The International Energy Agency’s Electricity Market Report 2023
offers a deep analysis of recent policies, trends and market
developments. It also provides forecasts through 2025 for electricity
demand, supply and CO
2
emissions – with a detailed study of the
evolving generation mix. This year’s report contains a
comprehensive analysis of developments in Europe, which faced a
variety of energy crises in 2022. The Asia Pacific region also
receives special focus, with its fast-growing electricity demand and
accelerating clean energy deployment.
The IEA’s Electricity Market Report has been published since 2020.
Its relevance goes beyond energy and climate issues, since
electricity supply impacts economies, regional development, the
budgets of businesses and households, and many other areas. It is
indispensable reading for anyone interested in the multifaceted
importance of energy in our economies and societies today.

Electricity Market Report 2023
P
AGE | 4
Table of contents
IEA. CC BY 4.0.
Table of contents
Executive summary ......................................................................................... 5
Global overview ............................................................................................. 11
Demand ........................................................................................................ 12
Supply .......................................................................................................... 20
Emissions ..................................................................................................... 31
Wholesale prices .......................................................................................... 34
Carbon pricing trends ................................................................................... 38
Regional perspectives................................................................................... 41
Asia Pacific ................................................................................................... 42
Americas ...................................................................................................... 63
Europe .......................................................................................................... 74
Eurasia ......................................................................................................... 93
Middle East .................................................................................................. 99
Africa .......................................................................................................... 108
General annex .............................................................................................. 118

Electricity Market Report 2023
P
AGE | 5
Executive summary
IEA. CC BY 4.0.
Executive summary

Electricity Market Report 2023
P
AGE | 6
Executive summary
IEA. CC BY 4.0.
Executive Summary
Global electricity demand growth slowed only slightly in 2022 despite energy crisis headwinds
World electricity demand remained resilient in 2022 amid the
global energy crisis triggered by Russia’s invasion of Ukraine.
Demand rose by almost 2% compared with the 2.4% average
growth rate seen over the period 2015-2019. The electrification of
the transport and heating sectors continued to accelerate globally,
with record numbers of electric vehicles and heat pumps sold in
2022 contributing to growth. Nevertheless, economies around the
world, in the midst of recovering from the impacts of Covid-19, were
battered by record-high energy prices. Soaring prices for energy
commodities, including natural gas and coal, sharply escalated
power generation costs and contributed to a rapid rise in inflation.
Economic slowdowns and high electricity prices stifled electricity
demand growth in most regions around the world.
Electricity consumption in the European Union recorded a
sharp 3.5% decline year-on-year (y-o-y) in 2022 as the region was
particularly hard hit by high energy prices, which led to significant
demand destruction among industrial consumers. Exceptionally mild
winter added further downward pressure on electricity consumption.
This was the EU’s second largest percentage decrease in electricity
demand since the global financial crisis in 2009 – with the largest
being the exceptional contraction due to the Covid-19 shock in
2020.
Electricity demand in India and the United States rose, while
Covid restrictions affected China’s growth. China’s zero-Covid
policy weighed heavily on its economic activity in 2022, and a
degree of uncertainty remains over the pace of its electricity
demand growth. We currently estimate it to be 2.6% in 2022,
substantially below its pre-pandemic average of over 5% in the
2015-2019 period. Further data expected in due course will provide
greater clarity on trends in China in 2022, which could also have
implications for the global picture. Electricity demand in India rose
by a strong 8.4% in 2022, due to a combination of its robust post-
pandemic economic recovery and exceptionally high summer
temperatures. The United States recorded a significant 2.6% y-o-y
demand increase in 2022, driven by economic activity and higher
residential use to meet both heating and cooling needs amid hotter
summer weather and a colder-than-normal winter.
Low-emissions sources are set to cover almost all the
growth in global electricity demand by 2025
Renewables and nuclear energy will dominate the growth of
global electricity supply over the next three years, together
meeting on average more than 90% of the additional demand.
China accounts for more than 45% of the growth in renewable

Electricity Market Report 2023
P
AGE | 7
IEA. CC BY 4.0.
Executive summary
generation in the period 2023-2025, followed by the EU with 15%.
The substantial growth of renewables will need to be accompanied
by accelerated investments in grids and flexibility for their
successful integration into the power systems. The increase in
nuclear output results from an expected recovery in French nuclear
generation as more plants complete their scheduled maintenance,
and from new plants starting operations, largely in Asia.
Global electricity generation from both natural gas and coal is
expected to remain broadly flat between 2022 and 2025. While
gas-fired generation in the European Union is forecast to decline,
significant growth in the Middle East will partly offset this decrease.
Similarly, drops in coal-fired generation in Europe and the Americas
will be matched by a rise in Asia Pacific. However, the trends in
fossil-fired generation remain subject to developments in the global
economy, weather events, fuel prices and government policies.
Developments in China, where more than half of the world’s coal-
fired generation occurs, will remain a key factor.
China’s share of global electricity consumption is forecast to
rise to one-third by 2025, compared with one-quarter in 2015.
Over the next three years, more than 70% of the growth in global
electricity demand is set to come from China, India and Southeast
Asia combined. Emerging and developing economies’ growth is
accompanied by a corresponding rise in demand for electricity. At
the same time, advanced economies are pushing for electrification
to decarbonise their transportation, heating and industrial sectors.
As a result, global electricity demand is expected to grow at a much
faster pace of 3% per year over the 2023-2025 period compared
with the 2022 growth rate. The total increase in global electricity
demand of about 2 500 terawatt-hours (TWh) out to 2025 is more
than double Japan's current annual electricity consumption.
Nevertheless, uncertainties exist regarding the growth of electricity
demand in China. While the country recently eased its stringent
Covid restrictions in early December 2022, the full extent of the
economic impacts remain unclear.
After reaching an all-time high in 2022, power
generation emissions are set to plateau through 2025
Global CO
2
emissions from electricity generation grew in 2022
at a rate similar to the 2016-2019 average. Their increase of 1.3%
in 2022 is a significant slowdown from the staggering 6% rise in
2021, which was driven by the rapid economic recovery from the
Covid shock. Nonetheless, electricity generation-related CO
2
emissions reached a record high in 2022.
The share of renewables in the global power generation mix is
forecast to rise from 29% in 2022 to 35% in 2025. As renewables
expand, the shares of coal- and gas-fired generation are set to fall.
As a result, emissions of global power generation will plateau to
2025 and its CO
2
intensity will further decline in the coming years.

Electricity Market Report 2023
P
AGE | 8
IEA. CC BY 4.0.
Executive summary
The European Union saw gas-fired generation increase
during a turbulent 2022
Due to historic drought conditions, hydropower generation in
Europe was particularly low in 2022. Italy saw a drop in
hydropower generation of more than 30% compared with its 2017-
2021 average, followed closely by Spain. Similarly, France recorded
a 20% decline in its hydro output compared with the previous five-
year average.
Nuclear generation in the European Union was 17% lower in
2022 than in 2021 due to closures and unavailabilities. Plant
closures in Germany and Belgium reduced the available nuclear
capacity in 2022. At the same time, France faced record-low nuclear
availability due to ongoing maintenance work and other challenges
in its nuclear fleet. The constrained nuclear output and low
hydropower supply in Europe – combined with reduced
dispatchable capacity due to previous retirements of thermal
generation plants – put additional pressure on remaining
dispatchable capacities to meet demand. As a result, although
variable renewable generation grew and record-high gas prices
supported fuel-switching from gas to coal, gas-fired generation grew
in 2022 by 2% in the European Union.
These factors have also
contributed to significant changes in the traditional import-export
structure of electricity in Europe: France became a net importer and
the United Kingdom a net exporter for the first time in decades.
In order to increase the security of electricity supply, reserve
capacities of conventional power generation have been
brought back in Europe for the 2022-2023 and 2023-2024
winters. Similarly, some plants that were previously set to be
decommissioned were also extended. Germany had the highest
share of such plants in Europe, having delayed the planned
shutdown of its three remaining nuclear reactors, as well as
delaying the closure or reactivating fossil-fired plants that make up
15% of its current fossil-fired generation capacity. An increased risk
of power outages was reported in some European countries during
several weeks of cold weather combined with lower-than-average
hydro and nuclear output. Security of supply was achieved through
successful short-term planning and management.
While the CO
2
intensity of global power generation
decreased in 2022, it increased in the European Union
After 2021, 2022 marks the highest percentage growth in CO
2
emissions of EU power generation since the oil crises of the
1970s, recording a 4.5% year-on-year growth. Excluding the 2021
post-pandemic rebound, the European Union also saw in 2022 the
highest absolute growth in power generation emissions since 2003.
This was mainly due to a rise in coal-fired generation of more than
6% in stark contrast to the almost 8% average annual rate of
decline in coal-fired generation over the pre-pandemic period of
2015-2019.
The setback in the European Union will be temporary, however,
as power generation emissions are expected to decrease on
average by about 10% annually through 2025. Both coal- and gas-

Electricity Market Report 2023
P
AGE | 9
IEA. CC BY 4.0.
Executive summary
fired generation are expected to see sharp falls, with coal declining
by 10% and gas by almost 12% annually on average over the
outlook period as renewables ramp up and nuclear generation
recovers.
Electricity prices remain high in many regions, with risks
of tight supply in Europe next winter
The increase in wholesale electricity prices was most
pronounced in Europe in 2022, where they were, on average,
more than twice as high as in 2021. The exceptionally mild winter so
far in 2022/23 in Europe has helped temper wholesale electricity
prices, but they remain high compared with recent years. Elevated
futures prices for winter 2023/24 reflect the uncertainties regarding
gas supply in Europe over the coming year.
In the European Union, a wide range of responses to the
energy crisis have been observed. In order to reduce reliance on
fossil fuels and to increase resilience to price shocks, the European
Commission published its REPowerEU plan in May 2022 to
accelerate clean energy deployment. At the same time, discussions
about electricity market design gained momentum due to soaring
wholesale prices, and the Commission launched a consultation on
market design reform. To dampen the effects of high electricity
prices on consumers, many countries introduced measures such as
the regulation of wholesale and retail prices; revenue caps on infra-
marginal technologies such as renewables, nuclear and coal-
plants; reductions of energy taxes and VAT; and direct subsidies.
While such market interventions can help mitigate the impacts of the
energy crisis, the potential creation of uncertainty in the investment
landscape needs to be minimised to ensure that responses to the
crisis do not come at the expense of much-needed investment.
Affordability will continue to be a challenge for emerging
and developing economies
Globally, higher electricity generation costs in 2022 were
driven by surging energy commodity prices. While the cost
increases were more moderate in countries with regulated tariffs
and long-term fuel supply agreements (oil-indexed LNG, long-term
contracts or fuel supply contracts), regions dependent on short-term
markets for fuel procurement were severely affected. In particular,
record-high LNG prices led to difficulties for South Asian countries
trying to procure gas for the power sector, which contributed to
blackouts and rationing of electricity in the region. If prices of energy
commodities remain elevated, fuel procurement will continue to be a
serious issue for emerging and developing economies.
Nuclear power is gathering pace in Asia, curbing the
CO
2
intensity of power generation
The energy crisis has renewed interest in the role of nuclear
power in contributing to energy security and reducing the CO
2
intensity of power generation. In Europe and the United States,
discussions on the future role of nuclear in the energy mix have
resurfaced. At the same time, other parts of the world are already

Electricity Market Report 2023
P
AGE | 10
IEA. CC BY 4.0.
Executive summary
seeing an accelerated deployment of nuclear plants. As a result,
global nuclear power generation is set to grow on average by
almost 4% over 2023-2025, a significantly higher growth rate than
the 2% over 2015-2019. This means that in every year to 2025,
about 100 TWh of additional electricity is set to be produced by
nuclear power, the equivalent of about one-eighth of US nuclear
power generation today.
More than half of the growth in global nuclear generation to
2025 comes from just four countries: China, India, Japan and
Korea. Among these countries, while China leads in terms of
absolute growth from 2022 to 2025 (+58 TWh), India is set to have
the highest percentage growth (+81%), followed by Japan. This
results from the Japanese government’s push to ramp up nuclear
generation in order to reduce reliance on gas imports and
strengthen energy security. Outside Asia, the French nuclear fleet
provides more than one-third of the absolute growth in global
nuclear generation to 2025 as it gradually recovers.
Extreme weather events highlight the need for
increased security of supply and resilience
In a world where both the demand and supply of electricity are
becoming increasingly weather-dependent, electricity security
requires increased attention. Along with the high cost of electricity
generation, the world’s power systems also faced challenges from
extreme weather events in 2022. In addition to the drought in
Europe, there were heatwaves in India, where the hottest March in
over a century was recorded, resulting in the country’s highest ever
peak in power demand. Similarly, central and eastern China were
hit by heatwaves and drought, which caused demand for air
conditioning to surge amid reduced hydropower generation in
Sichuan. The United States saw severe winter storms in December,
triggering massive power outages. Mitigating the impacts of climate
change requires faster decarbonisation and accelerated deployment
of clean energy technologies. At the same time, as the clean energy
transition gathers pace, the impact of weather events on electricity
demand will intensify due to the increased electrification of heating,
while the share of weather-dependent renewables will continue to
grow in the generation mix. In such a world, increasing the flexibility
of the power systems while ensuring security of supply and
resilience will be crucial.

Electricity Market Report 2023
P
AGE | 11
IEA. CC BY 4.0.
Global overview
Global overview

Electricity Market Report 2023
P
AGE | 12
IEA. CC BY 4.0.
Global overview
Demand

Electricity Market Report 2023
P
AGE | 13
IEA. CC BY 4.0.
Global overview
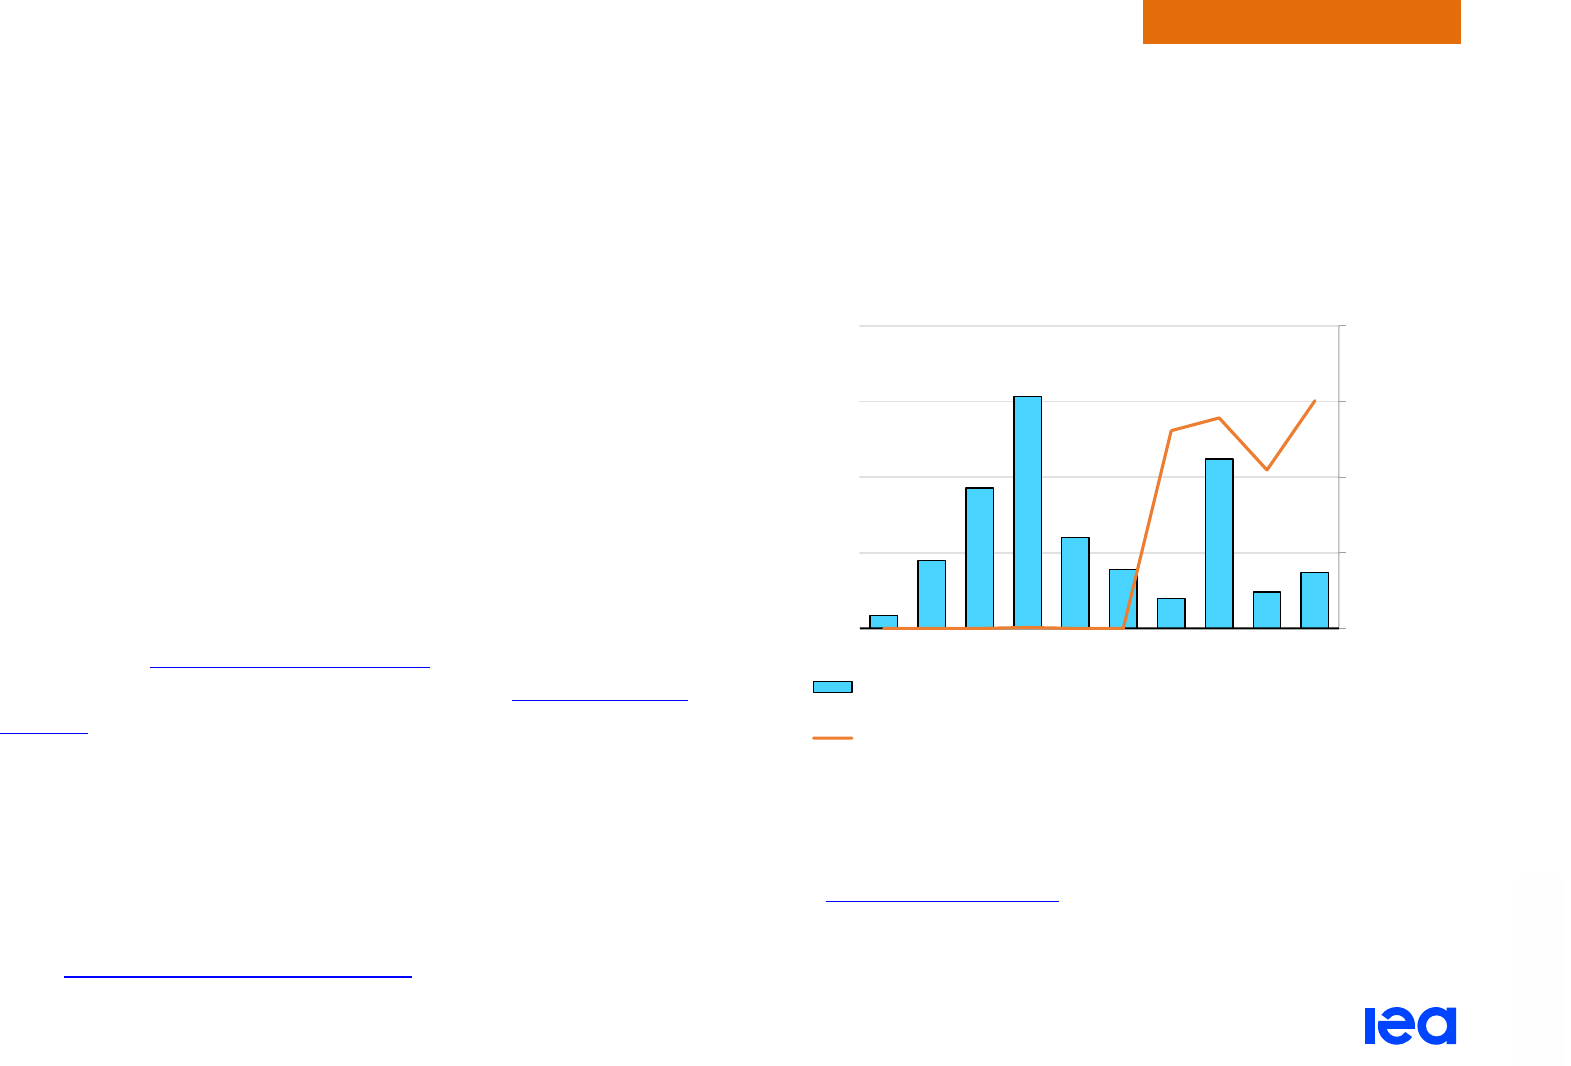
Global electricity demand growth eased in 2022, but is set to accelerate from 2023, led by Asia
The energy crisis sparked by the Russian Federation’s (hereafter
“Russia”) invasion of Ukraine has been characterised by record-high
commodity prices, weaker economic growth and high inflation.
Higher fuel prices increased the cost of electricity generation around
the world, putting downward pressure on consumption in many
regions. Despite the worsening crisis, global electricity demand
remained relatively resilient, growing by almost 2% in 2022.
By 2025, for the first time in history, Asia will account for half of the
world’s electricity consumption and one-third of global electricity will
be consumed in China. Over the outlook period, global electricity
demand is set to grow at an accelerated pace, by an annualised
3%, as electricity consumption increases in emerging markets and
developing economies (EMDEs), led by the People’s Republic of
China (hereafter “China”), India and Southeast Asia.
As the energy crisis abates, global electricity demand growth is set
to rise from 2.6% in 2023 to an average 3.2% in 2024-2025. This
stronger growth is well above the pre-pandemic rate of 2.4%
observed in the 2015-2019 period. Indeed, by 2025 demand will
increase by 2 500 TWh from 2022 levels, which means that over the
next three years the electricity consumption added each year is
roughly equivalent to that of the United Kingdom and Germany
combined. More than half of the increase will come from China. The
remaining growth will largely take place in India and Southeast Asia.
In China, electricity demand growth was subdued on weaker
economic activity in 2022, rising at an estimated 2.6%, and
significantly below its trend of 5.4% in 2015-2019. China is by far
the world’s largest electricity consumer at 31% of global demand in
2022. For 2023-2025 we expect an average annual growth of 5.2%.
In India, the robust post-pandemic recovery continued to support
strong electricity demand of over 8.4% in 2022, which was
substantially higher than the average annual growth rate of 5.3%
seen in the 2015-2019 period. The peak summer season also
arrived early in 2022, resulting in the hottest March in over a
century. Electricity demand from March to July was 12% higher than
the same period in 2021. For the 2023-2025 period, we expect
slightly slower growth, averaging 5.6% per year.
Electricity demand in the European Union (EU) fell 3.5% in 2022,
with spiking electricity prices, demand destruction in electricity-
intensive industries, energy saving measures and a mild winter all
contributing to the decline. We expect EU demand to grow by
around 1.4% on average in 2023-2025.
In the United States, electricity demand rose by 2.6% in 2022,
surpassing pre-Covid levels. But an expected economic slowdown
in 2023 is expected to lead to a decline of about 0.6%, before
returning to growth of 1.2% in 2024 and 1.3% in 2025.
In Africa, electricity demand rose by 1.5% in 2022, with growth
tempered by both lofty energy prices and high inflation rates. Our
2023-2025 outlook for the region shows much stronger growth of an
average 4.1%, led by a post-crisis economic recovery.
Electricity Market Report 2023
P
AGE | 14
IEA. CC BY 4.0.
Global overview
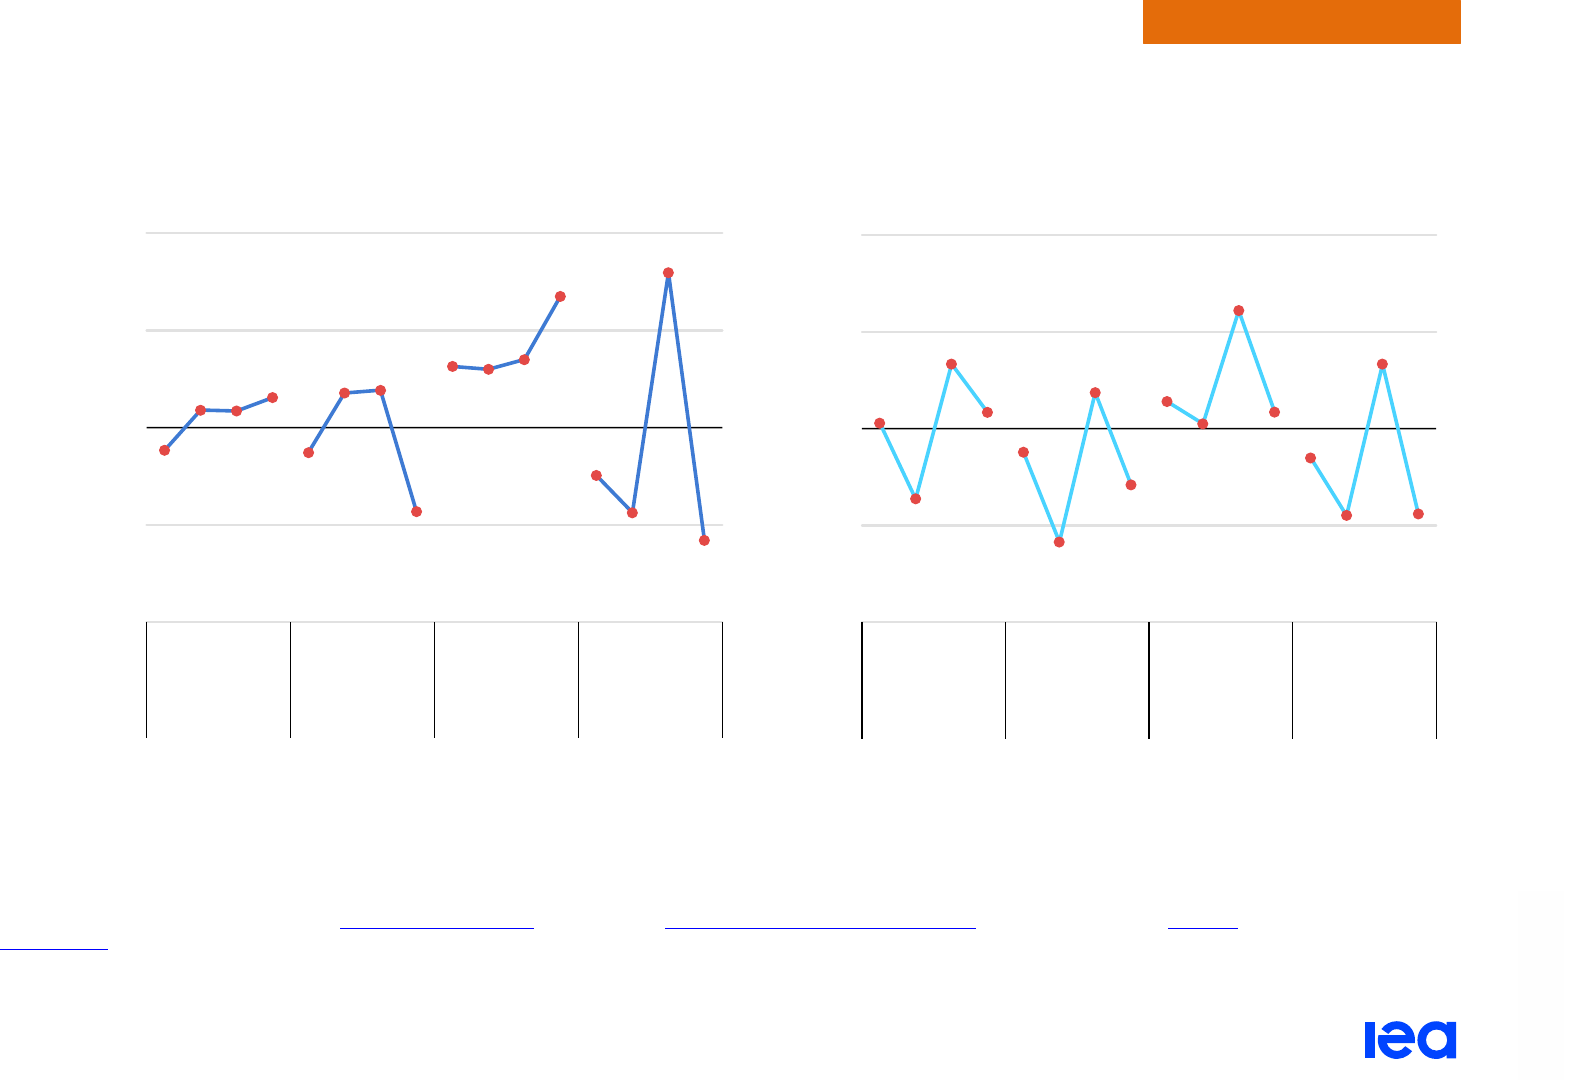
Out to 2025, more than 70% of the growth in global electricity demand is set to come from
China, India and Southeast Asia combined
Year-on-year relative global change in electricity demand,
2015-2025
IEA. CC BY 4.0.
Year-on-year change in electricity demand by region, 2019-2025
IEA. CC BY 4.0.
-1%
0%
1%
2%
3%
4%
5%
6%
2015
2016
2017
2018
2019
2020
2021
2022
2023
2024
2025
Electricity demand growth
Historical demand
Updated forecast
Previous forecast (July 2022)
- 500
- 300
- 100
100
300
500
700
900
1 100
1 300
1 500
2019 2020 2021 2022 2023 2024 2025
TWh
China India Southeast Asia
United States European Union Others
Net change
Electricity Market Report 2023
P
AGE | 15
IEA. CC BY 4.0.
Global overview
By 2025, Asia will account for half of the world’s electricity consumption and one-third of global
electricity will be consumed in China
Evolution of global electricity demand by region (left) and regional shares (right), 1990-2025
IEA. CC BY 4.0.
0
5 000
10 000
15 000
20 000
25 000
30 000
35 000
1990 1995 2000 2005 2010 2015 2020 2025
TWh
China Other Asia Africa Rest of the world United States & OECD Europe
5%
10%
25%
33%
13%
16%
18%
18%
0%
10%
20%
30%
40%
50%
60%
70%
80%
90%
100%
1990 2000 2015 2025

Electricity Market Report 2023
P
AGE | 16
IEA. CC BY 4.0.
Global overview
Global economic growth shows signs of resilience but continues to face challenges
The global economy continues to face myriad challenges in the
wake of Russia’s war in Ukraine and the rise in central bank rates
aimed at combating persistent inflation. The International Monetary
Fund’s (IMF) January 2023 World Economic Outlook
pr
ovides
forecasts up to 2024 and shows global GDP growth of 6.2% in 2021
contracting to 3.4% in 2022 and easing to 2.9% in 2023. By 2024,
growth inches higher again, to 3.1%. The latest forecast represents
downward revisions of 0.2%, 0.7% and 0.3%, respectively,
compared with the
April 2022 forecast, w
hich underpinned our July
update. The January 2023 outlook, however, was slightly more
optimistic than the previous October 2022
forecast f
or the short
term, with global GDP growth for both 2022 and 2023 raised by
0.2 percent points. The October outlook, which provided projections
up to 2027, forecast a global GDP growth rate of 3.4% in 2025.
For the United States,
the IMF revised its latest GDP estimate to
2% for 2022 from 3.7% in April and its outlook to 1.4% from 2.3%
for 2023. Growth is forecast at a slower 1% in 2024. The contracting
trend reflects persistent and broadening inflation pressures and
higher interest rates that will continue to temper purchasing power.
2025 growth from the October outlook is 1.8%.
For the Euro area, GDP growth is estimated in the January outlook
at 3.5% for 2022 before plummeting to just 0.7% in 2023 and then
recovering to 1.6% in 2024. The latest forecast shows a sharp
downward revision from the April estimate of 2.3% for 2023. The
weaker outlook largely reflects the spillover effects from the war in
Ukraine and rate hikes from the European Central Bank, which are
partially offset by lower wholesale energy prices and support from
energy price controls. For 2025, a growth of 1.9% was forecast in
the October outlook.
Under pressure from its zero-Covid policy, China’s economy slowed
from the pre-pandemic average growth of 6.7% between 2015-2019
to 3% in 2022. However, the country’s sudden easing of its stringent
pandemic restrictions prompted an upward revision to 5.2% for
2023, up three percentage points from the October projections but
similar to its 5.1% estimate in April. Growth is forecast to slow to
4.5% in 2024. The October forecast estimated growth of 4.6% for
2025.
The GDP growth for India is estimated at 6.8% for 2022.The
outlook was revised downward in January to 6.1% from 6.9% for
2023, largely due to slow economic growth in its trading partner
countries. GDP growth for 2024 was unchanged at 6.8%. The 2025
forecast from the previous October outlook is 6.8%.
Sub-Saharan Africa’s GDP growth is estimated to ease from 4.7%
in 2021 to 3.8% in 2022, due to higher inflation and slower-than-
expected progress on poverty reduction. However, economic growth
will speed up from 3.8% in 2023 to above 4% in 2024 and 2025.
The IMF expects Latin America and the Caribbean’s GDP to grow
by 3.9% in 2022, 1.8% in 2023 and 2.1% in 2024. October forecast
for 2025 was 2.5%.
Electricity Market Report 2023
P
AGE | 17
IEA. CC BY 4.0.
Global overview
The war in Ukraine, energy crisis and persistent inflation suppress the economic outlook
Gross domestic product growth assumptions by country and region, 2022-2025
IEA. All rights reserved.
Notes: The bars represent annual changes in GDP relative to the previous year. The hollow lines show the previous April 2022 forecast. 2022-2024 values are from the January 2023
World Economic Outlook Update of International Monetary Fund (IMF). 2025 values are from IMF’s October 2022 outlook.
Sources: Based on International Monetary Fund (2023), World Economic Outlook October 2022 Database, World Economic Outlook Update January 2023
, 1 F
ebruary 2023.
-2%
-1%
0%
1%
2%
3%
4%
5%
6%
7%
8%
9%
2022
2023
2024
2025
2022
2023
2024
2025
2022
2023
2024
2025
2022
2023
2024
2025
2022
2023
2024
2025
2022
2023
2024
2025
2022
2023
2024
2025
2022
2023
2024
2025
2022
2023
2024
2025
United
States
Euro area United
Kingdom
Japan China India Brazil South Africa
World Advanced economies Emerging and developing economies
Real GDP, annual change
Updated forecast (IMF October 2022, January 2023) Previous forecast (IMF April 2022)

Electricity Market Report 2023
P
AGE | 18
IEA. CC BY 4.0.
Global overview
Industrial electricity demand plummeted to historic lows in multiple countries in 2022
In 2021, many countries started to gradually phase out Covid-19
public policy measures and return to more normal economic activity.
However, some economies (e.g. China) still imposed lockdowns in
2022, which had an impact on both residential and industrial
electricity consumption. Equally, persistently high electricity prices
continued to add downward pressure on consumption, particularly in
the residential and industrial sectors.
Comparing the first three quarters of the years, both the
United Kingdom and Spain experienced the lowest industrial
electricity consumption in over 20 years in 2022. Spain saw a
decrease of more than 10% compared to 2019, while the
United Kingdom posted a drop of almost 15% in 2022 versus 2019.
Spain’s electricity-intensive manufacturing activity was especially
hard hit by the rise in prices. The country’s industrial electricity
consumption posted a similar y-o-y decline in 2022 as it did in 2020
when severe Covid-related lockdowns led to substantial demand
destruction. Of the countries surveyed, the United Kingdom saw the
sharpest rise in average wholesale electricity prices. Spain followed
with the second highest level, despite the June 2022
implementation of the Iberian exception, a cap on wholesale gas
prices adopted to reduce the cost of electricity.
In the United Kingdom and Spain, as elsewhere, residents spent
more time at home during widespread Covid-19 lockdowns in 2021,
which led to higher residential electricity consumption that was well
above the subsequent 2022 levels when pandemic restrictions were
eased. Although formal Covid restrictions were lifted in the
United Kingdom in July 2021, many employees continued to
telework through the end of the year, which was less the case in
2022. In addition to the surge in prices amid the energy crisis, a
return to more normal work patterns and warmer temperatures
weighed heavily on UK residential consumption in 2022.
China’s
zero-Covid policy in 2022 boosted residential electricity
demand while growth in the industrial sector was tempered by
weaker economic activity. Residential power consumption has been
steadily increasing as the electrification of homes rapidly expands,
with a growing share of electricity used in cooling, heating, cooking
and appliances. The country’s house-bound population propelled
residential electricity demand up by a sharp 13.5% in 2022.
By contrast, China’s strict pandemic restrictions and lockdowns
disrupted the country’s economic activity. As a result, electricity
demand in the industrial sector was up a modest 1.7%. Coal supply
shortages also caused power restrictions and outages in industrial
hubs such as in Northeast China and the provinces of Guangdong
and Hunan, further contributing to the slowdown.
In the United States, residential electricity consumption saw a
similar y-o-y growth in 2022 as in the previous two years. Weaker
industrial electricity demand growth mainly reflected the slowdown
in the economy.
Electricity Market Report 2023
P
AGE | 19
IEA. CC BY 4.0.
Global overview
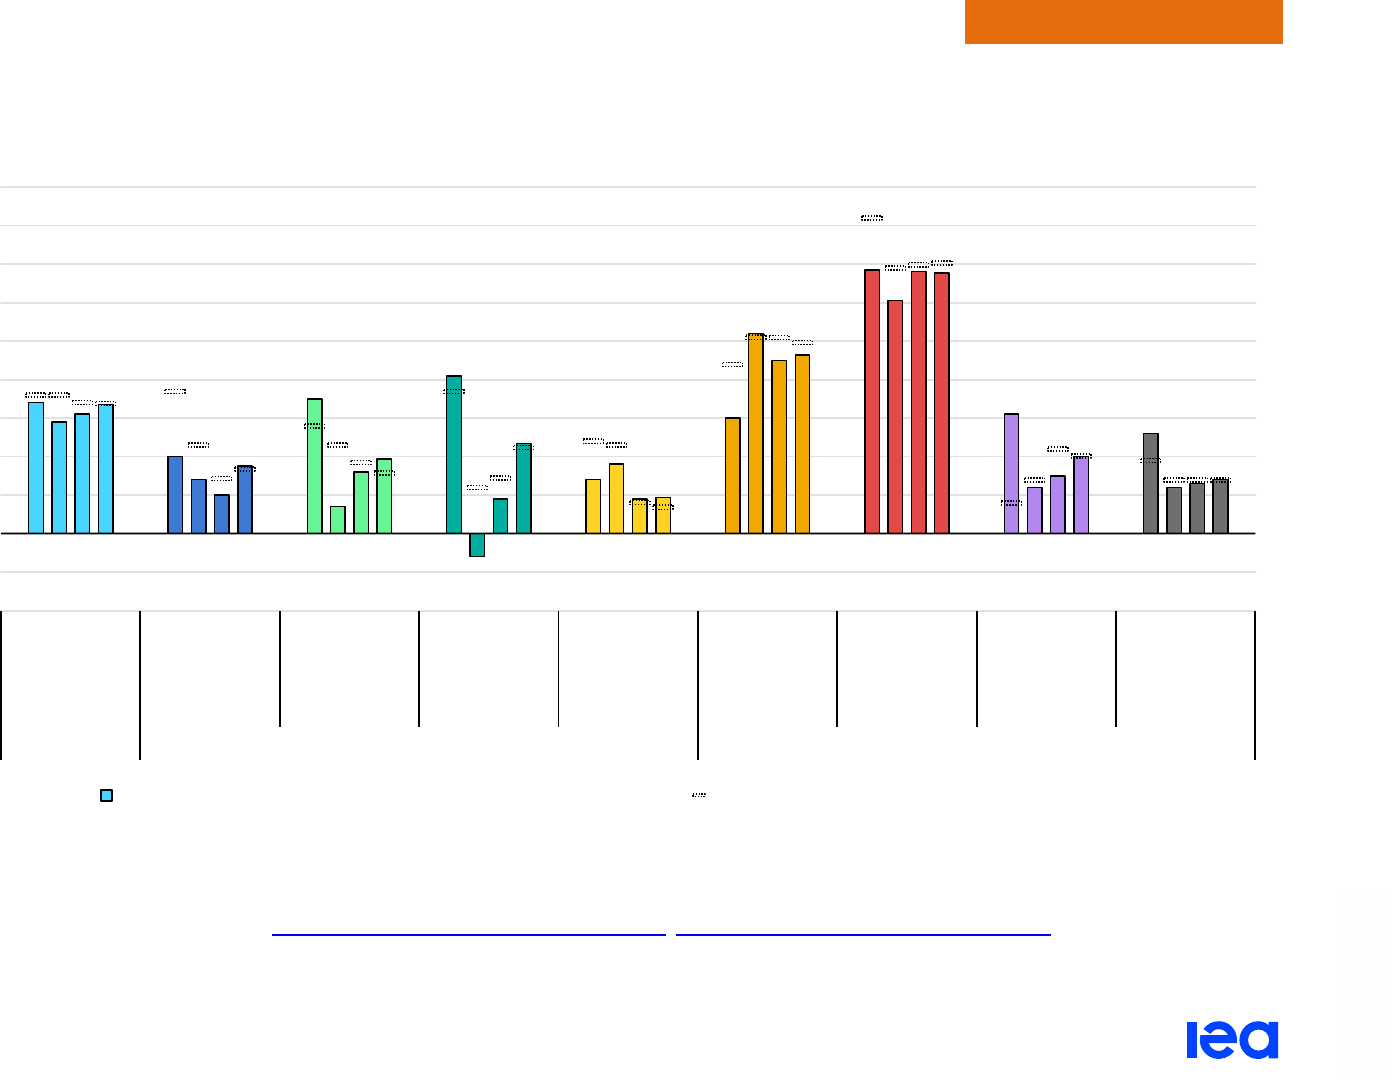
The United Kingdom and Spain saw a decline in industrial electricity consumption in 2022
Year-on-year change in sectoral electricity consumption in selected large economies, 2019-2022
IEA. All rights reserved.
Note: The analysis is based on data for the first three quarters of 2019-2022.
Sources: IEA analysis using data from the China Electricity Council (China) (2023), U.S. Energy Information Administration (United States) (2023), GOV.UK
(
United Kingdom) (2023),
Red Eléctrica (Spain) (2023), 31 January 2023.
-20%
-10%
0%
10%
20%
2019
2020
2021
2022
2019
2020
2021
2022
2019
2020
2021
2022
2019
2020
2021
2022
United States United
Kingdom
China Spain
Residential
-20%
-10%
0%
10%
20%
2019
2020
2021
2022
2019
2020
2021
2022
2019
2020
2021
2022
2019
2020
2021
2022
United States United
Kingdom
China Spain
Industrial

Electricity Market Report 2023
P
AGE | 20
IEA. CC BY 4.0.
Global overview
Supply

Electricity Market Report 2023
P
AGE | 21
IEA. CC BY 4.0.
Global overview
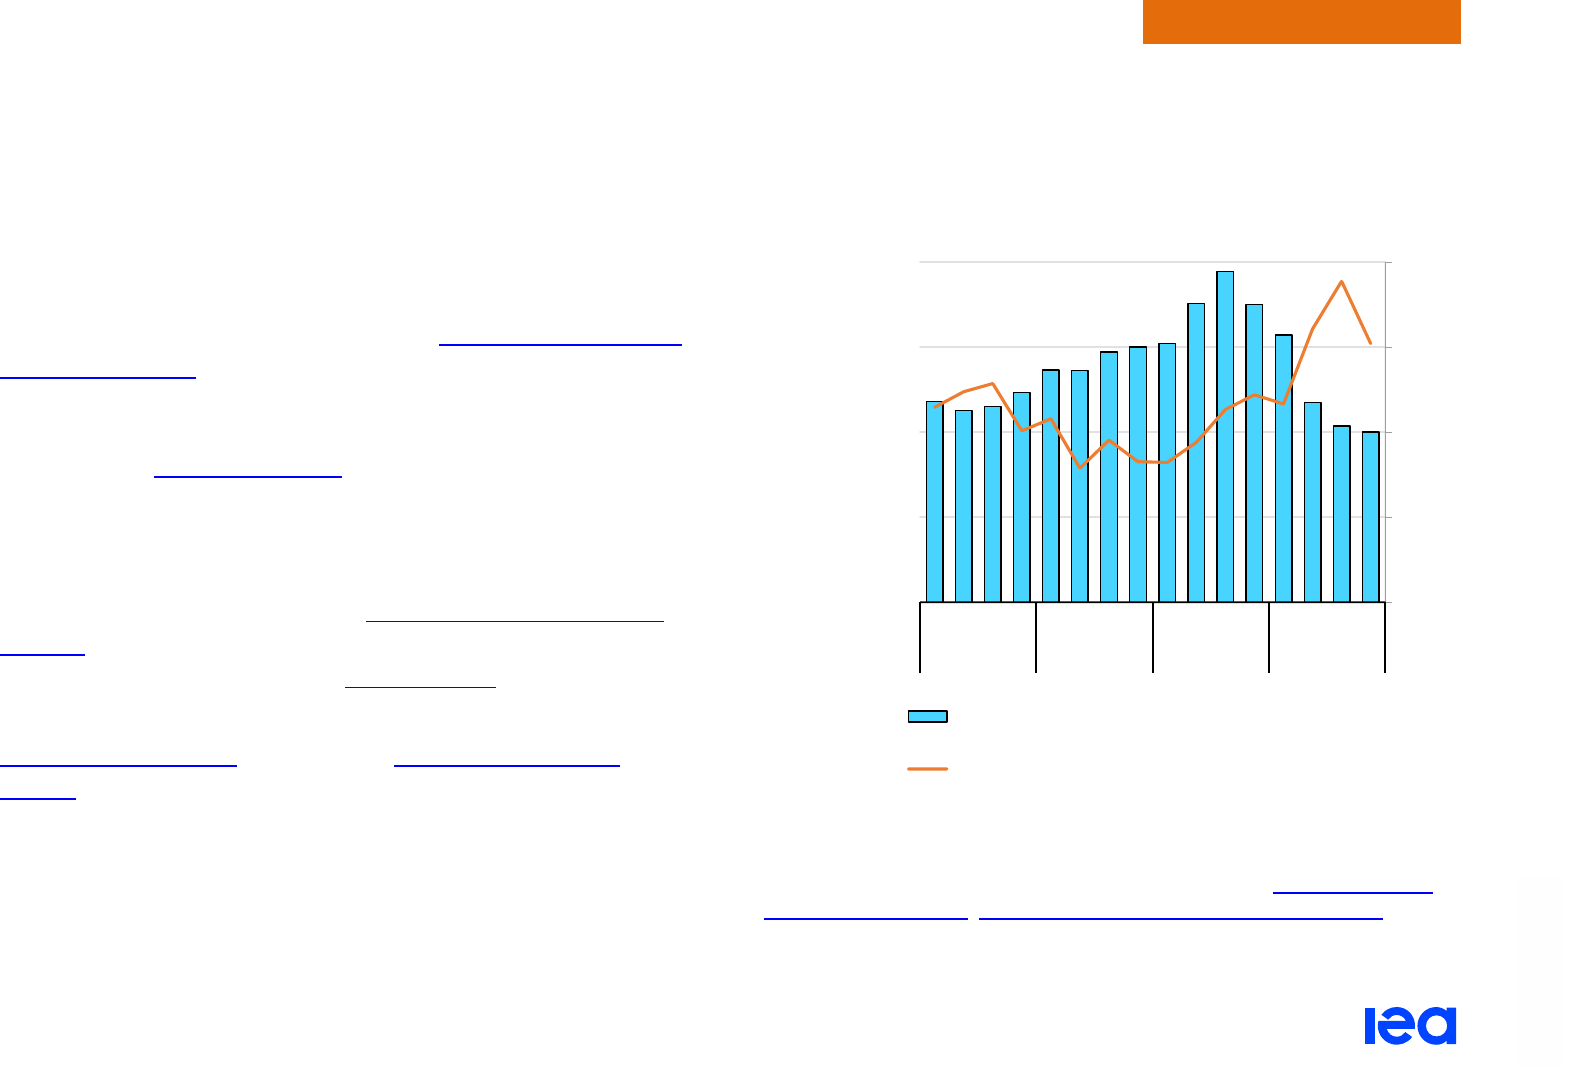
Low-carbon sources set to cover almost all the growth in global electricity demand by 2025
Power systems faced challenges in multiple regions in 2022 due to
extreme weather events. Heatwaves and droughts strained the
supply situation in both China and India. A historic drought in
Europe resulted in low hydropower output, putting increased
pressure on dispatchable capacities amid record-low nuclear
generation in France. In the United States, winter storms caused
widespread power outages. These extreme events reinforce the
urgent need to increase the flexibility of the power system and
enhance security of electricity supply to better cope with weather-
related contingencies.
In 2022, the surge in fossil fuel prices following Russia’s invasion of
Ukraine also compounded the supply situation, especially for gas.
The relatively higher increase in natural gas and LNG prices
prompted a wave of fuel switching in the world to coal for use in
power generation. Global coal-fired generation rose by 1.5% in
2022, with the largest absolute increases in the Asia Pacific region.
Coal-fired generation also rose significantly in the European Union
amid low hydro and nuclear output. However, 2022 is likely to be an
exception and global coal-fired generation is forecast to plateau in
2023-2025, as higher output in the Asia Pacific region is offset by
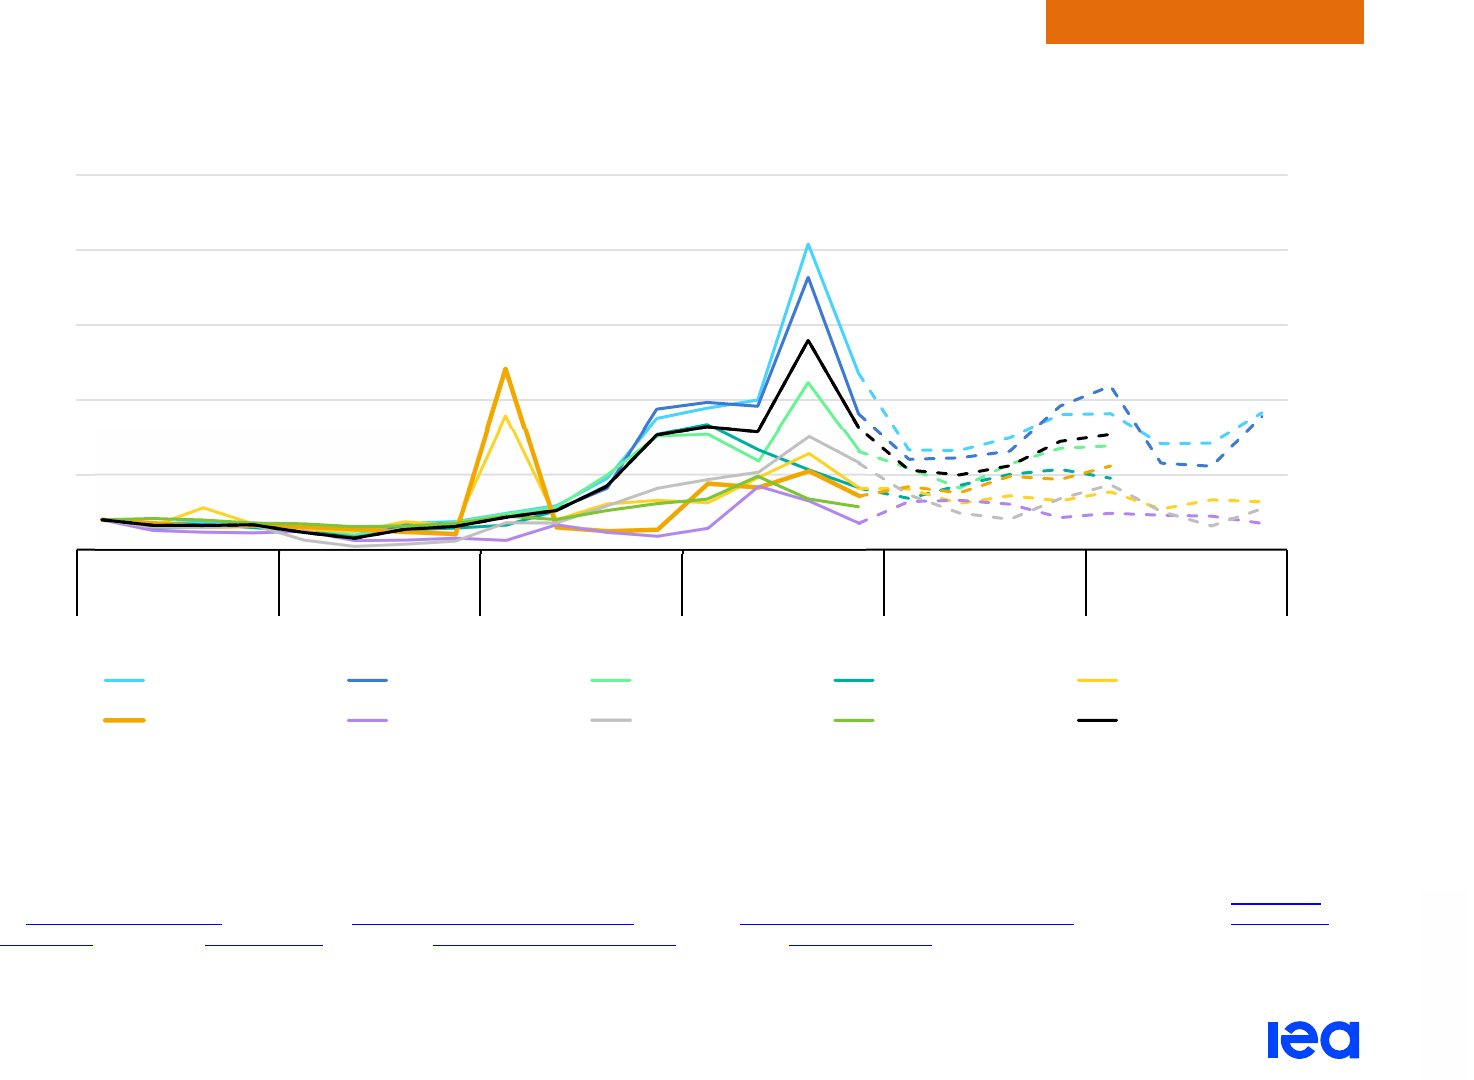
declines in Europe and the Americas.
Global gas-fired generation remained relatively unchanged in
2022 compared to 2021, as declines in China, India and other
regions were largely offset by a rise in gas-fired output in the
United States. We expect global gas-fired generation to stagnate to
2025 on average, after declining by 3% in 2023, then growing by
1.4% in 2024 and 2% in 2025. Substantial declines in the EU will
partly be offset by significant growth in the Middle East.
Low-carbon generation from renewables and nuclear had diverging
trends in 2022. Renewables saw a year-on-year rise of 5.7%,
making up almost 30% of the generation mix. A surge in renewable
generation in the Asia Pacific region accounted for more than half of
the increase, followed by Americas. By contrast, nuclear output fell
4.3%. This was due to maintenance outages at a large number of
French plants, decommissioning of units in Germany and Belgium,
and reduced Ukrainian output.
Our outlook for 2023 to 2025 shows that renewable power
generation is set to increase more than all other sources combined,
with an annualised growth of over 9%. Renewables will make up
over one-third of the global generation mix by 2025. This trend is
supported by government pledges to increase spending on
renewables as part of economic recovery plans such as the Inflation
Reduction Act in the United States. Nuclear output is expected to
grow by 3.6% per year on average, mainly due to the increase in
Asia Pacific, plus French generation returning to normal. As a result,
low-carbon generation sources – renewables and nuclear together –
are expected to meet on average more than 90% of the additional
electricity demand over the next three years, unless developments
in the global economy and weather events change the trends in
electricity demand and fossil-fired generation.
Electricity Market Report 2023
P
AGE | 22
IEA. CC BY 4.0.
Global overview
Renewables growth dampens fossil fuel-fired generation from 2023 to 2025
Year-on-year global change in electricity generation by source, 2019-2025
IEA. CC BY 4.0.
- 800
- 600
- 400
- 200
0
200
400
600
800
1 000
1 200
2019
2020
2021
2022
2023
2024
2025
2019
2020
2021
2022
2023
2024
2025
2019
2020
2021
2022
2023
2024
2025
2019
2020
2021
2022
2023
2024
2025
Coal Gas Nuclear Renewables
TWh
Coal Gas Nuclear Renewables Previous forecast (July 2022)
Electricity Market Report 2023
P
AGE | 23
IEA. CC BY 4.0.
Global overview
Hydropower generation exceptionally low in Europe in 2022 due to the historic drought
The year 2022 was characterised by heatwaves and droughts in
many regions, causing significant declines in hydropower output.
This has underscored the potential impacts of changing climate
patterns on power systems as low hydropower generation puts
additional strain on the remaining dispatchable conventional fleet
and increases the cost of electricity supply. Despite these
uncertainties, our current outlook sees global hydropower supply
grow in 2023 to 2025 on planned capacity expansions.
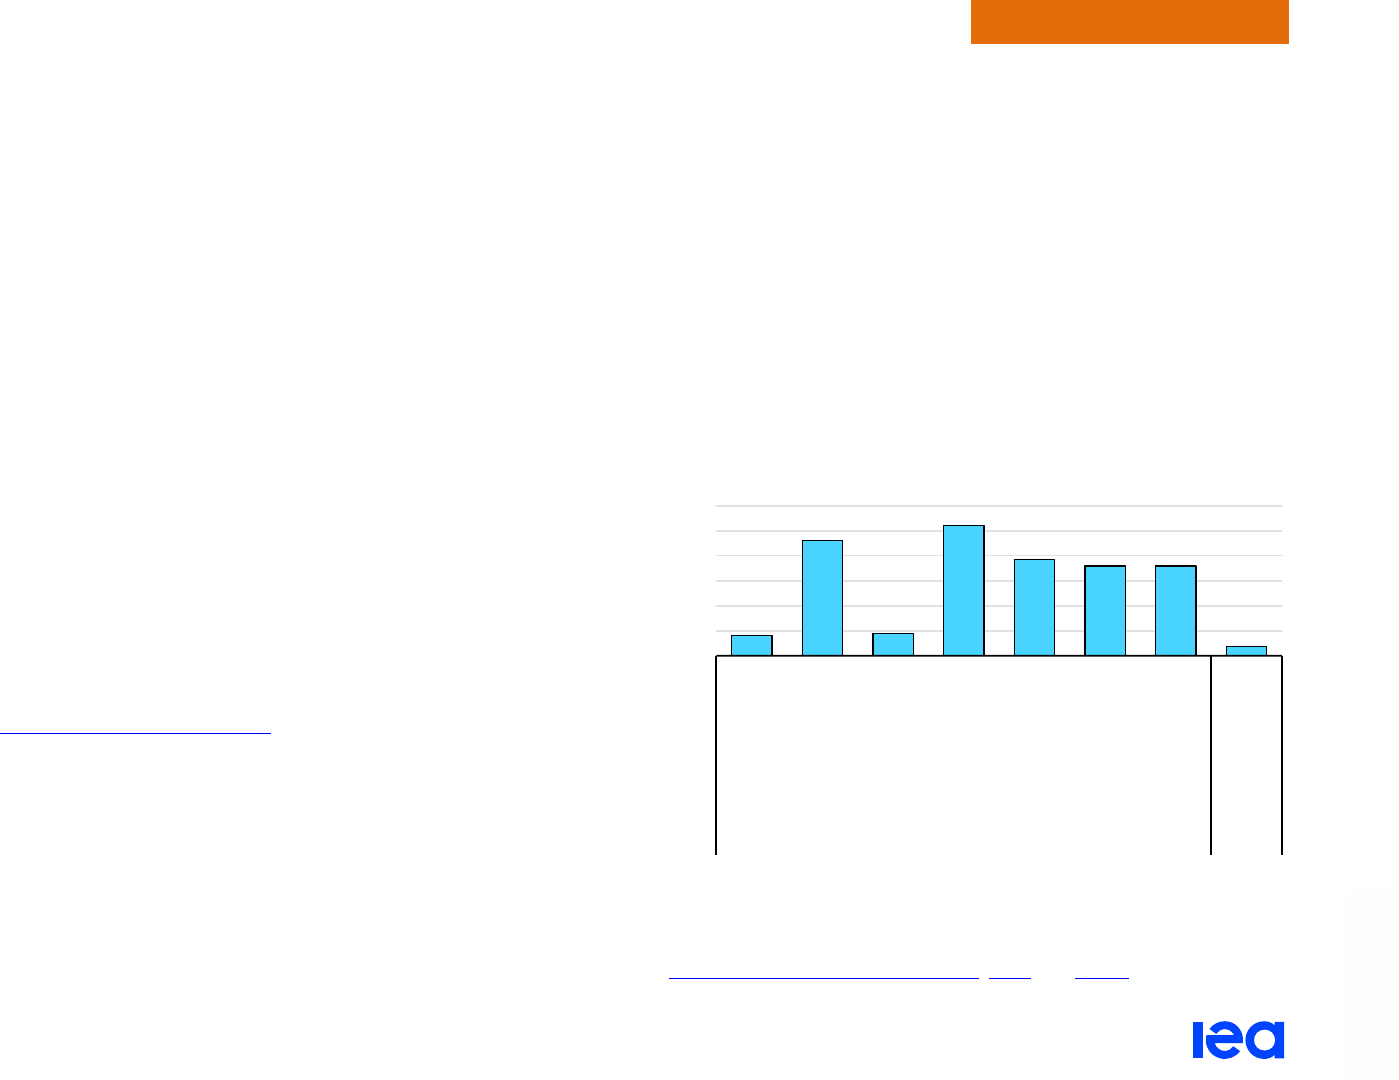
Europe saw its worst drought in 500 years
in 2022. Italy had a
record drop in hydropower output, posting its lowest hydropower
generation in the last two decades in the February-April 2022
period. Italy’s hydro use was down more than 30% compared to
2017-2021 averages, followed closely by Spain at 29% and France
at 20%. Norway had the
driest 12-month period in 26 years, wit
h
hydro reservoir levels in September declining to the lowest monthly
output in the last decade. Republic of Türkiye (hereafter “Türkiye”),
which saw its lowest hydro output in 2021 since 2014, had a strong
20% year-on-year rebound in 2022 but remained 5% below its
2017-2021 average.
In C
hina, drought conditions in Sichuan caused a significant drop in
hydropower output during August and September, depressing
annual growth to just below 1% in 2022. In India, despite a record
heatwave in 2022, hydropower generation increased more than
10% above its 2017-2021 average.
Percentage change in hydropower generation in 2022 compared
to the 2017-2021 average in selected countries and regions
IEA. CC BY 4.0.
Source: IEA (2023), Monthly Electricity Statistics, 31
January 2023.
Monthly hydropower generation in OECD Europe, 2017-2022
IEA. CC BY 4.0.
Source: IEA (2023), Monthly Electricity Statistics, 31
January 2023.
-40%
-20%
0%
20%
30
40
50
60
70
Jan Feb Mar Apr May Jun Jul Aug Sep Oct Nov Dec
TWh
2017-2021 range 2022 2021

Electricity Market Report 2023
P
AGE | 24
IEA. CC BY 4.0.
Global overview
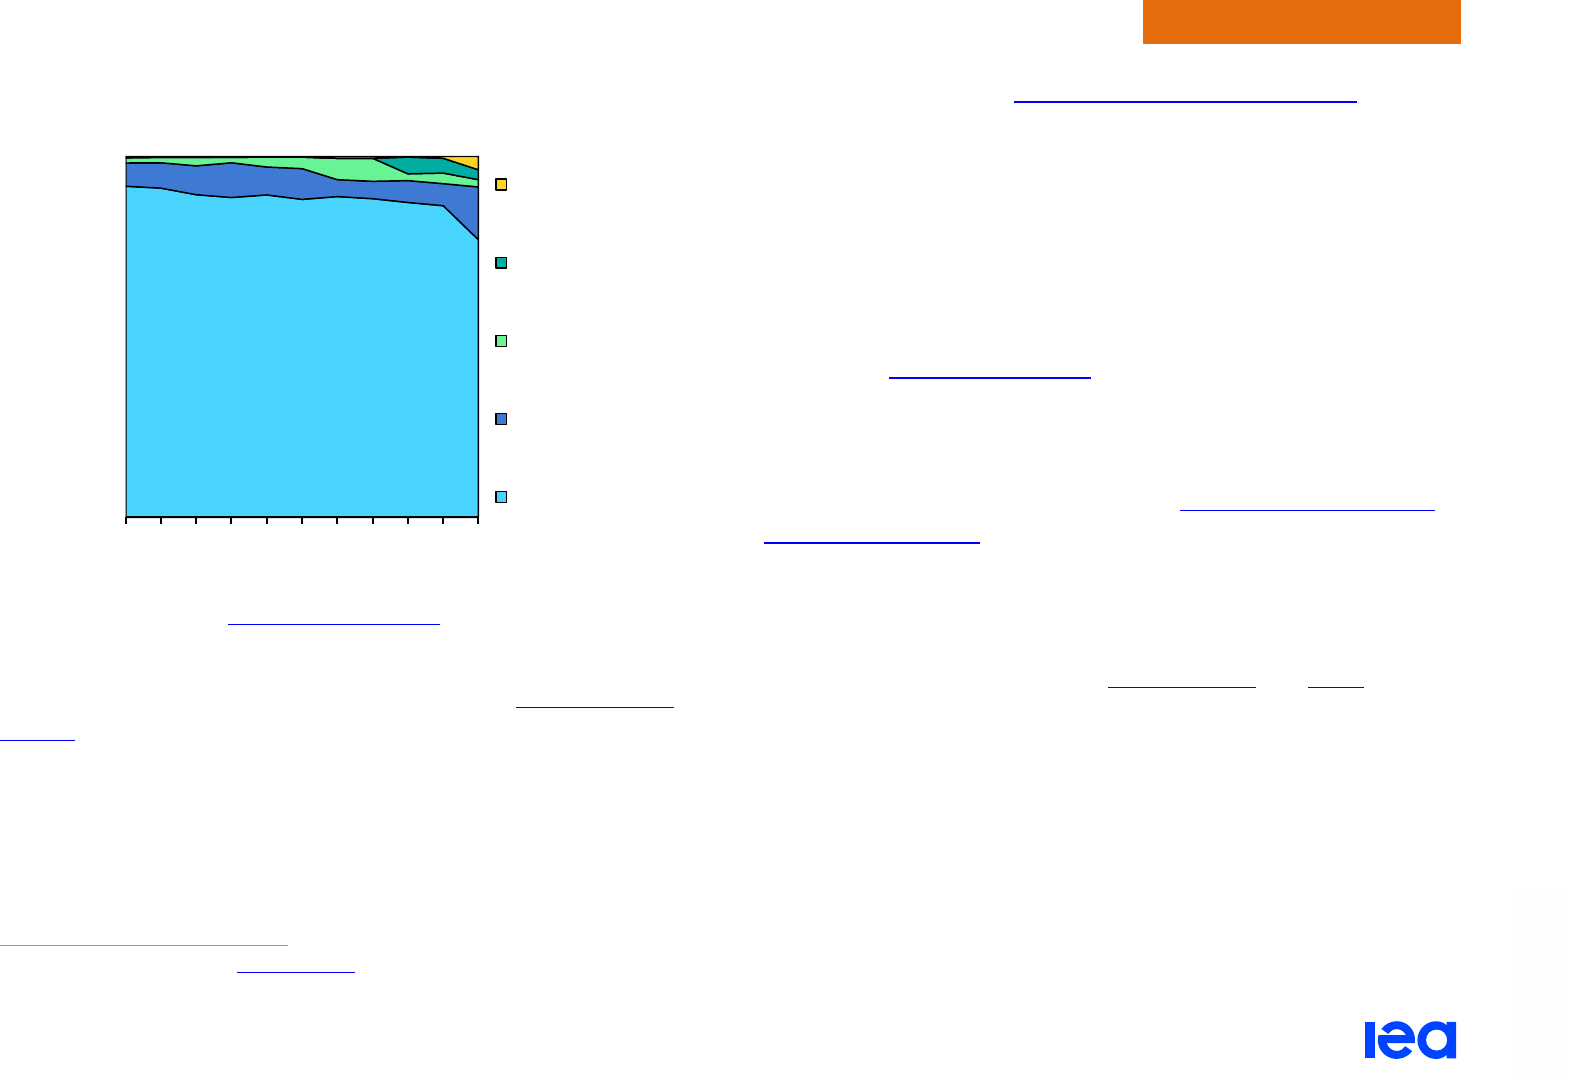
Significant potential to integrate more renewables in the world’s electricity generation fleet
Global installed capacity of renewables is estimated to have
increased at a faster year-on-year rate of almost 11% in 2022
compared to the average 9% growth seen in the 2017-2021 period.
Variable renewables – wind and solar PV – continued to see strong
growth in combined capacity, up nearly 18%. This corresponds to
about 300 GW in additional installed capacity of variable
renewables, which is greater than the current combined wind and
solar PV cumulative capacity in the United States (approximately
280 GW).
Despite continued growth in 2022, the share of variable renewable
capacity in the total generation fleet remains below 25% in the
world, whereas in Europe it is 35%. In countries with high variable
renewables penetration, variable wind and solar PV can make up
more than 60% of the total generation capacity (e.g. Denmark,
Germany). From a global perspective, there is enough potential for
further capacity expansions of variable renewables in many regions
of the world without facing major system integration bottlenecks.
As the share of variable renewables increases in the generation
fleet, their successful integration into the power system will
increasingly become more challenging. For the balancing of variable
generation, apart from expanding storage capacities and increasing
demand-side flexibility, having sufficient dispatchable capacity will
be crucial. In a decarbonised electricity sector, dispatchable
renewables such as hydro reservoir, geothermal and biomass
plants will be essential for complementing the variable renewables.
Evolution of dispatchable and variable generation capacities in
the world and in Europe, 2012-2022
IEA. CC BY 4.0.
Note: Dispatchable renewable capacity in the figure also includes run-of-river
hydropower plants.
Sources: IEA (2022), World Energy Outlook 2022; IEA (2022), Renewables 2022.
0
2 000
4 000
6 000
8 000
10 000
2012 2014 2016 2018
2020 2022
GW
Dispatchable conventional Dispatchable renewable
Variable wind Variable solar
World
0
200
400
600
800
1 000
1 200
1 400
1 600
2012
2014 2016 2018 2020 2022
Europe
Electricity Market Report 2023
P
AGE | 25
IEA. CC BY 4.0.
Global overview
Affordability of energy remains a challenge for emerging and developing economies
The cost of electricity generation in 2022 increased in many parts of
the world, led by surging energy commodity prices. The rise in
generation costs has been more moderate in places with regulated
tariffs and long-term fuel supply agreements. However, regions
depending on short-term markets for fuel procurement were
severely affected by the steep rise in prices. In particular, record-
high LNG prices created financial hardships for South Asian
countries – most notably Bangladesh and Pakistan – trying to
procure gas for the electricity sector, and significantly contributed to
power outages and rationing.
In Bangladesh, natural gas plays a prominent role in electricity
supply, making up about 80% (2018-2022 average) of the
generation mix. At the same time, Bangladesh relies on LNG
imports to meet fuel demand for power generation and was
therefore hit hard by high LNG prices in 2022. LNG accounts for
approximately 20% of the total natural gas
c
onsumption of
Bangladesh. Because of a notable decrease in its foreign exchange
reserves, the government stopped buying LNG from the spot
market during the period of July-November 2022, which resulted in
fuel shortages for the power sector.
Following the LNG shortage, Bangladesh faced harsh power
di
sruptions due to load shedding, where forced supply interventions
were carried out to resolve the imbalance between electricity
demand and supply. During these outages, electricity supply to
areas with industrial production activities
w
ere given priority to
minimise the impact on the industrial sector. Nevertheless,
industries as well as households faced electricity scarcity and
outages.
Year-on-year monthly change in electricity peak demand and
load shedding, Bangladesh, January-October 2022 vs. 2021
IEA. All rights reserved.
Note: Average load shed is calculated as an average of day peak and evening peak
load shed.
Source: IEA analysis based on Ministry of Information and Broadcasting (Bangladesh)
(2023), Monthly Management Report, 10 January 2023.
0
250
500
750
1 000
0%
10%
20%
30%
40%
Jan Feb Mar Apr May Jun Jul Aug Sep Oct
MW/day
Relative change in peak demand
Absolute change in average monthly load shed (right axis)
Electricity Market Report 2023
P
AGE | 26
IEA. CC BY 4.0.
Global overview
Pakistan was also severely affected by the high prices of fossil
fuels due to its strong reliance on fossil fuel imports, as gas (20%)
and coal (30%) play a significant role in its power generation mix. In
2022, electricity production from imported LNG fell by approximately
13% compared to 2021. The reduced LNG imports were attributed
to the country's inability to afford the supplies at the sharply
elevated price levels.
Similarly, in the face of a tight coal market,
imports of high calorific-
value coal declined in 2022, leading to closures of coal-fired power
plants. By contrast, lignite-fired plants experienced a surge in output
during 2022, attributed to an increase in domestic lignite production
coupled with a
fourfold expansion in imports from Afghanistan,
payable in Pakistani rupees, in H1 2022.
Fuel
shortages for the power sector were further exacerbated by the
country’s severe flooding between July and September.
Consequently, a quarter of the total
operational power generation
capacity had to be shut down. This contributed to scarcity of
electricity supply and subsequent power outages.
In 2022, Pakistan’s liquid foreign exchange reserves reached their
lowest level since 2014, leading to the
prioritisation of energy
imports to the detriment of other imports. This caused the shutdown
of some industrial facilities due to a lack of imported raw materials.
For em
erging markets and developing economies, fuel procurement
will continue to be an important issue if energy commodity prices
remain high in the coming years. Increased integration of renewable
energy sources will not only serve to decarbonise the energy sector
but would also reduce reliance on fossil fuel imports and help shield
the economies from external fuel price shocks.
Quarterly evolution of liquid foreign exchange reserves and the
share of payments for oil and LNG imports in the payments for
total imports, Pakistan, 2019-2022
IEA. All rights reserved.
Note: Oil refers to petroleum products and crude oil.
Sources: IEA analysis based on State Bank of Pakistan (2023), Import Payments by
Commodities and Groups, Gold and Foreign Exchange Reserves of Pakistan,
10 January 2023.
0%
10%
20%
30%
40%
0
20 000
40 000
60 000
80 000
Q1
Q2
Q3
Q4
Q1
Q2
Q3
Q4
Q1
Q2
Q3
Q4
Q1
Q2
Q3
Q4
2019 2020 2021 2022
Million USD
Total Liquid FX Reserves
Share of import payments for oil and LNG in total
import payments (right axis)
Electricity Market Report 2023
P
AGE | 27
IEA. CC BY 4.0.
Global overview
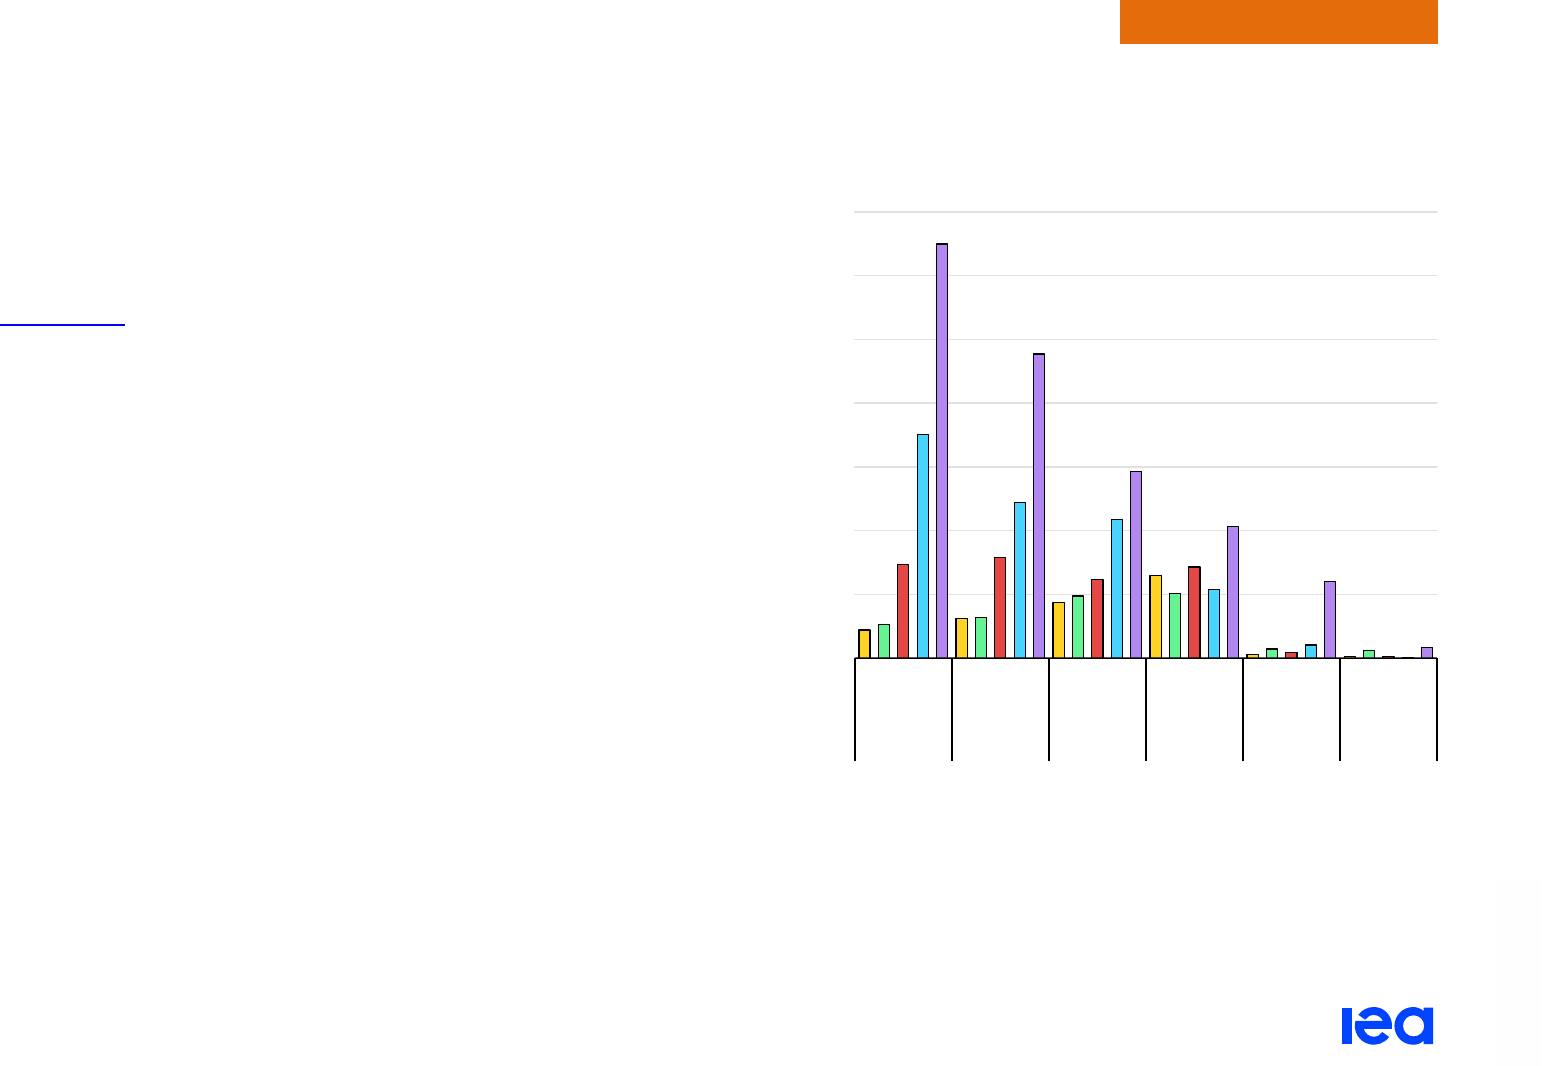
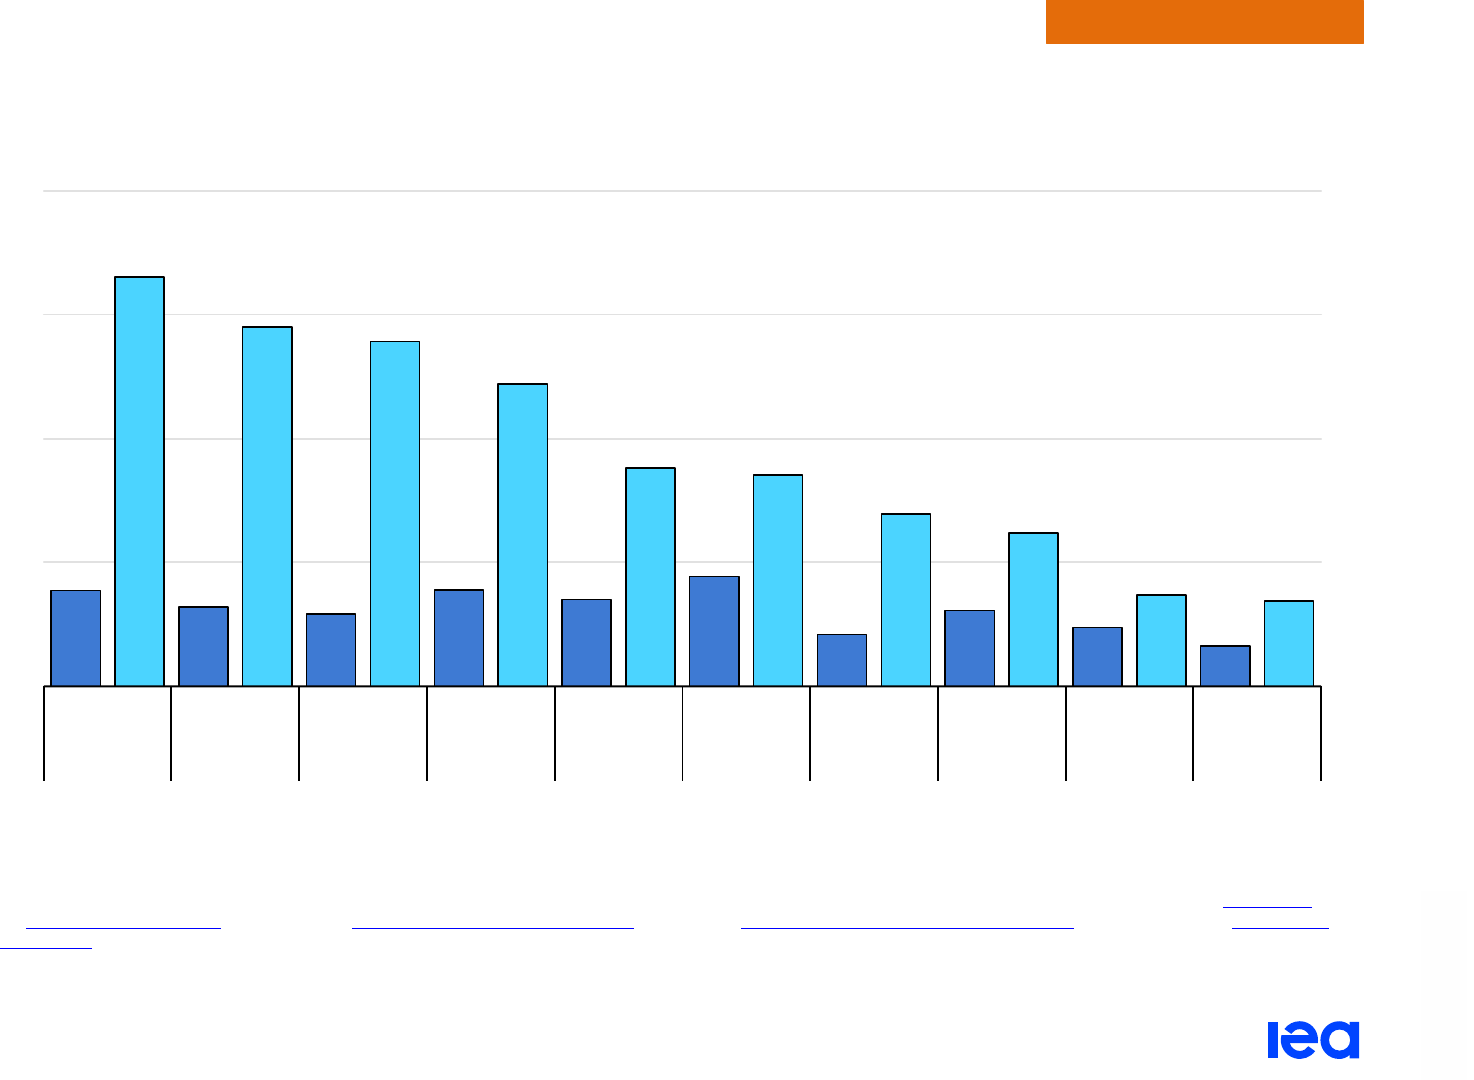
Stationary battery storage capacity additions are speeding up in emerging economies
As the share of variable renewable sources in electricity systems
further increase globally, battery systems are expected to play a
growing role by providing frequency control and operational
reserves as well as for wholesale arbitrage, while helping reduce
grid integration costs. The deployment of stationary battery systems
is speeding up
. In absolute magnitude, the United S
tates, Europe
and China are leading the latest annual capacity additions.
However, based on our 2022 estimates, emerging markets and
developing economies are on the way to catching up.
Compared with 2021, capacity additions in 2022 rose by over 80%
i
n the United States, almost 100% in China, roughly 35% in Europe,
90% in OECD Pacific (i.e. Japan, Korea, Australia and
New Zealand) and about sixfold in EMDEs, excluding China. In
2022, the largest fleet of cumulative battery systems installed
remains in the United States while China surpassed Europe in
cumulative capacity, reaching a total of 10 500 MW compared to
Europe's 9 400 MW.
The deployment rate in EMDEs gathered pace in 2022, with
capacity additions more than twice as high as the total cumulative
additions in 2015-2021. In China and the United States, over 45%
of the installed cumulative capacity was deployed in 2022. By
contrast, in EMDEs (excluding China), capacity additions in 2022
had a relatively much higher impact, accounting for almost 70% of
the total cumulative capacity in these regions.
Yearly stationary battery system additions by country and region,
2018-2022
IEA. All rights reserved.
Note: 2022 values are estimates.
Sources: IEA calculations based on Clean Horizon (2022), BNEF (2022), China Energy
Storage Alliance (2022).
0
1 000
2 000
3 000
4 000
5 000
6 000
7 000
2018
2019
2020
2021
2022E
2018
2019
2020
2021
2022E
2018
2019
2020
2021
2022E
2018
2019
2020
2021
2022E
2018
2019
2020
2021
2022E
2018
2019
2020
2021
2022E
United
States
China Europe OECD
Pacific
EMDEs
excl. China
Others
Yearly additions (MW)
Electricity Market Report 2023
P
AGE | 28
IEA. CC BY 4.0.
Global overview
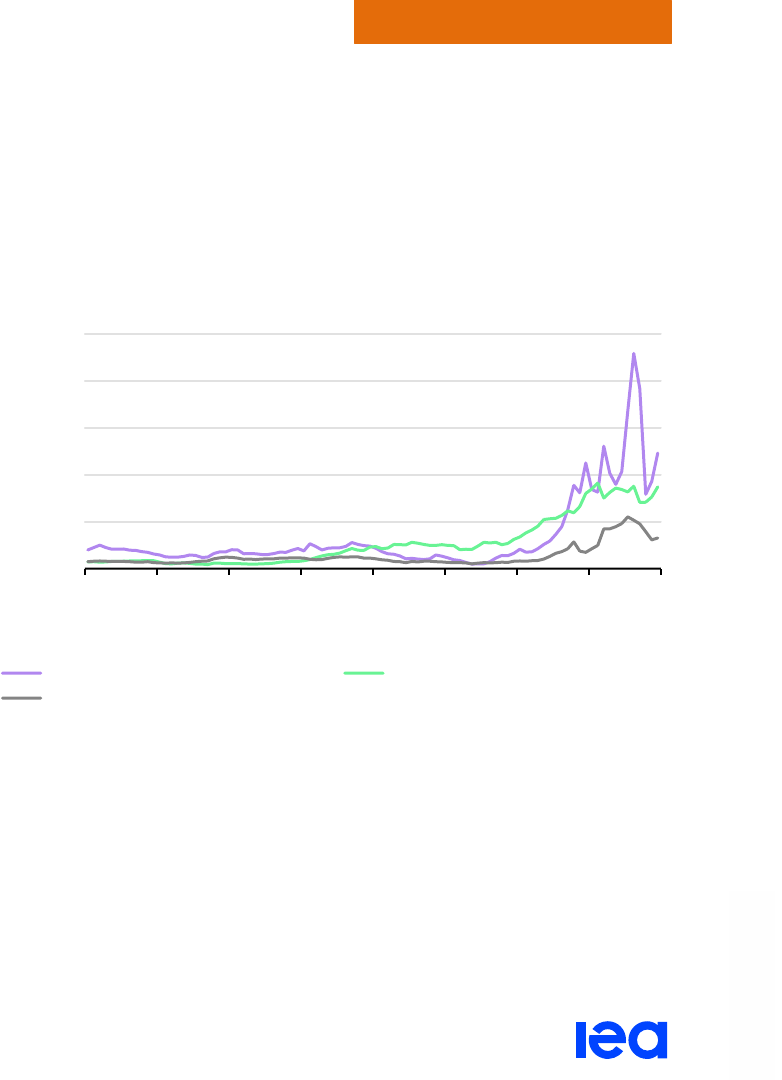
The surge in coal and gas prices raised thermal generation costs to decade highs in 2022
Russia’s invasion of Ukraine put unprecedented pressure on
European and global energy markets. Natural gas and thermal coal
prices in Asian and European spot markets rose to all-time highs
throughout 2022, sharply increasing the cost of thermal generation
in those markets. In the United States, tight supply and demand
fundamentals drove both coal and natural gas prices to decade
highs. Thermal generation costs are expected to remain well above
historical averages out to 2025, further eroding their
competitiveness compared to low-emission alternatives.
In the European Union, estimated gas-based thermal generation
cost more than doubled in 2022 compared to the previous year, to
an average of USD 350/MWh. Coal-based thermal generation costs
almost doubled to an average of USD 190/MWh. This has been
primarily driven by the rapidly tightening gas and coal market
fundamentals. Russia more than halved its pipeline gas supplies to
the European Union in 2022 – a year-on-year drop of 80 bcm in
absolute terms. Consequently, European gas prices soared to
record highs. Gas prices on the Title Transfer Facility (TTF) in the
Netherlands, the region’s leading hub, averaged USD 37/MBtu
(EUR 123/MWh) in 2022 – more than five times their 2016-2021
average. The strong increase in gas prices provided upward
pressure on thermal coal prices through fuel-switching dynamics in
the power sector. Rotterdam thermal coal prices averaged at an all-
time high of USD 290/t (EUR 40/MWh) in 2022. Despite record-high
prices for coal and gas, gas- and coal-fired generation rose in the
European Union by about 2% and 6% y-o-y, respectively, as low
hydro and nuclear power output increased the call on thermal power
plants.
Monthly average prices of natural gas, thermal coal and emission
certificates, Europe, 2015-2022
IEA. All rights reserved.
Sources: Natural gas prices from TTF; coal prices are CIF ARA; emission certificate
prices are EUA prices from EU ETS.
The price of the emissions allowances (EUA) on the EU Emissions
Trading System (EU ETS) saw record highs, reaching almost
EUR 100/t CO
2
in August 2022. The surge in emission prices was
mainly driven by the increase in coal-fired generation, which then
resulted in stronger demand for the allowances. Later in 2022,
0
50
100
150
200
250
2015
2016
2017
2018
2019
2020
2021
2022
EUR/MWh and EUR/t CO
2
Natural gas (TTF) Emission certificates (EUA)
Thermal coal (ARA)

Electricity Market Report 2023
P
AGE | 29
IEA. CC BY 4.0.
Global overview
carbon prices fell, as lower gas prices reduced gas-to-coal
switching in power generation. Despite this, in 2022 EU ETS prices
at an average EUR 81/t CO
2
were 50% more expensive than in
2021. Even with the rising costs of CO
2
emissions in 2022 – which
weigh proportionally on coal power much more due to higher CO
2
emission factors – the generation cost of coal-fired power plants in
Europe remained substantially below that of gas-fired plants.
Forward curves as of late January 2023 indicate that, despite
declining, both natural gas and coal prices remain well above their
pre-2021 historical averages through to 2025, at USD 15-20/MBtu
and USD 130-170/t, respectively. By 2025 generation costs from
gas are expected to decline and approach coal-fired generation cost
levels.
In Asia, estimated gas-based thermal generation costs in Japan
and Korea rose by 65% in 2022, to an average of USD 135/MWh.
Coal-based thermal generation costs increased by more than 70%
to over USD 100/MWh. The steep drop in Russian piped gas
supply to the European Union was largely offset by LNG, driving
up competition between Asian and European buyers. This put
strong upward pressure on Asian spot LNG prices, which
averaged an all-time high of USD 30/MBtu in 2022. Oil-indexed
LNG prices displayed less volatility, averaging about
USD 15/MBtu. High spot LNG prices and flood-induced supply
outages in Australia also drove Newcastle coal prices to peak
levels, to an average of USD 360/t.
Forward curves as of late January 2023 indicate that spot LNG and
thermal coal prices are expected to remain elevated, putting
upwards pressure on thermal generation costs out to 2025. Despite
this, the thermal generation costs in Korea and Japan would be
roughly half that of Europe in 2025 according to the forward prices.
In the United States, the cost of gas supplied to power plants
increased substantially, by more than 50% y-o-y, driving up the cost
of gas-fired generation by a similar magnitude in 2022. This was
driven by a number of factors: supply constraints and low inventory
levels elevated thermal coal prices; the Central Appalachia
benchmark averaged USD 170/t – its highest level since 2010;
reduced availability of thermal coal increased the call on gas-fired
power plants; and higher gas burn in the power sector, together with
below-average gas storage levels and rising LNG exports, tightened
gas market fundamentals. As a result, Henry Hub prices rose by
more than 60% y-o-y, to an average of USD 6.50/MBtu in 2022.
Tight market conditions are expected to linger into the medium term
based on forward curves at the start of January 2023 that show
natural gas and coal prices remaining above their historical
averages, at USD 3-5/MBtu and USD 110-150/t, respectively, in
2023-2025. The generation cost gap between electricity generation
from coal and gas narrows based on the forward prices.

Electricity Market Report 2023
P
AGE | 30
IEA. CC BY 4.0.
Global overview
Large regional differences in thermal generation costs by 2025, with Europe about twice as high
as Asia
Generation costs of coal- and gas-fired power plants including emission costs, 2019-2025
IEA. All rights reserved.
Notes: Coal range reflects 33-45% efficiency; gas range reflects 43-55% efficiency. Due to the large geographic areas covered in each region, costs can differ between and within
countries and should therefore be interpreted as general trends. In the United States, natural gas prices increased significantly (exceeding USD 15/MBtu) in February 2021 due to
supply constraints. 2023-2025 costs for the regions are based on forward prices of fuels as of end of January 2023 and should not be interpreted as forecasts, rather as costs reflecting
the current market expectations. Fuel price assumptions for the model forecasts presented in this report are based on average forward prices.
Sources: United States: based on EIA (2023), STEO January 2023
. European Union: natural gas prices TTF; coal prices CIF ARA; emission costs EU ETS. Japan and Korea: natural
gas prices reflect estimated LNG import prices, including via oil-indexed LNG contracts and spot procurements; coal prices are Japan marker prices. Latest update: 31 January 2023.
0
100
200
300
400
500
600
2019
2020
2021
2022
2023
2024
2025
USD/MWhₑₗ
European Union
Gas Coal
0
100
200
300
400
500
600
2019
2020
2021
2022
2023
2024
2025
USD/MWhₑₗ
Japan and Korea
Gas Coal
0
100
200
300
400
500
600
2019
2020
2021
2022
2023
2024
2025
USD/MWhₑₗ
United States
Gas
Coal

Electricity Market Report 2023
P
AGE | 31
IEA. CC BY 4.0.
Global overview
Emissions
Electricity Market Report 2023
P
AGE | 32
IEA. CC BY 4.0.
Global overview
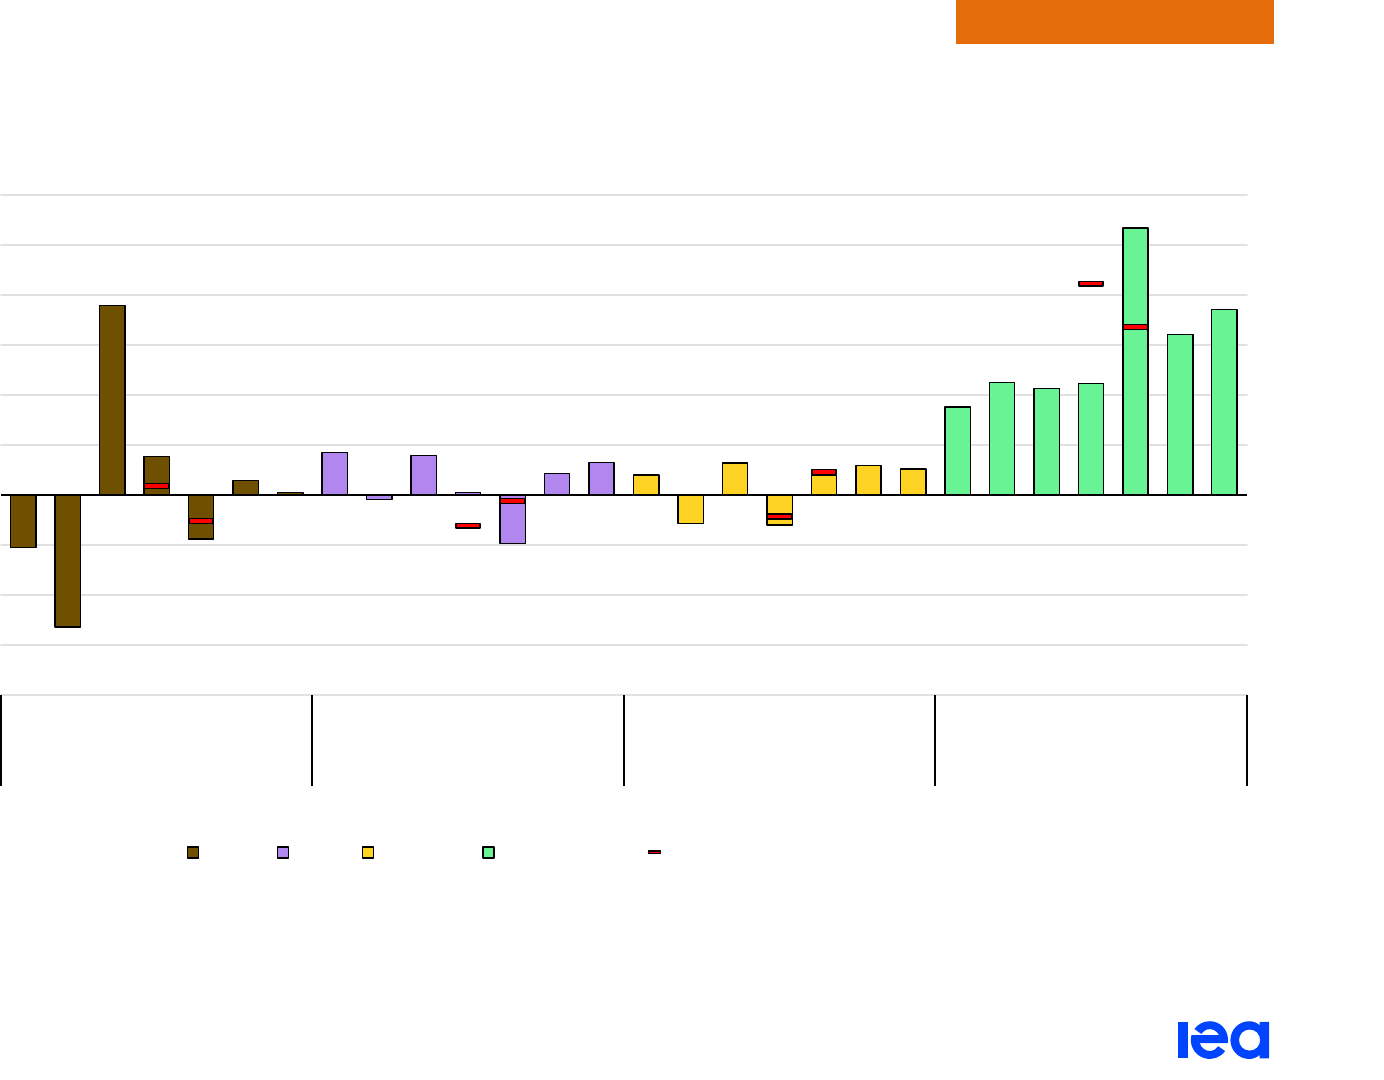
The world reached a new all-time high in power generation-related emissions in 2022
We estimate that the world reached a new all-time high of about
13.2 Gt CO
2
in power sector emissions in 2022, a year-on-year
increase of 1.3%. Record-level emissions in 2022 were mainly due
to growth in fossil-fired generation in Asia Pacific. Europe and
Eurasia also contributed to this increase. Similar to what was
highlighted in the IEA’s World Energy Outlook 2022
f
or the overall
energy sector, the rise in power sector emissions in 2022 was still
less than the y-o-y change in 2021 related to the post-pandemic
rebound.
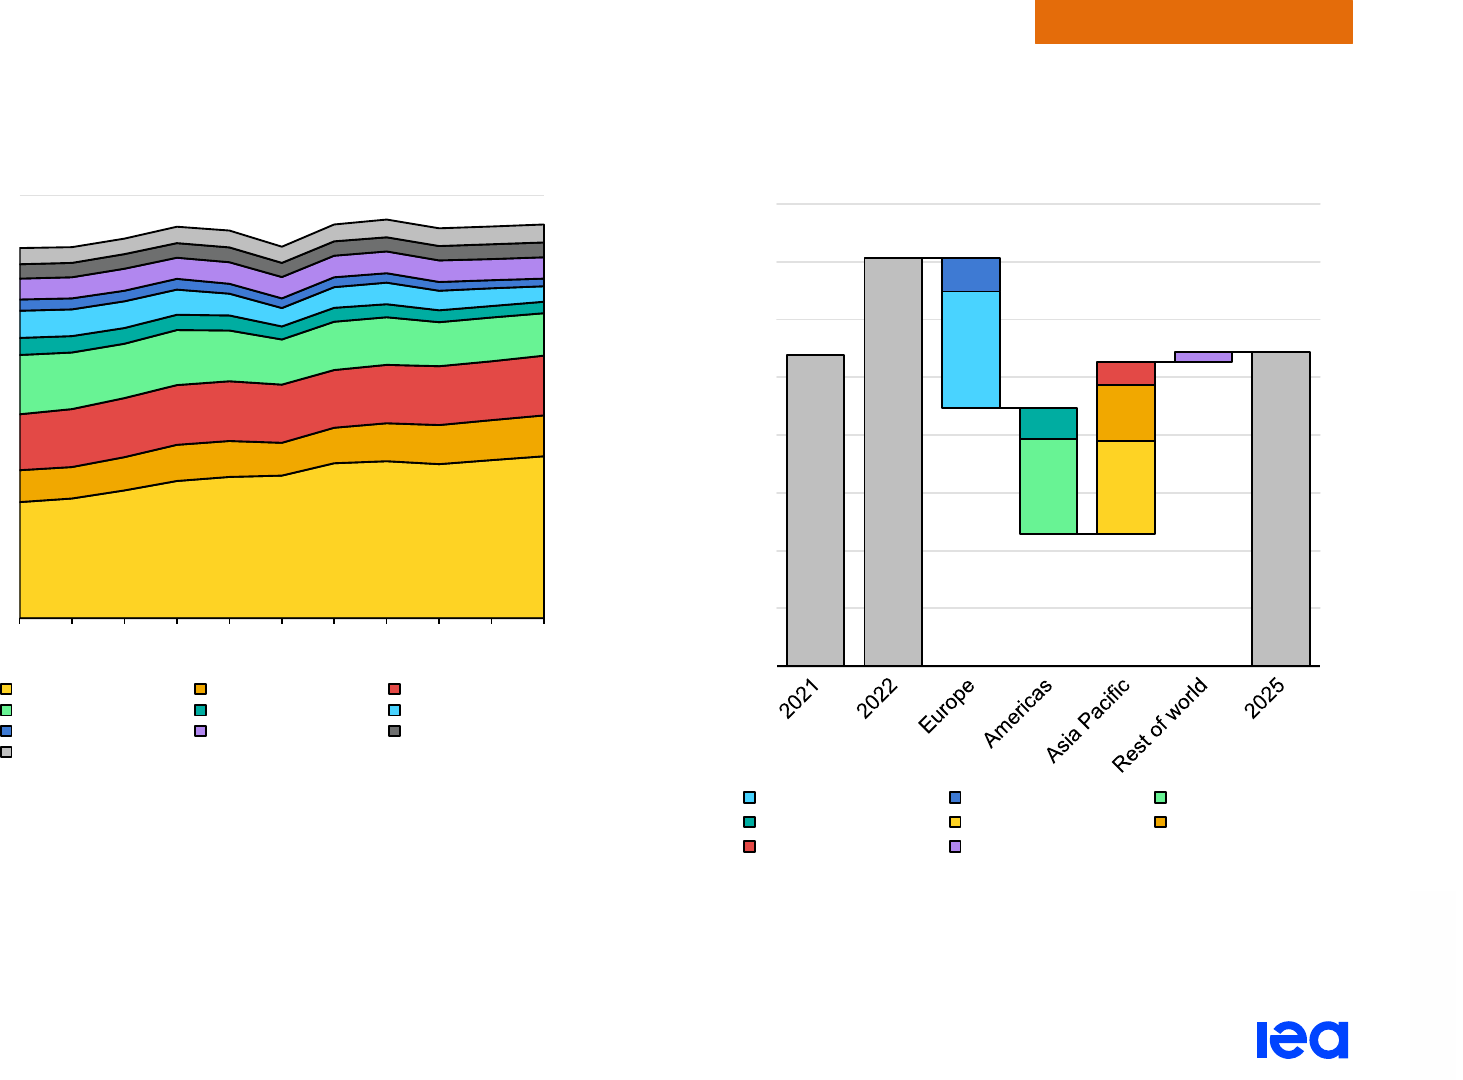
After a projected decline i
n global electricity generation CO
2
emissions in 2023 due to lower gas- and oil-fired generation, we
forecast that emissions will plateau out to 2025. In the 2023-2025
period, lower emissions in regions such as Europe and the
Americas (each down roughly 70 Mt/yr on average) partly offset the
significant increases in Asia Pacific (up 100 Mt/yr on average),
mostly attributed to China and India. By 2025, the Asia Pacific
region will account for 67% of global power sector emissions (up
from 64% in 2022). Trends from other regions show mild growth or
remain flat.
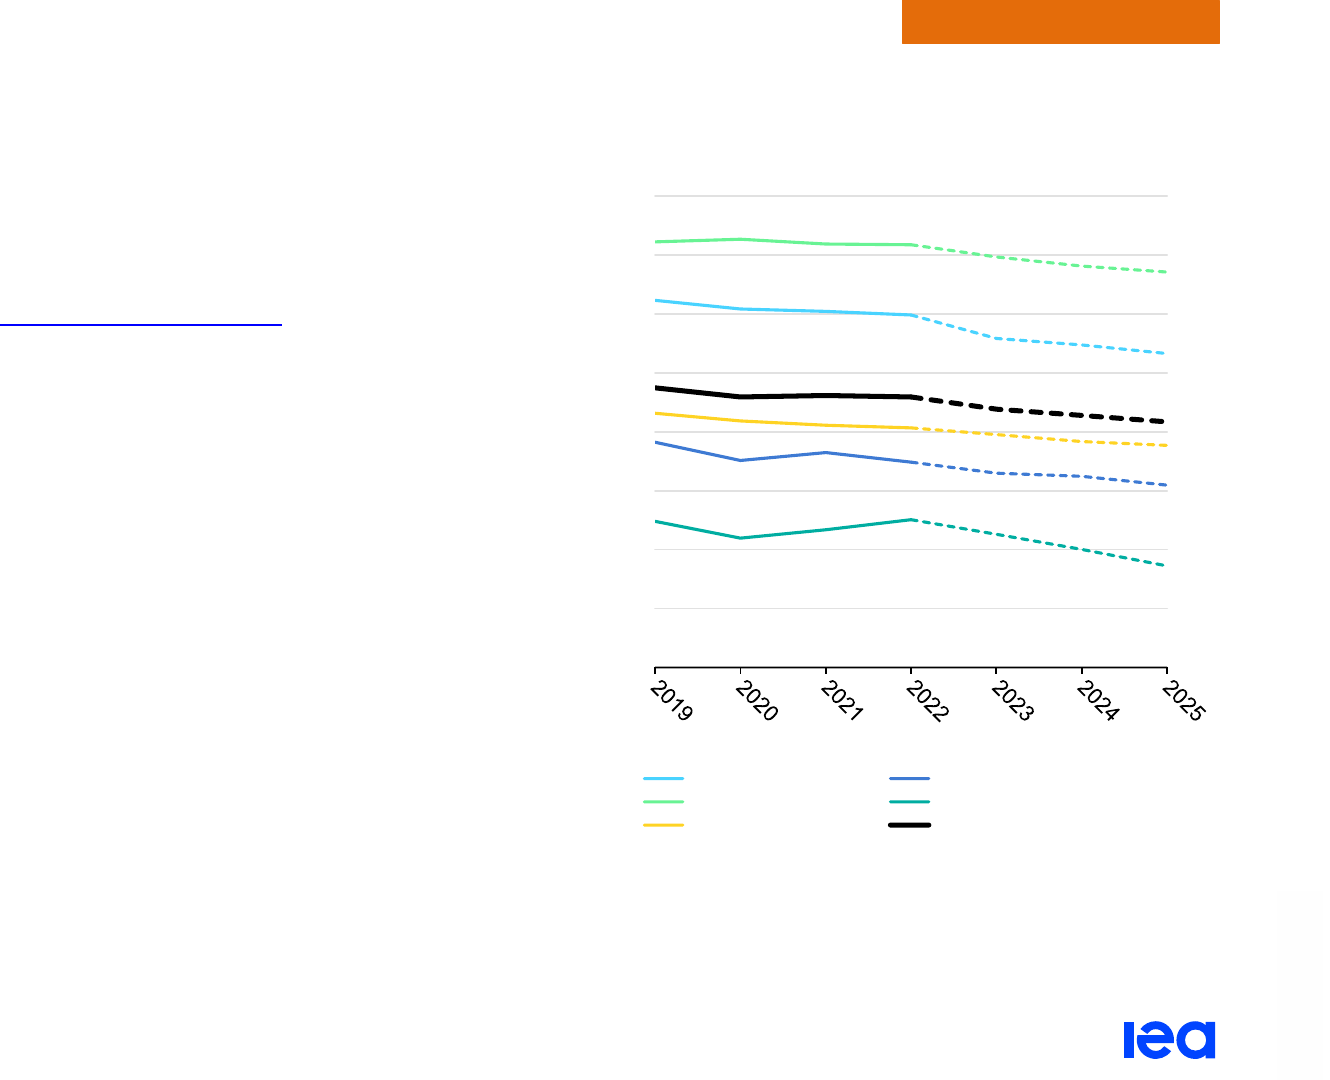
In 2025, CO
2
intensity of global power generation would reach
417 g CO
2
/kWh, a decline of 3% on average each year to 2025.
The average annual rate of decline from 2023 to 2025 is markedly
steeper in Europe (-12%) and the United States (-4%).
Regional evolution of power system CO
2
intensity, 2019-2025
IEA. CC BY 4.0.
Note: The CO
2
intensity is calculated as total CO
2
emissions divided by total
generation.
0
100
200
300
400
500
600
700
800
g CO
₂
/kWh
China
United States
India European Union
Others World
Electricity Market Report 2023
P
AGE | 33
IEA. CC BY 4.0.
Global overview
Global emissions of power generation are expected to plateau from 2023 through 2025
Global emissions of power generation, 2015-2025
IEA. CC BY 4.0
Changes in global emissions of power generation, 2021-2025
IEA. CC BY 4.0.
0
2 000
4 000
6 000
8 000
10 000
12 000
14 000
2015 2017 2019 2021 2023 2025
Mt CO
2
China India
Other Asia Pacific
United States Other Americas EU
Other Europe Middle East
Africa
Eurasia
-202
-58
-166
-53
+161
+98
+40
+16
12 500
12 600
12 700
12 800
12 900
13 000
13 100
13 200
13 300
Mt CO
2
European Union Other Europe United States
Other Americas China India
Other Asia Pacific Rest of world

Electricity Market Report 2023
P
AGE | 34
IEA. CC BY 4.0.
Global overview
Wholesale prices

Electricity Market Report 2023
P
AGE | 35
IEA. CC BY 4.0.
Global overview
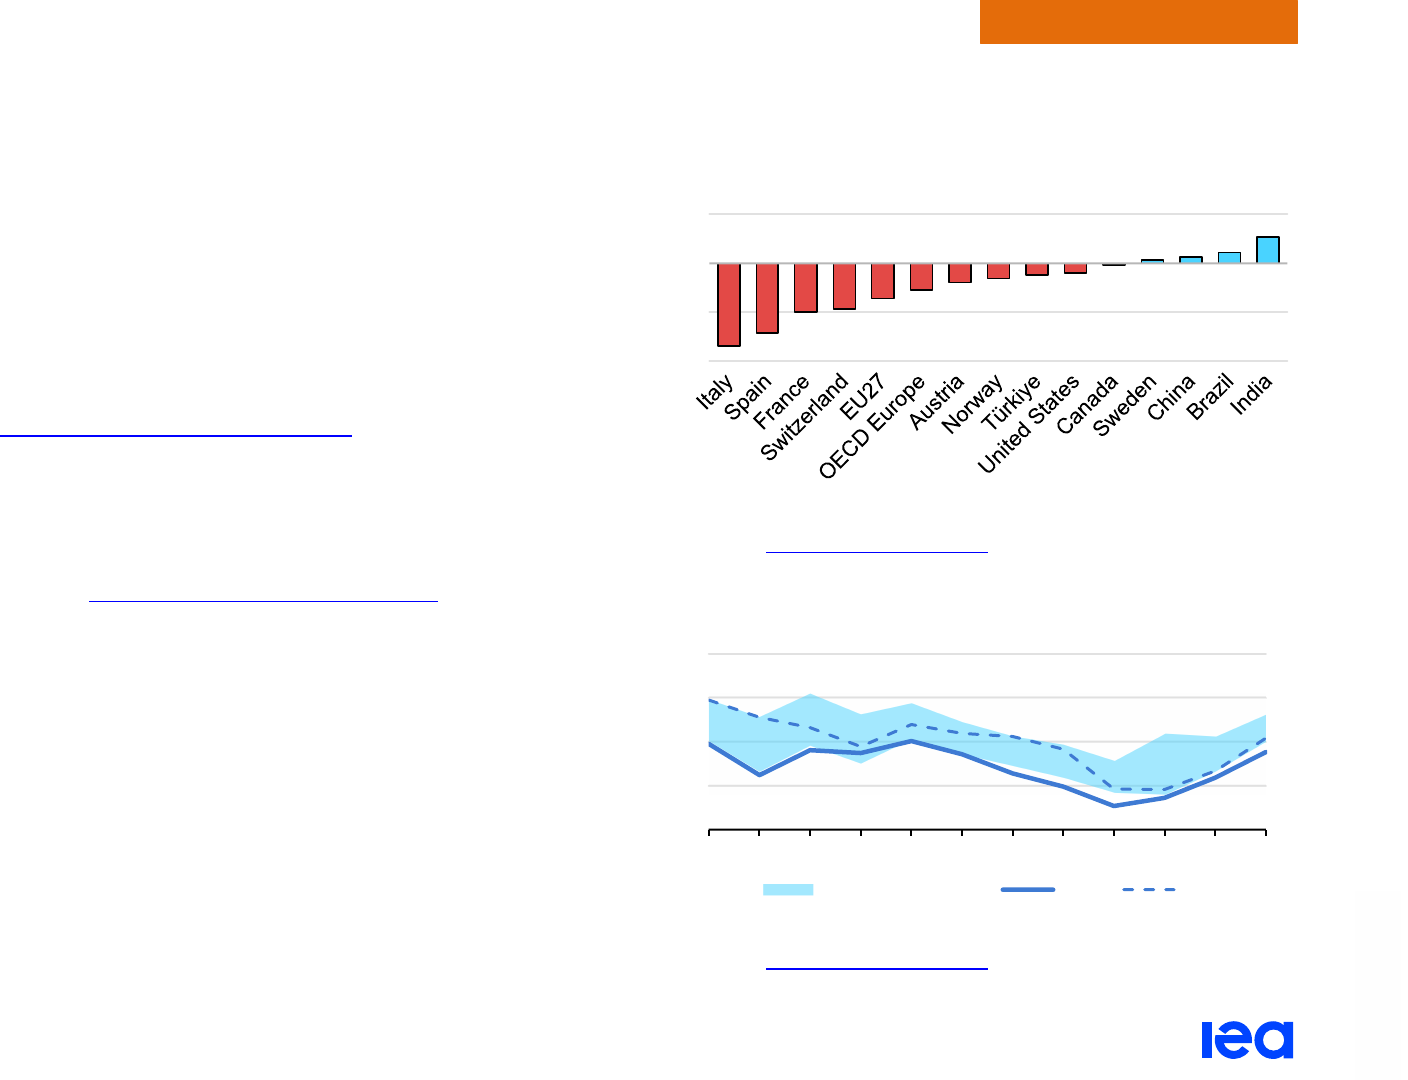
Electricity prices remain elevated in many regions, led by the high cost of energy commodities
The global energy crisis, with soaring prices of energy commodities
combined with the pandemic rebound and supply chain issues, has
resulted in substantially higher wholesale electricity prices in many
regions of the world in 2022 over year-ago levels.
In a large number of European countries, wholesale electricity
prices (i.e. day-ahead spot prices) in H2 2022 exceeded the
second-half average prices between 2019 and 2021, e.g. fourfold in
France. In H2 2022, the average wholesale price reached almost
EUR 330/MWh in Germany and surpassed EUR 320/MWh in
France, exacerbated by nuclear unavailabilities. By contrast, in
Spain, average prices were much lower for the same time period at
about EUR 130/MWh due to the Iberian price cap. The demand-
weighted average price for Germany, France, Spain and the United
Kingdom in H2 2022 was almost four times as high as the
H2 2019-2021 average.
The elevated futures prices in Europe for winter 2023/24 reflect the
continued uncertainties associated with gas supply for Europe.
Futures with delivery in Q4 2023 are EUR 227/MWh in France and
EUR 184/MWh in Germany while those for Q1 2024 are
EUR 258/MWh in France and EUR 186/MWh in Germany.
On the Nord Pool power exchange, average wholesale electricity
prices remained at unprecedented high levels in H2 2022,
exceeding EUR 150/MWh. Low hydro availability in the Nordics and
increased cross-zonal demand pushed prices up by almost 90%
year-on-year, yet they remained below European averages.
In the United States, the average wholesale price in H2 2022 stood
at about USD 91/MWh, more than twice the 2019-2021 second-half
average, and 65% higher than the price in H2 2021. This increase
was driven by exceptionally high gas prices.
Japanese wholesale prices in H2 2022 averaged almost
YEN 22 000/MWh (EUR 155/MWh), three times higher compared to
H2 2021 because of the tight supply situation. The increased prices
of fossil fuels also affected Japan because of its
low energy self-
sufficiency ratio. However, the majority of the imported LNG
volumes is contracted under oil-indexed long-term contracts which
alleviated some of the effects of soaring spot prices.
In 2022, Australian w
holesale prices averaged AUD 170/MWh
(Australian dollars; EUR 110/MWh), more than double the H2 2021
levels. This was due to surging electricity demand and gas prices
.
In India, despite increased coal stocks, higher electricity
consumption resulted in a 10% price rise in H2 2022 over the
H2 2021 level. The average wholesale price in H2 2022 was
INR 5 000/MWh (Indian rupees; EUR 55/MWh). Strong growth of
solar PV
helped to meet peak loads dr
iven by higher refrigeration
and space cooling.
Electricity Market Report 2023
P
AGE | 36
IEA. CC BY 4.0.
Global overview
Elevated futures prices in Europe reflect risks of tight supply in the winter of 2023/24
Indexed quarterly average wholesale prices for selected regions, 2019-2024
IEA. All rights reserved.
Notes: The European Index is calculated as the demand-weighted average of the prices for the European countries included in the analysis. For the Nordics region, the Nord Pool
system price is used for the historical prices and EEX Nordics futures are used for forward prices. The prices for Australia and the United States are calculated as the demand-
weighted average of the available prices of their regional markets. Continuous lines show historical data and dashed lines refer to forward prices. Price estimates for Q1 2023 and
beyond are based on the historical prices and the latest forward baseload electricity prices, except for the United States, where we use EIA (2023) values. The forward prices for Japan
are volume-weighted estimates of the latest JPX settlement prices, considering the baseload contracts (areas B1 and B3).
Sources: IEA analysis using data from RTE (France) and Red Eléctrica (Spain) – both accessed via the ENTSO-E Transparency Platform; Bundesnetzagentur (2023), SMARD.de;
Elexon (2023), Electricity data summary; AEMO (2023), Aggregated price and demand data; EIA (2023), Short-Term Energy Outlook January 2023; Nord Pool (2023), Market Data;
IEX (2023), Area Prices; EEX (2023), Power Futures; JPX (2023), Daily Data (Electricity Futures); ASX (2023), Electricity Futures © ASX Limited ABN 98 008 624 691 (ASX) 2020. All
rights reserved. This material is reproduced with the permission of ASX. This material should not be reproduced, stored in a retrieval system or transmitted in any form whether in
whole or in part without the prior written permission of ASX. Latest update: 31 January 2023.
0
250
500
750
1 000
1 250
Q1 Q2 Q3 Q4 Q1 Q2 Q3 Q4 Q1 Q2 Q3
Q4
Q1 Q2 Q3 Q4 Q1 Q2
Q3
Q4 Q1 Q2 Q3 Q4
2019 2020 2021 2022 2023 2024
Indexed electricity price (Q1 2019 = 100)
Germany France United Kingdom Spain United States
Japan Australia Nordics India European Index
Electricity Market Report 2023
IEA. CC BY 4.0.
Global overview
Electricity markets were impacted differently across the world – Europe being hit the hardest
Annual wholesale prices in selected countries, 2022 and 2017-2021 average
IEA. All rights reserved.
Notes: Avg refers to an average of the years from 2017 to 2021. The annual averages are calculated from the daily wholesale electricity prices.
Source: IEA analysis using data from RTE (France) and Red Eléctrica (Spain) – both accessed via the ENTSO-E Transparency Platform; Bundesnetzagentur (2023), SMARD.de
;
Elexon (2023), Electricity data summary; AEMO (2023), Aggregated price and demand data; EIA (2023), Short-Term Energy Outlook January 2023; Nord Pool (2023), Market Data;
IEX (2023), Area Prices. Latest update: 31 January 2023.
P
AGE | 37
0
100
200
300
400
avg 2022 avg 2022 avg 2022 avg 2022 avg 2022 avg 2022 avg 2022 avg 2022 avg 2022 avg 2022
Italy France Germany United
Kingdom
Spain Japan Norway Australia India United
States
USD/MWh

Electricity Market Report 2023
P
AGE | 38
IEA. CC BY 4.0.
Global overview
Carbon pricing trends
Electricity Market Report 2023
P
AGE | 39
IEA. CC BY 4.0.
Global overview
Status and trends of carbon pricing mechanisms in 2022
Carbon pricing is a key instrument to mitigate emissions, incentivise
investments in low-carbon technologies and reduce demand for
greenhouse gas (GHG)-intensive activities. Such policy instruments
usually take the form of a carbon tax, an Emission Trading System
(ETS) or a hybrid of the two. Due to the ongoing energy crisis, carbon
pricing policies have entered uncharted territory, and are facing new
challenges hindering their effectiveness. While the EU’s carbon price
influences the variable generation cost, and hence the merit-order of
the power plants, carbon pricing is currently unable to perform its
traditional role of incentivising a coal-to-gas switch in electricity
production given exceptionally high gas prices. Nevertheless, carbon
pricing still has a crucial role to play in maintaining a long-term
investment signal and making carbon-intensive fossil generation
such as coal-fired electricity an economically unattractive solution. In
addition, it can be a useful instrument to generate additional revenue
for governments to support faster clean energy transitions, and
mitigate social and competitiveness impacts.
As of April 2022, 68 carbon pricing initiatives
we
re in place
worldwide, covering over 23% of GHG emissions, with the majority in
the form of an ETS. Many of them saw carbon price increases
compared to 2021. The price of allowances in the EU ETS, the most
established ETS globally, rose from an average of USD 50/t CO
2
-eq
to more than USD 90/t CO
2
-eq for January to April 2022. Prices in
the UK ETS rose to more than USD 100/t CO
2
-eq, and doubled in the
New Zealand ETS (USD 50/t CO
2
-eq) and in state-level systems in
the United States. Allowance prices in Korea (USD 19/t CO
2
-eq) and
China’s national ETS (USD 9/t CO
2
-eq) increased only slightly.
Despite these increases, less than 10% of global emissions are
covered by a carbon price that is higher than USD 10/t CO
2
-eq. In
some jurisdictions in 2022, carbon pricing instruments have had
difficulty incentivising a fuel switch to lower-carbon sources due to
high natural gas prices. For example, EU coal-fired generation rose
by 6% in 2022.
Price evolution of selected carbon pricing instruments (as of
April 2022, annual average levels)
IEA. All rights reserved.
*The EU ETS operates in all EU countries, Iceland, Liechtenstein and Norway.
Notes: The year-on-year increase compares the 2021 full-year averages versus the
2022 January-April averages.
Sources: World Bank Carbon Pricing Dashboard, ICAP, and Ember.
0%
20%
40%
60%
80%
100%
120%
China
EU ETS*
Korea
New Zealand
United Kingdom
California
Québec
South Africa
ETS Carbon
tax
Year-on-year increase in carbon
price (2021-2022)
Electricity Market Report 2023
P
AGE | 40
IEA. CC BY 4.0.
Global overview
Share of global GHG emissions covered by a carbon price, by
price level, 2012-2022
IEA. All rights reserved.
Source: World Bank (2022), Carbon Pricing Dashboard, 15 November 2022.
Increases in carbon prices and coverage have led to a new record
of revenues raised by these instruments, reaching
USD 140 bi
llion
in 2021, with ETS revenues more than doubling within a year
(USD 26 billion to USD 56 billion). Schemes differ in the use of their
revenues. California’s Cap-and-Trade, for example, returns the
majority of revenues to power companies and, ultimately, electricity
consumers, while another part is used for carbon mitigation
1
Least Developed Countries is a UN classification for “low-income countries confronting severe
structural impediments to sustainable development”.
programmes through its Greenhouse Gas Reduction Fund. This
notably includes programmes on renewable energy integration
towards low-income households.
China's national ETS, introduced in 2021 and covering the power
s
ector only, is the biggest carbon market, and accounts for about
9% of global GHG emissions. The introduction of partial auctioning
of allowances – instead of free allowance allocation – in the power
sector as well as expansion to industry are currently being
considered. Japan’s GX League
, composed of over 500 companies,
has started pilot trading in its voluntary carbon market, with official
trading starting in April 2023. This includes major participants in the
electricity, gas and heat and water sectors, such as TEPCO,
Kanden and Chuden. India also recently
adopted a carbon market
framework legislation, envisioning the construction of a national
carbon market.
Electricity projects are also being affected by rules decided in
v
oluntary carbon markets. Most notably, since 2020 the two biggest
carbon credits standards issuers, Gold Standard and Verra
, decided
to no longer register new renewable projects, except for those
located in Least Developed Countries
1
. This is because large-scale
renewable electricity projects are already cost-effective, not
requiring further support from carbon markets.
0%
10%
20%
30%
40%
50%
60%
70%
80%
90%
100%
2012 2014 2016 2018 2020 2022
Share of global GHG emissions
(%)
More than USD 50
USD 30 - 50
USD 10 - 30
Less than USD 10
No carbon price

Electricity Market Report 2023
P
AGE | 41
IEA. CC BY 4.0.
Regional perspectives
Regional perspectives

Electricity Market Report 2023
P
AGE | 42
Regional perspectives
IEA. CC BY 4.0.
Asia Pacific

Electricity Market Report 2023
P
AGE | 43
Regional perspectives
IEA. CC BY 4.0.
Asia Pacific’s major generation source remains coal, but low-carbon sources are catching on
Electricity demand grew by an estimated 3.3% in 2022 in the Asia
Pacific region, led by a strong rise in India (8.4%) that was partially
offset by subdued growth in China (2.6%) due to the slowdown in the
economy stemming from its zero-Covid policy. Demand in the two
countries represented about 70% of the region’s total electricity use
of 13 500 TWh, which accounts for approximately 50% of global
consumption. More than half of the increase in 2022 was met by
renewables, of this renewable output almost 60% was from China.
The majority (57%) of the region’s electricity was generated by coal
in 2022, with low-carbon sources, such as nuclear and renewables,
contributing to 32% of the mix. As a result of its strong reliance on
coal for power, Asia Pacific has the highest electricity generation CO
2
intensity of our analysed regions, at 590 g CO
2
/kWh in 2022,
compared to a global average of 460 g CO
2
/kWh.
Power systems in several countries came under severe pressure
during 2022, due to both sharply elevated global energy prices and
extreme weather events, highlighting the critical need for electricity
security. China experienced its longest heatwave in decades
,
worsening drought conditions that left the Yangtze river at record-low
water levels. South Asia was similarly affected, with heatwaves in
India starting exceptionally early in the spring and the worst recorded
in 122 years. These extreme weather events led to record-breaking
electricity demand for cooling, which was compounded by a fall in
hydropower generation and coal supply shortages. In Japan, the
government issued a
power shortage warning f
or the first time ever,
calling for reduced electricity consumption as very low temperatures
and a
7.4 magnitude earthquake i
n March 2022 put the power
system at risk of not being able to meet demand. Similar calls to
reduce power use amid tight supply were made in Thailand, a gas-
dependent country sensitive to high prices.
The convergence of weather events and record-br
eaking gas prices
led to higher coal use in electricity generation for the Asia Pacific
region in 2022 (+2.5% on 2021 levels), but going forward its share in
the mix will decline. Coal power is expected to fall to 52% in the
electricity mix in 2025, with the share of low-carbon sources rising to
38%, driven mainly by strong y-o-y growth of almost 12% annually in
renewable electricity generation, which will raise its share in the mix
from 26% in 2022 to 32% in 2025. The share of gas-fired generation
will decrease slightly from 10% in 2022 to reach 9% in 2025. Steady
growth in electricity consumption on average of 4.6% every year is
forecast in the next three years, with renewables meeting almost two-
thirds of that additional demand.
The higher share of renewables in the mix will help reduce the
average CO
2
intensity in the region to 535 g CO
2
/kWh in 2025.
However, CO
2
emissions from power generation will continue to rise
by an average 1.2% per year to 2025, as coal-fired generation,
despite having a diminishing share in the generation mix, remains the
main fuel in the region and grows on average 1.3% per year. In
2025, the CO
2
intensity of the Asia Pacific region remains the
highest globally.
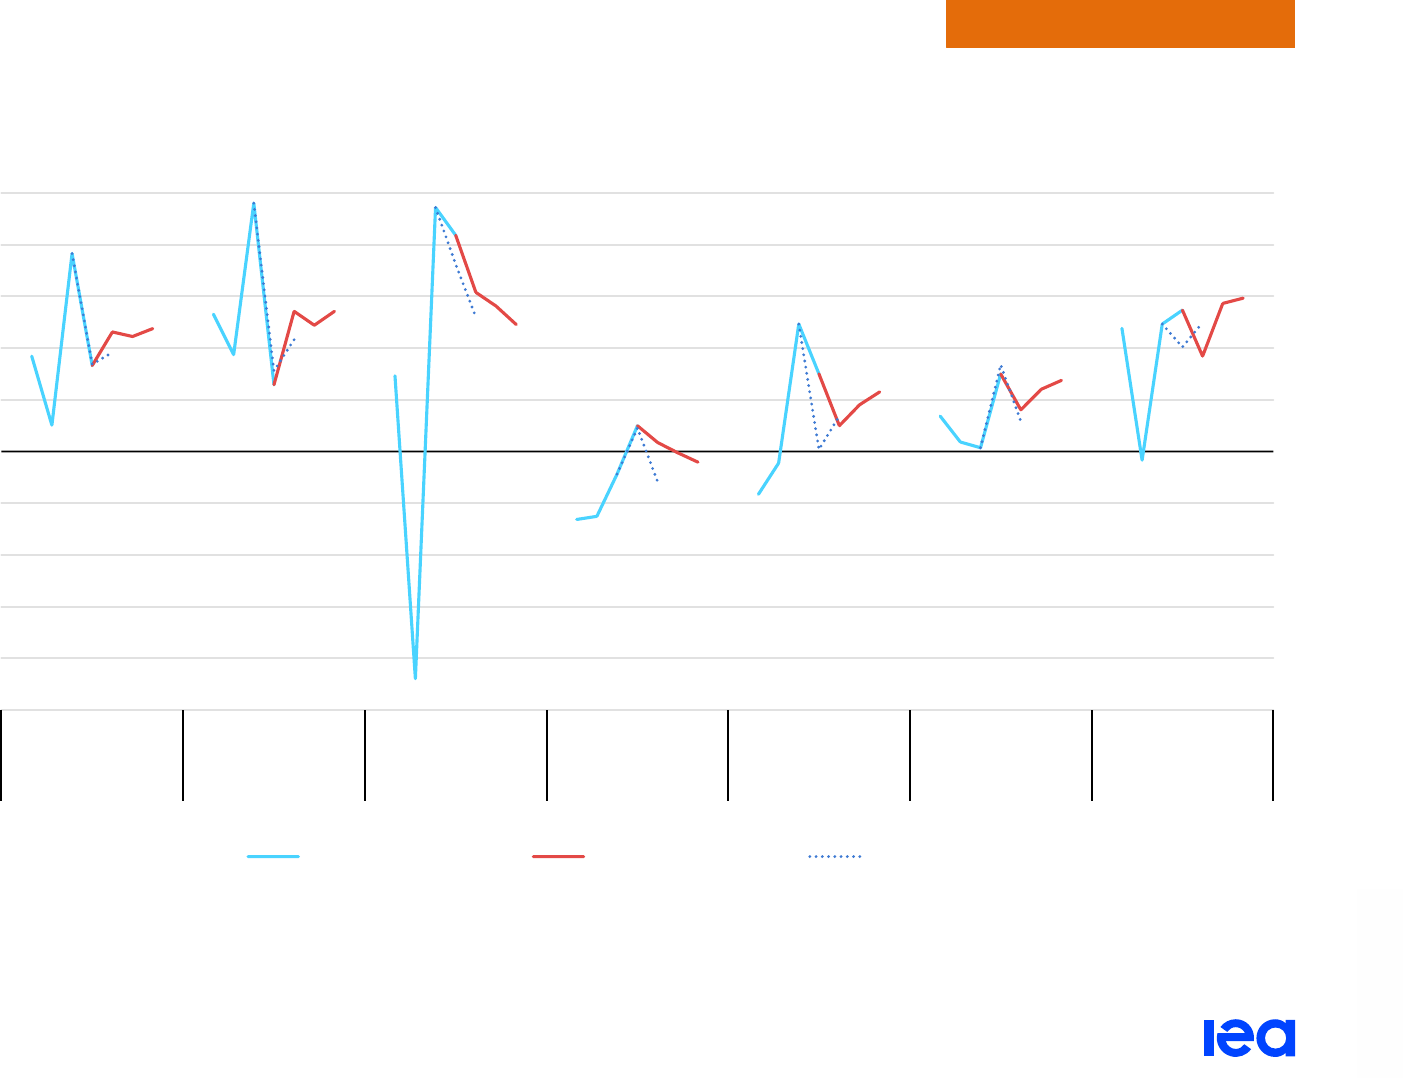
Electricity Market Report 2023
P
AGE | 44
Regional perspectives
IEA. CC BY 4.0.
Amid post-pandemic economic recovery, Asia Pacific demand sees sustained growth to 2025
Year-on-year relative change in electricity demand, Asia Pacific, 2019-2025
IEA. CC BY 4.0.
-10%
-8%
-6%
-4%
-2%
0%
2%
4%
6%
8%
10%
2019
2021
2023
2025
2019
2021
2023
2025
2019
2021
2023
2025
2019
2021
2023
2025
2019
2021
2023
2025
2019
2021
2023
2025
2019
2021
2023
2025
Asia Pacific China India Japan Korea Australia Southeast Asia
Electricity demand growth
Historical demand Updated forecast Previous forecast (July 2022)
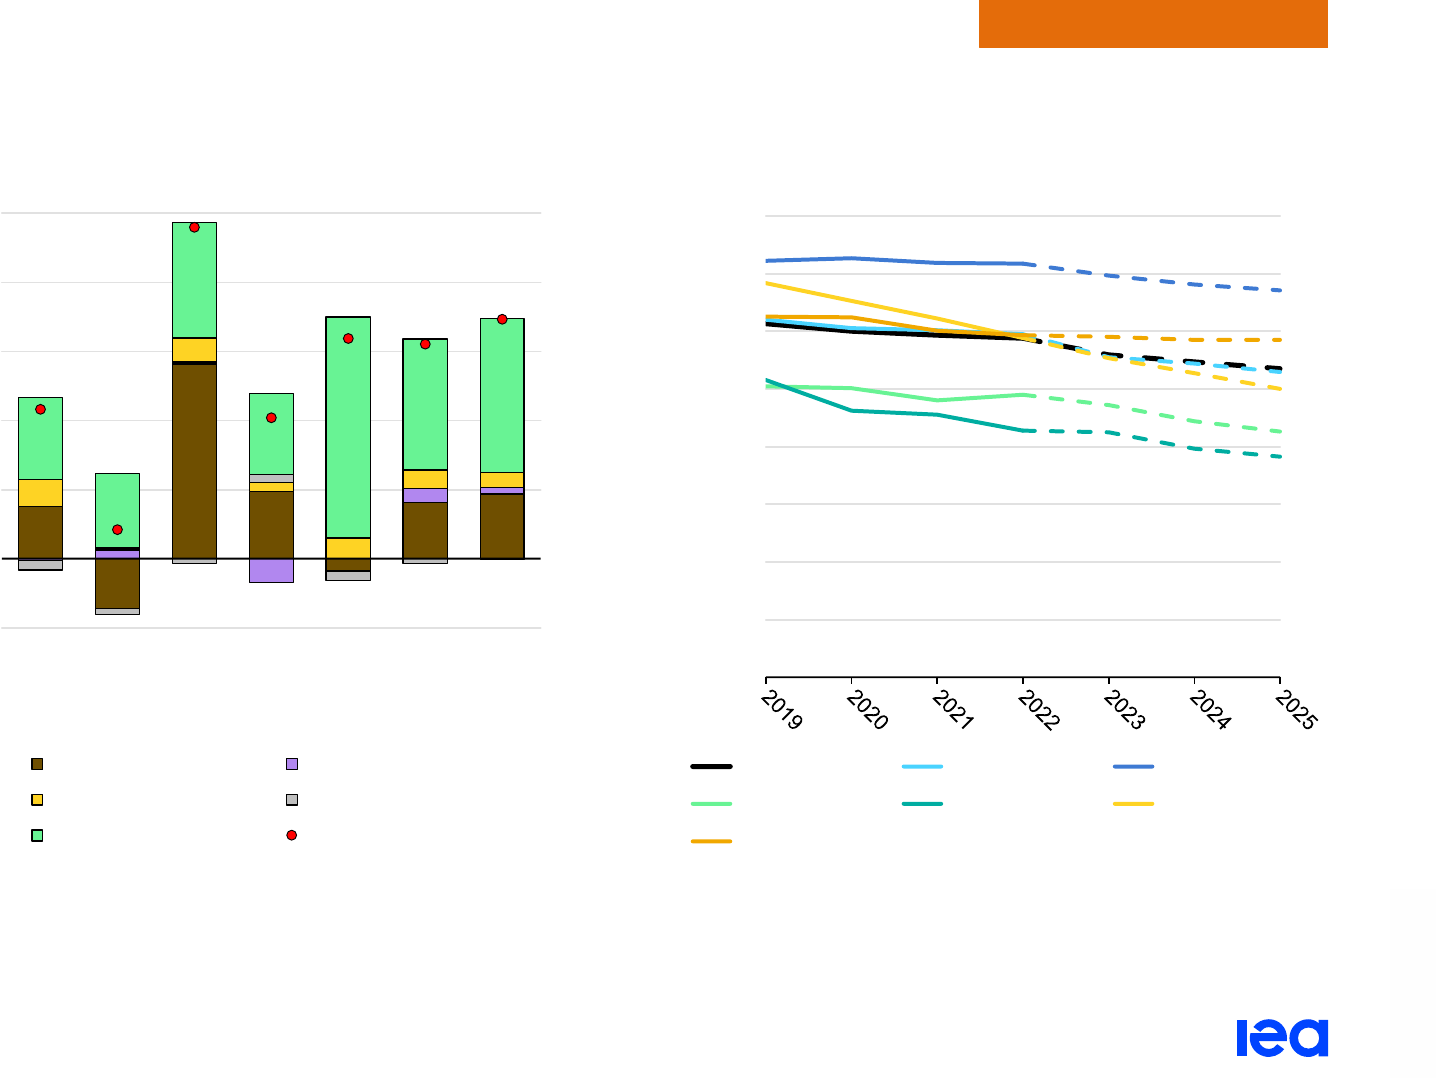
Electricity Market Report 2023
P
AGE | 45
Regional perspectives
IEA. CC BY 4.0.
Carbon dioxide intensity falls as most of the additional demand is met by low-carbon electricity
Year-on-year change in electricity generation, Asia Pacific,
2019-2025
IEA. CC BY 4.0
Development of average CO
2
intensity, Asia Pacific, 2019-2025
IEA. CC BY 4.0.
Note: Other non-renewables includes oil, waste and other non-renewable energy sources. The CO
2
intensity is calculated as total CO
2
emissions divided by total generation.
- 200
0
200
400
600
800
1 000
2019
2020
2021
2022
2023
2024
2025
TWh
Coal Gas
Nuclear Other non-renewables
Renewables Net change
0
100
200
300
400
500
600
700
800
g CO₂/kWh
Asia Pacific China India
Japan Korea Australia
Southeast Asia

Electricity Market Report 2023
P
AGE | 46
Regional perspectives
IEA. CC BY 4.0.
China
Electricity demand growth slowed in 2022 as the zero-
Covid policy weighed heavily on economic activity
Under pressure from the large-scale lockdowns affecting the
economy, electricity demand growth in China slowed to an
estimated 2.6% y-o-y in 2022 (significantly below pre-pandemic
rates). With industrial electricity consumption growth subdued, the
increase was mainly driven by residential sector demand.
China’s decision to ease severe pandemic restrictions on
7 December has paved the way for a recovery in its economy, and,
in tandem, a rebound in electricity growth from 2022 lows. Between
2023 and 2025, demand growth is forecast to grow by 5.2% per
year on average, led by continued electrification across the energy
sector, especially in buildings and transport. Nonetheless, our
forecast is slightly below the pre-pandemic trend of 5.4% in
2015-2019. Uncertainty remains around the pace of China’s
economic recovery, which could affect our forecast.
China’s historic heatwave hit the central and eastern regions of the
country from June to August 2022, which led to surging demand for
air conditioning. Sichuan province, which produces
30% of China’s
hydroelectricity, faced power outages during several weeks as its
generation fell by half due to drought conditions and unusually low
rainfall during what is normally Sichuan's rainy season.
Inflexible long-term contracts worsened the situation, with exports
continuing to eastern provinces, despite local shortages. China’s
power supply is likely to remain tight during winter 2022/23 as the
drought left Sichuan’s main reservoirs 77% lower at the end of
August 2022 than at the same time in 2021.
Renewables grow in parallel with coal as policy
prioritises electricity security
The reintroduction of an energy security narrative that followed the
2021 power crunch, as well as the “dual carbon” policy goals
(carbon peaking before 2030 and carbon neutrality before 2060),
imply that coal will possibly expand alongside renewable energy in
the short- to medium-term horizon.
Coal remains the backbone of the Chinese electrici
ty system,
representing over 62% of the power generation in 2022, even
though the share of renewables (30%) has increased. Hydropower
accounts for half of the renewable electricity generation, followed
by wind (29%) and solar PV (15%). While coal-fired supply
increased over the summer to make up for weak hydro output, its
average growth in 2022 compared to 2021 remained modest
(+1.5%), with renewables covering about 60% of the rise in
electricity demand.

Electricity Market Report 2023
P
AGE | 47
Regional perspectives
IEA. CC BY 4.0.
The share of gas in the generation mix was under 3% and is set to
stagnate in the coming years, as limited domestic production and
high global prices reduce its competitiveness compared to coal in
the power system.
We expect low-carbon energy to account for 41% of electricity
generation by 2025, thus exceeding the objective set at 39% in
China’s 14
th
Five-Year Plan, owing to the fast development of wind
and solar PV. Capacity additions of both technologies reached new
records in 2022, and we expect their cumulative capacity to exceed
1250 GW by 2025
, up from over 630 GW in 2021.
Distributed solar in particular is developing rapidly in eastern and
central provinces following a national pilot programme
l
aunched in
2021 to promote solar rooftop PV at the county level. Construction
of utility-scale wind and solar PV power plants is underway in
northern and western desert areas, with a
new batch of projects
announced in 2022.
In parallel, new coal-
fired plants continue to be added to the grid
(11 GW in 2022) and more permits granted (15 GW i
n H1 2022).
Energy security concerns, the willingness to accompany variable
renewable sources
with dispatchable power sources and l
ocal
economic interests are behind these additions. However, they raise
the risk of future under-utilised assets, considering the lack of
profitability of existing coal-fired plants and their declining utilisation
rate.
High coal prices could reduce coal power companies’ operations of
t
heir assets and slow investments in new ones. Fuel prices were
exceptionally high in 2022, regularly exceeding the level at which
thermal power plants can breakeven. Despite government efforts to
set price caps on thermal coal and deregulate coal-fired power
tariffs following the autumn 2021 power crunch
, more t
han half of
state-owned coal power companies have recorded deficits.
Power market reforms accelerate to support the
transformation towards a modern energy system
China is increasingly relying on markets to support its “dual carbon”
goals and transition towards a modern energy system
. Power
market reforms are moving forward with the issuance in early 2022
of high-level guidance to establish a
unified national electricity
market system, requiring full implementation by 2030. However,
interprovincial and short-term trading remain limited, with 80% of
the electricity being traded within provincial mid- and long-term
markets through auctioning. The new reforms are expected to
harmonise trading rules and technical standards across China to
hasten the integration of existing provincial and regional markets.
China’s southern region took the lead in August 2022 with the
launch of the trial operation of a unified regional power market in the
five provinces covered by China Southern Power Grid. The
development of spot power markets is also progressing, with
trading
and market supervision rules released in November 2022 for
consultation.

Electricity Market Report 2023
P
AGE | 48
Regional perspectives
IEA. CC BY 4.0.
Meanwhile, the regulator of the national carbon market is proposing
to tighten coal power plants’ emissions benchmarks f
or its second
compliance period running to the end of 2023 and covering
2021-2022 power sector emissions. This should strengthen the
system's stringency and help support carbon price signals, although
market liquidity could remain a challenge. The system's expansion
to industry sectors will only take place from 2023 at the earliest, and
uncertainties remain for the timeline on the development of carbon
derivatives and inclusion of non-compliance entities.
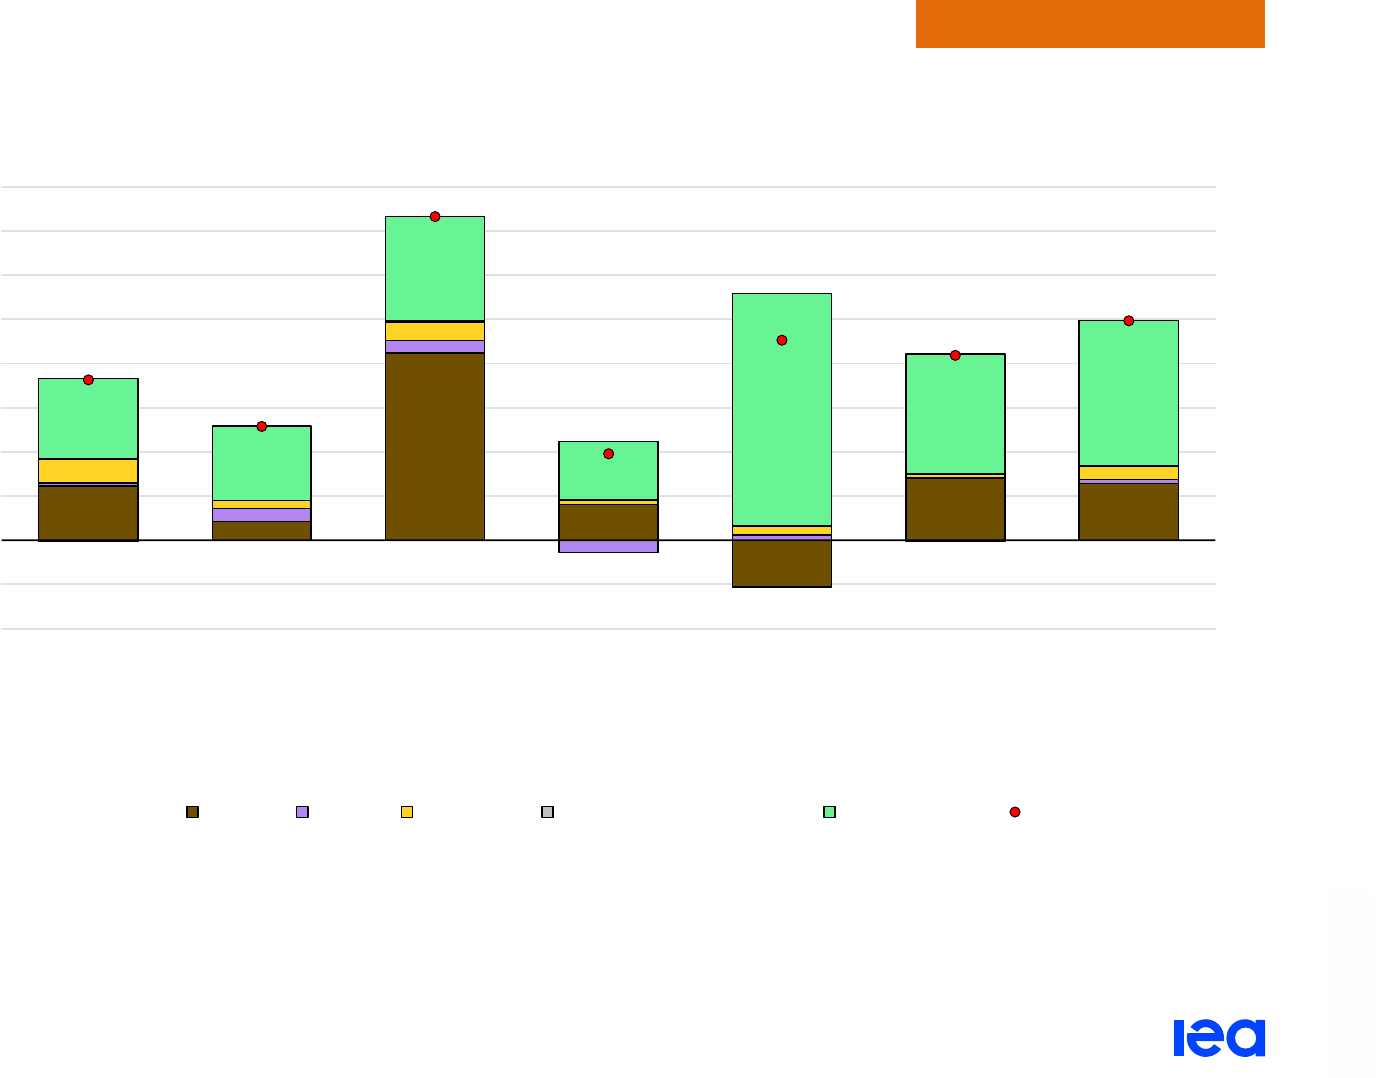
Electricity Market Report 2023
P
AGE | 49
Regional perspectives
IEA. CC BY 4.0.
Most of the Chinese demand growth out to 2025 is met by renewables, followed by coal
Year-on-year change in electricity generation in China, 2019-2025
IEA. CC BY 4.0.
Note: Other non-renewables includes oil, waste and other non-renewable energy sources.
- 200
- 100
0
100
200
300
400
500
600
700
800
2019
2020
2021
2022
2023
2024
2025
TWh
Coal Gas Nuclear Other non-renewables Renewables Net change

Electricity Market Report 2023
P
AGE | 50
Regional perspectives
IEA. CC BY 4.0.
India
Strong demand growth in 2022 led by record
heatwaves and economic recovery
Electricity demand in India grew strongly in 2022, by 8.4%, driven
by a combination of continued economic recovery after the
Covid-19 pandemic slowdown and peak summer temperatures. We
expect demand growth to continue at close to 5.6% on average per
year during 2023-2025.
India experienced extreme heatwaves in 2022. The hot season
arrived earlier than usual, resulting in the hottest March
in over a
century. Electricity demand from April to July was 14% higher than
the same period in 2021 and heatwaves led to a record peak power
demand of 211 GW on 10 June 2022.
The sharp growth in summer demand was primarily met by coal-
fired generation, which registered a significant year-on-year growth
of 21.3% in April-July 2022 from April-July 2021. Following from
this, India experienced coal supply shortages and the Ministry of
Power directed state generating companies and independent power
producers to meet a
10% blending requirem
ent, meaning that 10%
of their coal demand should be met by imported coal. This was
required to ensure adequate coal stocks before the onset of
monsoons. In August 2022, the
government withdrew these
blending requirements when adequate stock levels at power plants
were reached.
While retirement of coal power is lagging, measures are
being taken to accelerate renewable expansion
As of the end of 2022, India has an installed capacity of 410 GW, of
which 236 GW comes from fossil-fired power plants (coal, gas and
oil), 52 GW from hydro, 115 GW from renewable energy plants such
as solar PV and wind, and the rest from nuclear power plants. The
retirement of coal power plants has lagged over the years with
about 14 GW of
the capacity initially scheduled for closure over the
2017-2022 period still in operation and used for balancing purposes.
The government is t
aking actions to accelerate the deployment of
renewable energy capacity, in line with the target of 500 GW of
non-fossil capacity by 2030 announced in the updated Nationally
Determined Contributions. The government established a
plan for
the integration of this additional capacity within the transmission grid
that includes grid expansions and additional storage capacity.
Further, as per Central Electricity Authority (CEA), about 3 GW of
thermal power capacity planned for retirement by 2030, will
potentially be replaced with equivalent renewable energy capacity.
Measures to hasten renewable capacity additions are, first, to
i
ncrease renewable purchase obligations (to 2029-2030) with a
greater focus on wind, hydropower and energy storage to facilitate
round the clock power from renewable energy sources. Second, the
green open access electricity
r
ules (notified in June 2022 and
launched in November 2022) are expected to boost renewable

Electricity Market Report 2023
P
AGE | 51
Regional perspectives
IEA. CC BY 4.0.
energy procurement. Third, the Energy Conservation (Amendment)
Bill 2022 mandates the use of non-fossil sources for designated
industrial and commercial consumers, and establishes
carbon
markets. India also encourages the production of green
hydrogen/ammonia through waivers of inter-state transmission
charges for a period of 25 years under the green hydrogen policy.
Presently, coal dominates the Indian electricity mix (74%). We
expect nuclear output to rise by over 80% during the forecast
period, to 83 TWh, but to remain a small component at 4% of the
mix in 2025. Coal-fired generation rose by 7.7% in 2022, while gas-
fired output fell by 36% in 2022 due to higher imported gas prices.
While total coal-fired generation is set to rise to 2025, we expect its
share to fall to 69% in the generation mix in 2025, as the share of
renewables reaches 25%. Because of higher coal-fired generation,
total power generation CO
2
emissions rise by 8% from 2022 levels
by 2025, despite falling CO
2
intensity.
Several measures are underway to modernise the
power system
While short-term markets (trading of bilateral contracts of less than
a one-year period) still represent 14% of the total generation an
d
power exchanges cover 6% of that total generation, these markets
are expected to grow. Across all market segments, the volume
traded on the Indian Energy Exchange (IEX) rose by 38% year-on-
year in the fiscal year 2022 (April 2021 to March 2022). In addition
to IEX and Power Exchange India Ltd (PXIL), a third power
exchange,
Hindustan Power Exchange s
tarted operations in July
2022. During the 2022 summer supply shortages, demand on
power exchanges doubled, resulting in price hikes. To safeguard
the interest of consumers, the Central Electricity Regulatory
Commission (CERC)
announced a cap of INR 12/kWh on t
he
market clearing price. The price cap was initially proposed to last
until 30 September 2022, but
was l
ater extended to end-year to
allow for higher demand in the festive season and onset of winter.
India plays a major role in cross-
border trade and regional
connectivity in South Asia. Presently, India benefits from
hydropower imports from Bhutan, and imports from Nepal are
expected to increase
i
n the next 3-5 years, based on Nepal’s
5 000 MW surplus hydropower. Nepal, which started trading
hydropower on India’s power exchange in 2021, increased its
traded capacity to about 364 MW of hydropower in June 2022.
Investments for further development of new hydro projects (about
1 200 MW) have been agreed upon in a MoU in summer 2022.
The distribution sector, which reported an increase in aggregate
accumulated losses from INR 300 billion in FY 2019/2020 to
INR 500 billion
in FY 2020/2021, remains stressed. To address this,
the government launched the revamped distribution sector scheme
to provide financial assistance with the modernisation of
infrastructure, and the clean electricity authority provided guidelines
on a
resource adequacy planning framework.
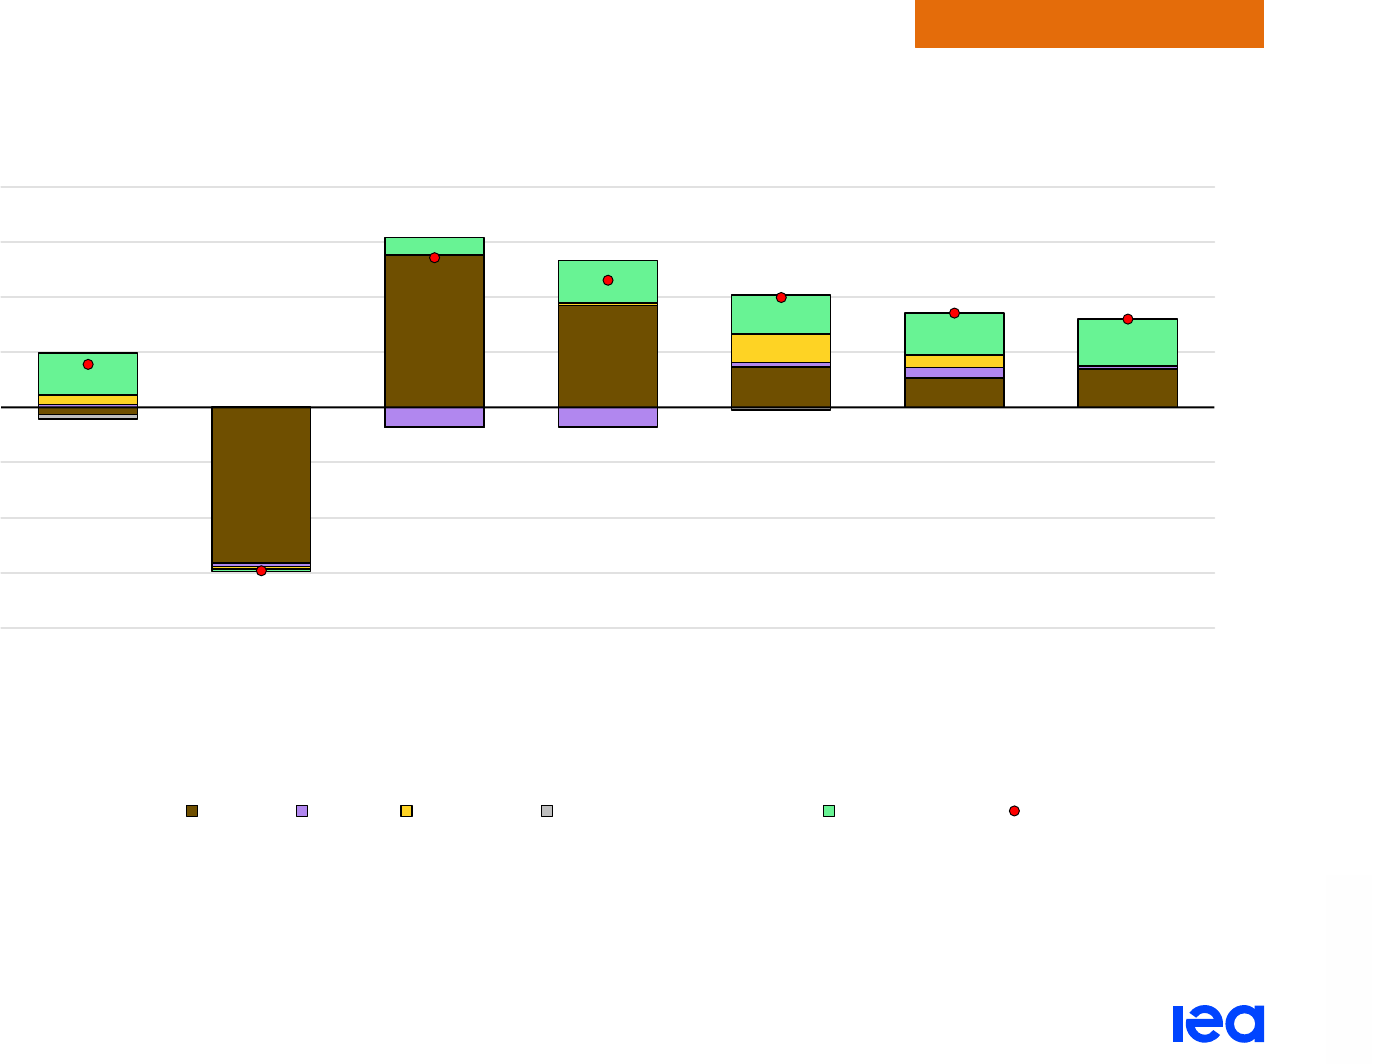
Electricity Market Report 2023
P
AGE | 52
Regional perspectives
IEA. CC BY 4.0.
Low-carbon power sources to provide bulk of India's additional supply from 2023 onward
Year-on-year change in electricity generation in India, 2019-2025
IEA. CC BY 4.0.
Note: Other non-renewables includes oil, waste and other non-renewable energy sources.
- 200
- 150
- 100
- 50
0
50
100
150
200
2019
2020
2021
2022
2023
2024
2025
TWh
Coal Gas Nuclear Other non-renewables Renewables Net change

Electricity Market Report 2023
P
AGE | 53
Regional perspectives
IEA. CC BY 4.0.
Japan
Electricity demand in Japan rose by 1% year-on-year in 2022 in
tandem with the economic recovery but growth will continue to be
curbed by Covid-19 measures and concerns about electricity
shortages.
The Japanese government issued a
power shortage warning in
March 2022 for the first time since their warning system was
enacted in 2012. They called on businesses and the public to cut
electricity use, emphasising that the combination of very cold
temperatures and a lack of generation capacity due to the
earthquake risked plunging the capital into blackouts. A similar alert
was issued
at the end of June 2022, triggering discussions on how
to secure stable electricity, especially with regards to the possibility
of restarting Japan’s nuclear plants. The government is mobilising a
number of measures to secure the minimum required power buffer
reserve of 3%.
The overall generation mix in Japan is still dominated by gas and
c
oal, which have a combined share of over 65%. However, the
renewable output is growing, with an estimated 4% y-o-y increase in
2022. In 2025, we expect renewable generation will reach 21%
above 2022 levels, partially offsetting declines in coal and gas-fired
generation.
A sharp 15% y-o-y reduction of nuclear generation was reported in
2022 due to the shutdown of some reactors that require periodic or
special inspection. After this decline, nuclear electricity output is set
to continuously increase out to 2025, driven by policies aimed at
reducing reliance on LNG and strengthening energy security in the
wake of the global energy crisis. In August 2022,
the Prime Minister
announced that the government would push for an accelerated
restart of the nuclear fleet, with the target of having 17 reactors
operational after mid-2023. While some uncertainty remains as
approvals need to be secured at the municipal level, this could
further boost nuclear generation.
Although electrification in the residential, commercial, and services
s
ectors has continued to increase, electricity demand is expected to
be flat from 2023 to 2025 due to energy conservation measures and
tight supply.
Korea
Korea saw strong electricity demand growth of about 3% in 2022,
led by the commercial, services and industrial sectors. We expect
continued growth of around 1-2% out to 2025.
Around 4 GW of renewable capacity was added in 2022, mainly
solar PV, in line with the trend in recent years. We expect this
development to continue in similar amounts over our forecast
horizon, supported by Korea’s renewables portfolio standard
and
the introduction of a direct power purchase agreement system in
September 2022.
Gas-
fired capacity will also increase out to 2025. Coal-fired capacity
is expected to rise until 2024, due to capacity already under
construction, and then will start to decline from 2025 onwards. New
nuclear capacity is also coming online, with the Shin-Hanul No.1

Electricity Market Report 2023
P
AGE | 54
Regional perspectives
IEA. CC BY 4.0.
reactor (1.4 GW) having started operations in December 2022 and
reactor No. 2 expected to begin operating in late 2023. In July 2022,
the government announced plans t
o resume construction of the
Shin-Hanul No. 3 and No. 4 nuclear reactors.
Demand growth in 2022 was mainly met by renewable electricity
and nuc
lear generation. Renewables grew by around 26% y-o-y,
reaching 8% of the electricity generation mix. Nuclear rose by 15%
y-o-y, accounting for 29% of the mix, whereas coal fell to 33%.
Absolute generation from gas declined slightly, and its share fell by
around 2 percentage points to 29%. By 2025, we expect
renewables to grow to 12% of the mix and nuclear to reach 32%,
while the shares of gas (27%) and coal (29%) both decline.
CO
2
emissions from Korean power generation fell slightly in 2022
due to a small decline in fossil fuel-fired generation. Average CO
2
intensity declined in 2022 due to higher renewable and nuclear
output, and we expect a continued decrease through 2025. We see
absolute emissions also entering a decline by 2025. From January
2022 onward Korea’s environmental dispatch system included a
price component reflecting greenhouse gas emissions, although at
present the impact on dispatch is limited and emissions reductions
are primarily driven by the increased availability of clean supply.
Korea released the working draft
of the 10
th
Basic Plan for
Electricity Supply and Demand (BPLE) in August 2022. This
included adjustments to the targeted electricity mix in 2030,
increasing the contribution of nuclear relative to the previously
released enhanced NDC plan. The 10
th
plan draft proposes
changes to the current wholesale market bidding system, which
would mean generation companies offer supply within a range of a
benchmark fuel cost and prices are set differentially by generation
company. Korea is also looking to introduce real-time electricity
markets for energy and ancillary services in addition to the existing
day-ahead market. Korea Power Exchange is planning
to begin a
pilot in Jeju in October 2023 to be extended to the mainland by the
end of 2025.
To manage the energy crisis, the government i
ntroduced a System
Marginal Price (SMP) upper limit system in the electricity market
from December 2022. The system limits electricity purchase prices
paid by Korea’s utility in charge of generation, transmission and
distribution, KEPCO, in the context of surging fuel costs. The price
cap, which will operate until November 2023, cannot be activated
for more than three consecutive months.
Australia
Australia’s economic activity posted a strong rebound in 2022, with
GDP growth above 3%. The recovery reflected the high levels of
Covid-19 vaccinations and a progressive relaxation of the measures
in place during 2021. Australia opened its borders to all vaccinated
people from February 2022.
Australia’s electricity consumption grew by around 3% in 2022, after
two years of relatively flat demand. We expect growth to continue
out to 2025 at slightly above 2% per year on average. Expanded
growth for large industrial customers
in Victoria and South Australia
contributes to the increase for 2022-2023.

Electricity Market Report 2023
P
AGE | 55
Regional perspectives
IEA. CC BY 4.0.
Continuing the trend of recent years, Australia’s capacity additions
in 2022 are dominated by more than 5 GW of new renewables,
including over 4 GW of solar PV. Growth in renewables is expected
to continue at a similar pace out to 2025, supported by auctions to
meet state-level targets and corporate purchasing.
Renewable
Energy Zones (REZ), or identified renewables-rich areas which are
targeted for coordinated infrastructure development, are expected
to enhance renewables deployment, and
different states declared
multiple zones in 2022 following the first zone announced in
November 2021. The retirement of the first unit of the coal-fired
Lidell Power Station (500 MW) took place in April 2022 as
anticipated and the remaining three units (1 500 MW) are on
schedule to retire in April 2023.
Battery capacity in Australia, which increased m
arkedly in 2021,
approximately doubled in 2022. This is driven both by the start of
operations of the many utility-scale projects
in the second half of the
year, and by growth in installation of residential battery systems.
2022 saw a continued decrease in generation from coal-fired plants,
which made up 49% of the mix relative to 53% in 2021. Demand
growth was met by increases in both renewable and gas-fired
generation. Over the forecast horizon, we see continued growth in
renewables output of around 12% annually as a result of ongoing
capacity growth. We expect gas-fired generation to remain stable to
2025. The power generation sector’s total CO
2
emissions, as well
as its average CO
2
intensity, will decrease as renewables output
increases and coal-fired generation declines.
Surging wholesale prices amid the energy crisis saw the Australian
Energy Market Operator suspend the National Electricity Market
from 15 June to 24 June 2022. The market suspension was
necessitated by sustained high prices that triggered the
Administered Price Cap, which was accompanied by reduced
generation volumes offered to the market and heightened risks to
security of supply.
Generation companies indicated t
hat offers were
lower because the price cap had affected the profitability of some
bids. The Australian Energy Market Commission has
subsequently
introduced a rule change to double the Administered Price Cap,
applicable from 1 December 2022 to 30 June 2025, and in
December 2022 also
intr
oduced a wholesale price cap for gas and
coal.
In July the government introduced the Climate Change Bill 2022,
legislating the country’s commitment to reduce GHG emissions 43%
from 2005 levels by 2030 and achieve carbon neutrality in 2050.
The bill
passed both houses in September 2022.
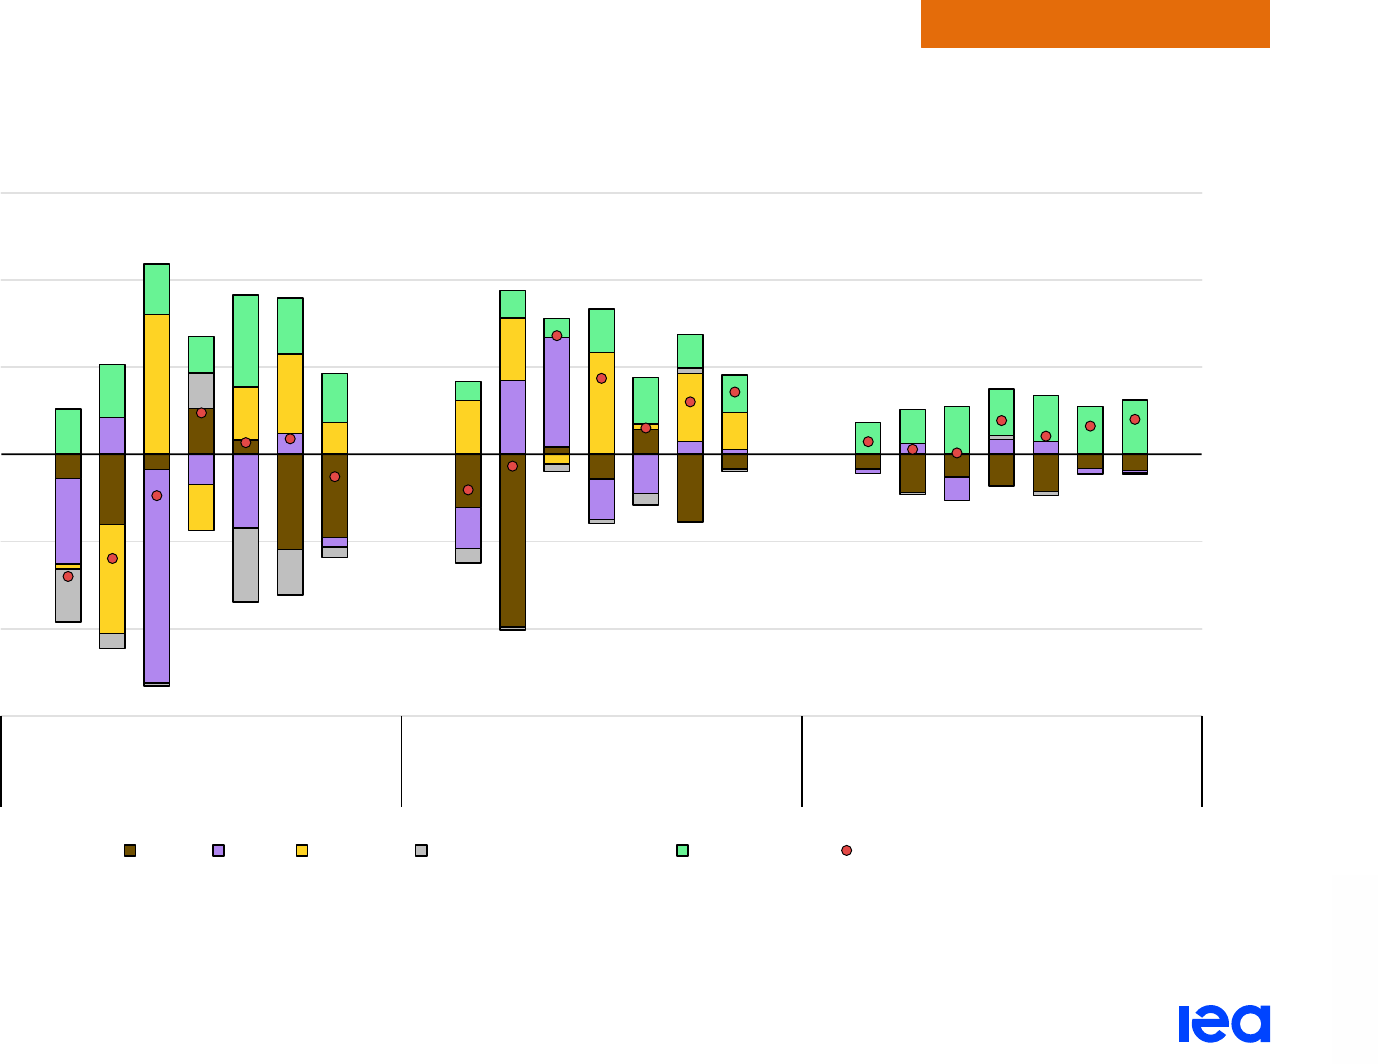
Electricity Market Report 2023
P
AGE | 56
Regional perspectives
IEA. CC BY 4.0.
Nuclear generation ramps up in Japan and Korea out to 2025; renewables expand in Australia
Year-on-year change in electricity generation in selected countries in Asia Pacific, 2019-2025
IEA. CC BY 4.0.
Note: Other non-renewables includes oil, waste and other non-renewable energy sources. The CO
2
intensity is calculated as total CO
2
emissions divided by total generation.
- 60
- 40
- 20
0
20
40
60
2019
2020
2021
2022
2023
2024
2025
2019
2020
2021
2022
2023
2024
2025
2019
2020
2021
2022
2023
2024
2025
Japan Korea Australia
TWh
Coal Gas Nuclear Other non-renewables Renewables Net change
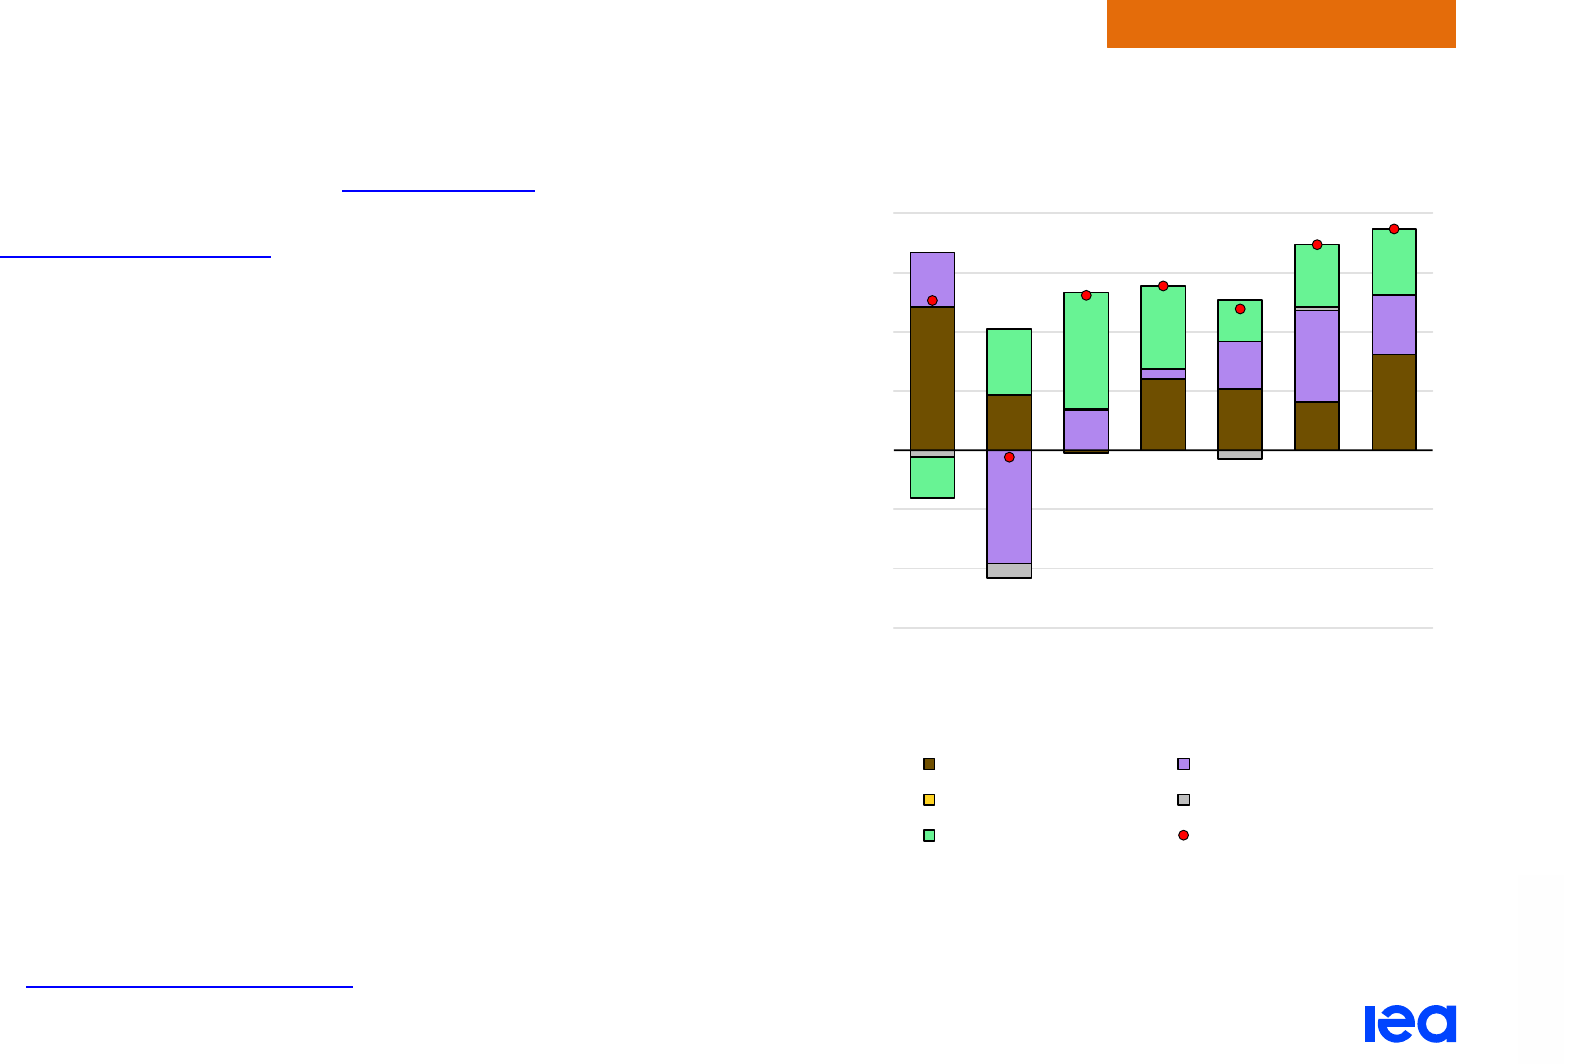
Electricity Market Report 2023
P
AGE | 57
Regional perspectives
IEA. CC BY 4.0.
Southeast Asia
In 2022, we estimate electricity demand grew by 5.5% in Southeast
Asia. This trend is in line with the economic recovery
i
n the region
after countries reopened their borders to international tourism, a
significant ec
onomic driver in many Southeast Asian countries.
The region’s power generation is based mainly on coal (43% in
2022), gas (29%) and renewables (27%). While the share of
coal-fired generation in the mix is expected to decrease slightly in
the coming years, the absolute generation from coal is increasing
every year by 4% on average up to 2025 in the region, led by
capacity additions in Indonesia and Viet Nam. High global energy
prices and supply shortages have further contributed to the lifetime
extension of some coal-fired power plants in some countries, such
as in Thailand.
We estimate that electricity demand will continue rising by 4-6% per
year until 2025. Most of that additional demand will be met by fossil
fuels, with renewables meeting about a third of that demand growth.
The share of renewables in the generation mix will rise slightly to
below 28% in 2025. This leads to a decrease in the emission
intensity of the region’s generation mix by over 1% in 2025
compared to 2022, but at 585 g CO
2
/kWh it is set to remain among
the highest globally.
Several countries in the region have set carbon neutral or net zero
targets, and aim to accelerate renewable energy capacity
deployment. As such, the region is targeting the addition of 50 GW
of solar and wind capacity by 2030
, and over 250 GW by 2050.
Year-on-year change in electricity generation in Southeast Asia,
2019-2025
IEA. CC BY 4.0.
Note: Other non-renewables includes oil, waste and other non-renewable energy
sources.
- 60
- 40
- 20
0
20
40
60
80
2019
2020
2021
2022
2023
2024
2025
TWh
Coal Gas
Nuclear Other non-renewables
Renewables Net change

Electricity Market Report 2023
P
AGE | 58
Regional perspectives
IEA. CC BY 4.0.
Indonesia
In 2022, Indonesia’s share of coal in the electricity mix rose to 64%
of total power generation (from 61% in 2021), and provided the
majority of the electricity needed to meet the estimated 6.6% y-o-y
demand increase. Gas-fired output made up 15% of the Indonesian
mix in 2022, and renewables 20%, with hydropower, geothermal
and biofuels making up the largest share of the renewable mix.
In the coming years, electricity demand is expected to rise steadily
(ranging from 3% to 7% per year), in line with Indonesia’s projected
GDP growth of more than 5% per year in this decade, and
supported by government plans for electrifying mobility and cooking.
While the long-awaited Presidential Decree 112
on t
he acceleration
of renewable energy development for electricity generation was
published in September 2022, it is expected to come into effect only
gradually with the release of
Ministerial Regulations t
o implement
the Decree. We expect renewables to reach almost 22% of
electricity generation in 2025, falling slightly short of the target of
23% by 2025 established in the
2014 national energy plan.
While the generation expansion programme announced in 2015
continues to add coal-fired plants, with a total 13 GW in the
2021-2030 project pipeline for which tenders have been held
, the
Just Energy Transition Partnership will support an accelerated
phase-out of coal-fired output in the mid- to long-term. Indeed, one
of the measures of this partnership, launched in November 2022, is
the
freeze of the current planned pipeline of coal-fired plants. Other
targets in this framework to accelerate the decarbonisation of the
power sector include achieving peak power sector emissions by
2030 of no more than 290 Mt CO
2
, and reaching a share of 34% of
renewables in the generation mix by 2030.
Due to its coal-
heavy generation mix, Indonesia’s CO
2
intensity is
among the highest in the Southeast Asia region. CO
2
emissions
from the power sector in Indonesia rose by 6% in 2022, and are
estimated to further increase by about 4% per year up to 2025.
Viet Nam
The impact of high global commodity prices in Viet Nam is relatively
subdued due to a strong domestic market. Economic and electricity
demand growth are thus expected to remain high. We estimate
electricity consumption rose by 6% in 2022 and that it will grow by
about 6% per year on average in 2023-2025.
Alongside this high demand growth comes a challenge to provide
matching supply. The approval of Viet Nam’s main planning
document, the Power Development Plan 8, has been delayed to
incorporate recent developments such as the country’s recently
committed decarbonisation targets, changing global fuel prices, and
plant financing challenges. These include COP26 commitments to
net zero emissions by 2050 and the
phase out of coal power
generation by 2040. In the most recent draft (October 2022),
6.8 GW of coal-fired capacity was withdrawn from the planning
process, either due to investor withdrawal or proposals to shift from
coal to other fuels. Nonetheless, 3.8 GW of new coal-fired capacity
is still expected to be commissioned by 2030, in addition to the
Nghi
Son 2 (1.2 GW) and Song Hau 1 (1.2 GW) power plants that started

Electricity Market Report 2023
P
AGE | 59
Regional perspectives
IEA. CC BY 4.0.
operations in 2022. About 32% to 44% of the annual increments
from 2023 to 2025 would therefore be met by coal power. Its share
in the generation mix will remain constant at 41% in 2022-2025.
The current draft development plan includes an additional
6 GW
of
LNG-based power generation by 2030 to help replace the planned
coal capacity that has been withdrawn. The ongoing build-up of the
first LNG terminals is therefore critical. The Hai Linh LNG terminal
(1.5 Mt/yr) is intended to supply a
1.2 GW power plant that is
already constructed but not yet operational. The Thi Vai LNG
terminal (1 Mt/yr) is expected to be finished by the end of 2023,
supplying 1.5 GW of power capacity. The Son My LNG terminal
(3.6 Mt/yr) designed to supply 2.3 GW of gas-fired capacity is
expected to begin commercial operations
only by 2026.
Issues on the policy measures to increase renewable capacity have
still not been resolved. The phase-out of feed-in-tariffs
has reduced
renewable capacity additions and extending these tariffs further is
still under discussion. Nonetheless, the growth is expected to
continue, such that about 40% of the demand increases in 2023-
2025 would be satisfied by renewables. In 2025, we expect
renewables to provide 46% of the total generation mix.
Moreover, a new pricing framework and r
ooftop PV regulations are
being considered in order to strike a balance between the
government’s fiscal capabilities and reducing the risk for investors.
The planned pilot projects for direct
power purchase agreements
with renewable developers have yet to take place. Such
mechanisms allow companies to procure clean electricity directly t
o
reach their corporate net zero goals and alleviate pressure on the
government’s renewable subsidy budgets.
Thailand
Thailand’s economic recovery continued in 2022, with an estimated
GDP growth of 3.2%. Peak demand in 2022 increased by 7%
t
o
32.3 GW, compared to 30.1 GW in 2021. We estimate overall y-o-y
growth in electricity consumption of almost 4% in 2022. Reported
data for the first eight months of 2022 show electricity consumption
rose by 4%, l
ed by the commercial (11%) and industrial (4%)
sectors, which represent 23% and 45%, respectively, of total
demand. The residential sector, which accounts for 28% of demand,
has stagnated in the same period.
Thailand, which dep
ended on gas for 61% of its power generation in
2022, was strongly impacted by the rise in global fuel prices, which
led the energy regulatory commission to increase the fuel tariff
–
a
component of the electricity price – for the last quarter of 2022 by
18%. Indeed, the country faced gas supply challenges due to a
combination of lower domestic production, import disruptions and
high prices. Thailand further decided to
extend the lifetime of some
of its coal-fired power plants and implemented plans to reduce
power consumption. To lower the burden of the high prices on
households, the government announced in September 2022 an
extension of the electricity bill subsidy f
or vulnerable consumers.
We expect electricity demand in Thailand to grow by 3-4% per year
until 2025. Gas will remain Thailand’s dominant generation source
in the coming years, with 1.3 GW of gas capacity commissioned in

Electricity Market Report 2023
P
AGE | 60
Regional perspectives
IEA. CC BY 4.0.
2022, and a new combined-cycle gas plant with four units of
660 MW each expected to be fully operational between 2023 and
2024, which will bring gas-fired output’s market share to 63% of the
mix in 2025. Per the goal to be
carbon neutral by 2050, Thailand
aims renewables to account for 50% of the electricity mix by this
target date. This will require an accelerated deployment of
renewables, as we expect their share in the generation mix to
decrease in the coming years, from 19% in 2022, to 17% in 2025.
With the new Power Development Plan (PDP) currently under
di
scussion, some targets such as the planned deployment of
16 hydro-floating solar hybrid projects
f
or a total of 2.7 GW of
capacity have already been announced. The government further
introduced a
feed-in tariff mechanism, starting in 2025-2026, which
regulates the sale of renewable electricity generated by small
(under 90 MW) and very small (under 10 MW) power producers.
Philippines
The Philippines’ economic rebound from the easing of lockdowns
underpinned an estimated GDP growth of 7% in 2022. It is expected
to dip slightly to 5% in 2023 due to high commodity prices, before
rising again to rates above 6% through 2025. We forecast annual
average demand growth of about 5.5% for the next three years.
Coal and renewables are expected to meet incremental demand
until the new gas-fired power plants start operation by 2024.
Coal made up 58% of the generation mix in 2022. About
1.6 GW
of
new coal-fired capacity is committed and projected to become
operational between 2023 and 2025, with an additional 720 MW
expected by 2027. These projects were all approved prior to the
moratorium on new coal-
fired power plants in 2020. Gas-fired units
are expected to meet a large part of future additional growth,
primarily driven by LNG imports given the
depletion of
the country’s
only domestic gas field. However, the LNG terminal build-up has
faced delays attributed to Russia’s war in Ukraine and t
he Covid-19
pandemic affecting the supply chain for materials. The delayed
5.2 Mt/yr import facility in Batangas is intended to supply an existing
1.2 GW gas power plant and another planned
850 MW gas power
plant expansion. Moreover, the constructed 650 MW Pagbilao gas
power plant set to start in 2022 is delayed due to financing issues of
the associated transmission substation. We expect the share of gas
generation in the mix to reach 19% by 2025, from 17% in 2022.
Despite ear
ly legislation to support renewables development in the
Philippines, growth has been limited so far. Renewables had a 22%
share of the generation mix in 2021, with solar PV and wind making
up
less than 3%. Additional policy changes were introduced in 2022
to further stimulate investment for renewables to help achieve the
country’s 2030 target of reaching a 35% share of renewables in the
energy mix. This includes
allowing 100% foreign ownership of
renewable assets which was limited to 40% before, and maintaining
priority dispatch for biomass and maintaining “must-dispatch” for
variable renewables after the expiry of the feed-in-tariff programme
on which the special dispatch condition depends. It also extended
priority dispatch privileges to
geothermal and dammed hydro. In
addition, the Green Energy Option Program started operation in
January 2022. The initiative allows consumers with a peak demand

Electricity Market Report 2023
P
AGE | 61
Regional perspectives
IEA. CC BY 4.0.
of at least 100 kW and equipped with a 5-minute metering unit to
enter into direct procurement of renewables.
The Philippines’ electricity market continues to develop with the
i
ntegration of the island system of Mindanao at the end 2022 and
opening of the reserves market by 2023. Furthermore, the
Renewable Energy Market
(
REM), where renewable energy
certificates are traded, started operations in summer 2022.
Finally, electricity security and resilience continue to be key
c
oncerns for the country. The recent typhoon Noru impacted
thirteen 69-kV and four 230-kV transmission lines, resulting in
20 out of 51 public distribution areas to experience partial or total
power interruption. This year, the country also announced the
inclusion of nuclear energy i
n its long-term energy policy.
Singapore
Electricity demand in Singapore grew by 2% in 2022 as the impact
of the Covid-19 pandemic on the economy eased. We forecast an
increase of over 1% in 2023, due to higher demand in electricity-
intensive sectors (industry is the largest electricity consuming sector
in the country) and a growing EV adoption rate. Our outlook for
2024 and 2025 shows growth above 1% per year. According to the
Singapore Green Plan 2030, the country will double the target
number of EV charging points
from 28 000 t
o 60 000 by 2030 and
will phase out of all internal combustion engine vehicles by 2040. In
addition, the Minister of Transportation aims for
electrification of half
of the public buses and taxis by 2030.
Singapore relied on imported natural gas to generate around 95%
of its electricity in 2022, making domestic energy prices highly
vulnerable to volatile of global energy markets. In October 2022,
Singapore announced that they will maintain extraordinary
measures as a buffer, including standby fuel facilities
f
rom which
generation companies can draw fuel when their gas supplies are
disrupted. Authorities also required generation companies maintain
enough fuel in addition to the existing reserve requirements.
In the coming years Singapore plans on increasing electricity
i
mports to diversify its supply as their domestic output with existing
thermal power plants cannot meet rising demand. In line with that
plan, Singapore had its first renewable electricity imports i
n 2022.
The Lao PDR-Thailand- Malaysia- Singapore Power Integration
Project (LTMS-PI
P) enables trade up to 100 MW of hydropower
from Lao PDR to Singapore via Thailand and Malaysia utilising
existing infrastructure. This is the first multilateral cross-border
power trade including four countries of the Association of Southeast
Asian Nations (ASEAN). EMA also envisions importing
100 MW
equivalent of electricity from a solar farm in Pulau Bulan, Indonesia
through a new interconnector around 2024.
By 2025, while gas will remain the major source of electricity (95%
of
the mix), the share of renewables is expected to rise to 3.4%
(from almost 3% in 2022), which is driven by solar – there is a target
to reach 1.5 GW of solar PV by 2025 (from 0.4 GW in 2021).
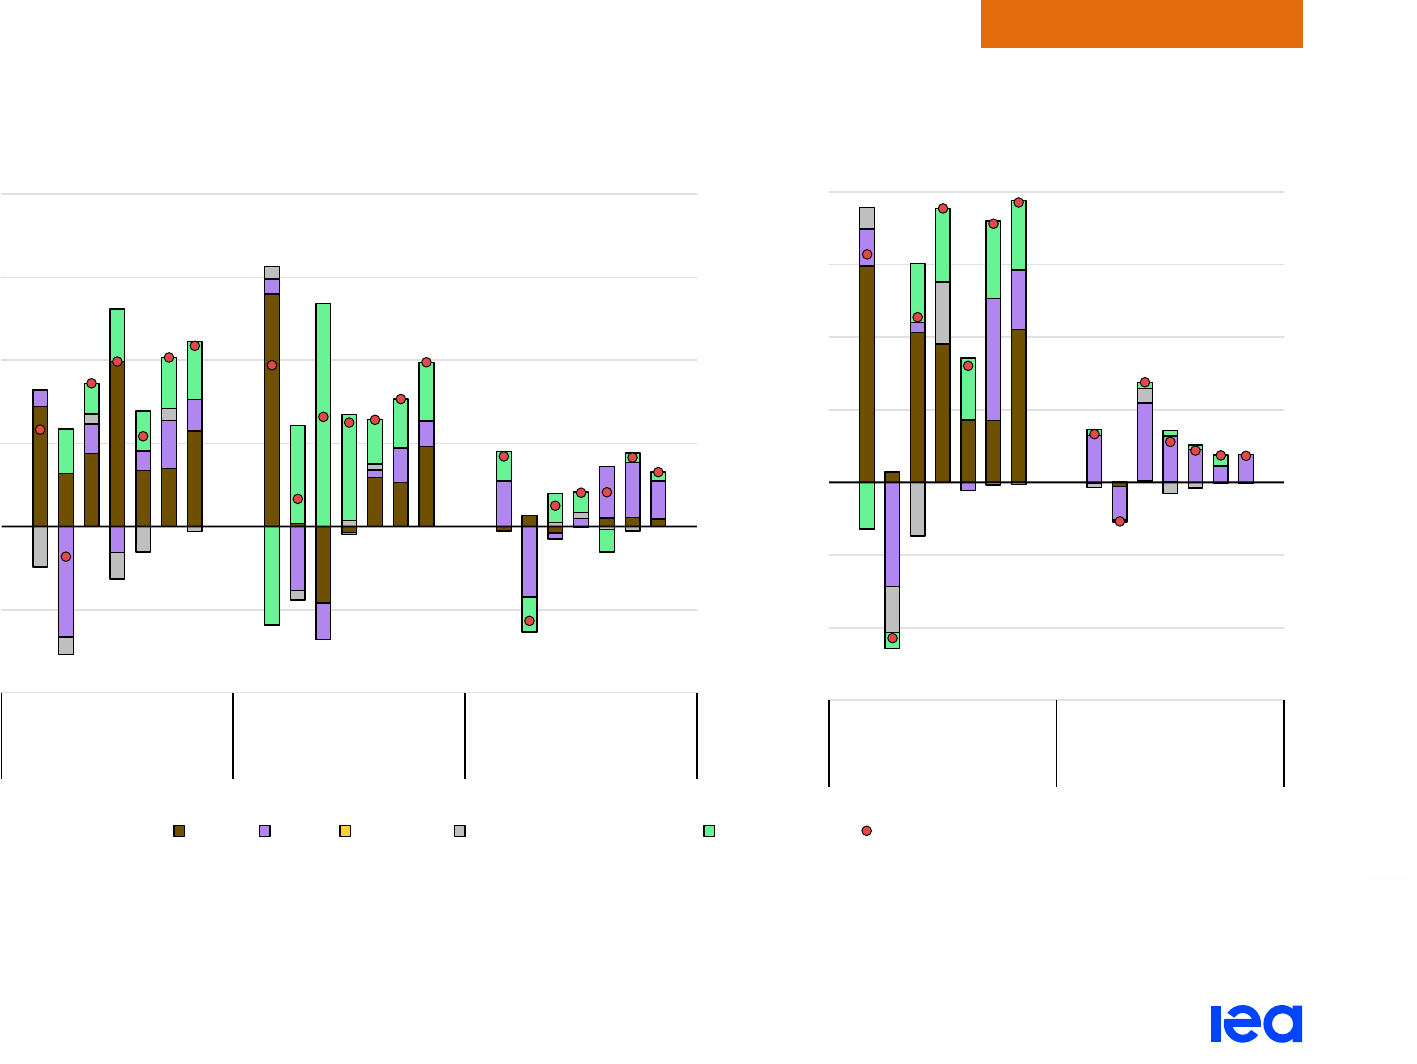
Electricity Market Report 2023
P
AGE | 62
Regional perspectives
IEA. CC BY 4.0.
Coal- and gas-fired generation set to remain significant in meeting Southeast Asia’s demand
Year-on-year change in electricity generation in selected countries in Southeast Asia, 2019-2025
IEA. CC BY 4.0.
Note: Other non-renewables includes oil, waste and other non-renewable energy sources.
- 20
- 10
0
10
20
30
40
2019
2021
2023
2025
2019
2021
2023
2025
2019
2021
2023
2025
Indonesia Viet Nam Thailand
TWh
Coal Gas Nuclear Other non-renewables Renewables Net change
- 6
- 4
- 2
0
2
4
6
8
2019
2021
2023
2025
2019
2021
2023
2025
Philippines
Singapore
TWh

Electricity Market Report 2023
P
AGE | 63
Regional perspectives
IEA. CC BY 4.0.
Americas

Electricity Market Report 2023
P
AGE | 64
Regional perspectives
IEA. CC BY 4.0.
Renewables meet most of additional demand in the Americas while coal-fired power declines
Electricity demand in the Americas region rose for the second year
in a row, up by 2.3% in 2022, though slightly below growth in 2021.
Regional demand declined in both 2019 and 2020. We expect
electricity consumption to stagnate in 2023 due to weaker economic
growth, before rebounding to 1.5% per year in 2024 and 2025.
The recovery is largely driven by the United States, which accounts
for two-thirds of overall regional electricity demand. US electricity
consumption rose by 2.6% in 2022, but demand is forecast to
decline by 0.6% in 2023 before increasing to an average of 1.2% in
2024 and 2025. Canada, the third largest consuming nation in the
Americas (behind the United States and Brazil), mirrors the US
trend, as demand rose by almost 2% in 2022 before declining 1% in
2023 and then recovering to growth of an average 2.5% in 2024 and
2025. We estimate that demand in Mexico rose by almost 4% in
2022, but expect growth to average 2.3% over the next three years.
In Central and South America, annual demand growth moderated to
an estimated 1% in 2022 from 4.4% in 2021. For 2023-2025, we
forecast electricity consumption to increase at an annual average
rate of 2%. Weaker growth in 2022 was largely due to a slowdown
in Brazil, the region’s second largest consumer. Brazilian demand
growth rose by a modest 0.3% in 2022, down from 6% in 2021. We
forecast an annual average increase of 2% for the country over the
2023-2025 period. In 2022, electricity demand in Argentina (0%),
Colombia (1%) and Chile (2%) saw modest increases while Peru
posted more robust growth (4%). Going forward, we expect growth
to accelerate in Colombia and Chile while the pace slows in Peru
and Argentina in 2023-2025.
An increase in coal-fired output due to fuel switching from
comparatively higher natural gas prices and lower hydro availability
in the region in 2021 proved to be short-lived. After growth of 13% in
2021, coal generation fell by 7% in 2022 and is forecast to decline
8% per year on average for the 2023-2025 period. Hydroelectric
output rebounded by an estimated 4% in 2022 as severe drought
conditions eased, particularly in Brazil and the United States. This
rise, as well as additions of wind and solar capacity, drove year-on-
year growth in renewables generation up 9% in 2022, from 2% in
2021. Renewables growth will then moderate to an average 5% per
year in the 2023-2025 period as hydroelectric generation levels out.
Renewables including hydro accounted for 36% of annual
generation in the region in 2022, the largest share of all sources,
followed by gas at 33%, coal at 15%, nuclear at 14% and oil at 2%.
By 2025 we expect renewables to account for over 40% of the
Americas electricity generation mix, with its share increasing almost
entirely at the expense of coal, which is expected to decline to a
share of 12% (from 15% in 2022).
This will drive emissions down, both in their overall level and
intensity. We estimate CO
2
intensity will fall to about 260 g CO
2
/kWh
in 2025, down from 300 g CO
2
/kWh in 2022 and 380 g CO
2
/kWh in
2015. Regional emissions are set to decline to 1.8 Gt CO
2
in 2025,
from 2.5 Gt CO
2
in 2015.
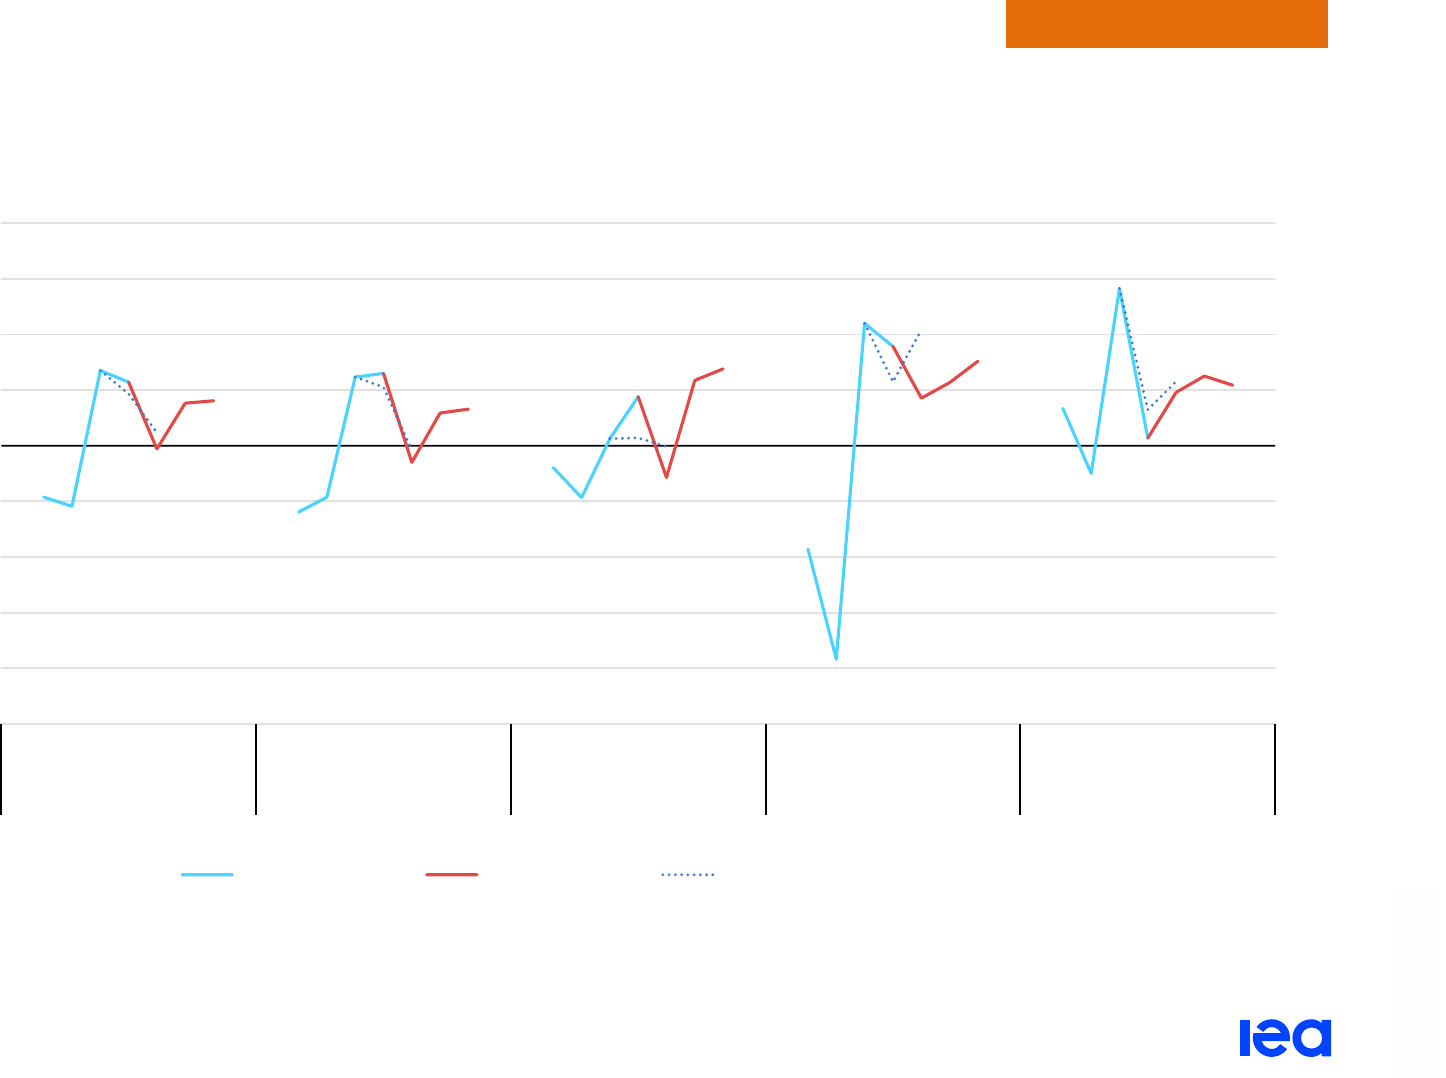
Electricity Market Report 2023
P
AGE | 65
Regional perspectives
IEA. CC BY 4.0.
Electricity demand growth will slow along with economic activity in 2023, but rebound in 2024
Year-on-year relative change in electricity demand, Americas, 2019-2025
IEA. CC BY 4.0.
-10%
-8%
-6%
-4%
-2%
0%
2%
4%
6%
8%
2019
2021
2023
2025
2019
2021
2023
2025
2019
2021
2023
2025
2019
2021
2023
2025
2019
2021
2023
2025
Americas United States Canada Mexico Brazil
Electricity demand growth
Historical demand Updated forecast
Previous forecast (July 2022)
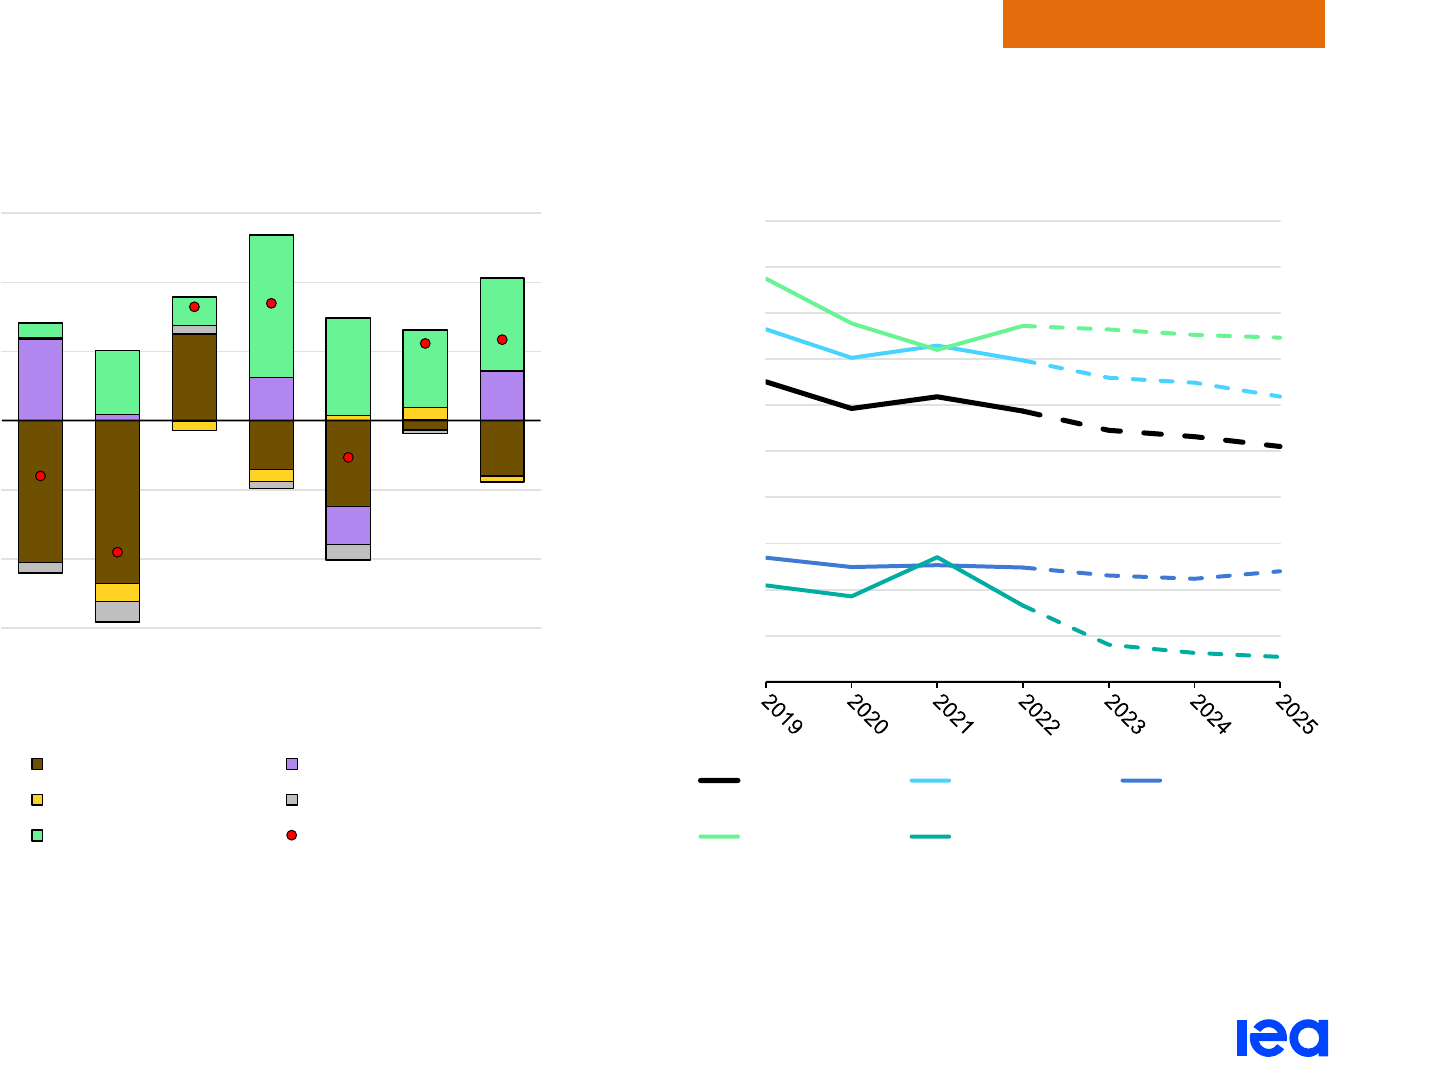
Electricity Market Report 2023
P
AGE | 66
Regional perspectives
IEA. CC BY 4.0.
Renewable generation ramps up, driving down emissions across the Americas
Year-on-year change in electricity generation, Americas,
2019-2025
IEA. CC BY 4.0.
Development of average CO
2
intensity, Americas, 2019-2025
IEA. CC BY 4.0.
Note: Other non-renewables includes oil, waste and other non-renewable energy sources. The CO
2
intensity is calculated as total CO
2
emissions divided by total generation.
- 300
- 200
- 100
0
100
200
300
2019
2020
2021
2022
2023
2024
2025
TWh
Coal Gas
Nuclear Other non-renewables
Renewables Net change
0
50
100
150
200
250
300
350
400
450
500
g CO₂/kWh
Americas United States Canada
Mexico Brazil

Electricity Market Report 2023
P
AGE | 67
Regional perspectives
IEA. CC BY 4.0.
United States
Electricity security remains at risk in many regions
Electricity security in the United States remains at risk during the
winter of 2022/23. Outages that occurred in Texas in February 2021
exposed the country’s vulnerabilities to extreme weather and
prolonged cold periods. The winter reliability assessment
r
eleased
in November 2022 by the North American Reliability Corporation
(NERC), reports that the US Southeast, Texas, the Midwest and
New England regions could see load shedding due to generation
and transmission outages, fuel supply shortages and natural gas
infrastructure unavailability. In December 2022, a strong winter
storm left over
1.5 million customers w
ithout power.
Electricity demand growth is set to slow in 2023;
policies boost low-carbon power in the coming years
Electricity use rose by 2.6% in 2022, surpassing pre-pandemic
levels, led by economic growth coupled with higher air conditioning
and heating use. However, demand is forecast to fall by 0.6% in
2023 due to an expected slowdown in economic activity, before
returning to annual growth of around 1.2% in 2024 and 2025.
Gas-fired generation grew by 8% in 2022, reversing a decline of 3%
in 2021, as gas prices moderated due to mild temperatures and the
loss of LNG export capacity at the Freeport facility. The overall
slowdown in electricity demand is expected to reduce gas-fired
generation by 3% in 2023. Coal-fired generation fell year-on-year by
7% in 2022, reversing a 15% rise in 2021, which was the first
annual increase since 2014. Out to 2025, falling natural gas prices
are expected to support an increase in coal-to-gas switching, with
growth in renewables reducing total fossil fuel-fired generation.
Coal-fired output is set to fall by an average 7% per year in the
2023-2025 forecast period.
Hydropower output rose by about 3% in 2022 as long-term drought
conditions eased in many hydro-producing regions, nevertheless
hydro output remained slightly below the 2017-2021 average by
4%. Wind and solar PV posted continued strong growth in 2022.
Wind generation rose by 14%, while solar output grew by 27%. By
2025, wind generation is expected to grow by 19% compared to
2022, and solar PV generation up by 56% over the same period.
This will be supported by the August 2022 passage of the
Inflation
Reduction Act, which included USD 30 billion in targeted grant and
loan programmes for clean electricity investments.
Nuclear output s
howed no significant change between 2021 and
2022, following two years of slight declines due to three reactors
retiring. We expect that the commissioning of Vogtle Units 3 and 4
in Q1 and Q4 2023, respectively, will raise nuclear output by 2% in
2023. Further, the California legislature passed a bill to
extend the
life of Diablo Canyon Units 1 and 2 from 2024 and 2025 to 2029
and 2030, respectively, which will boost mid-term generation.
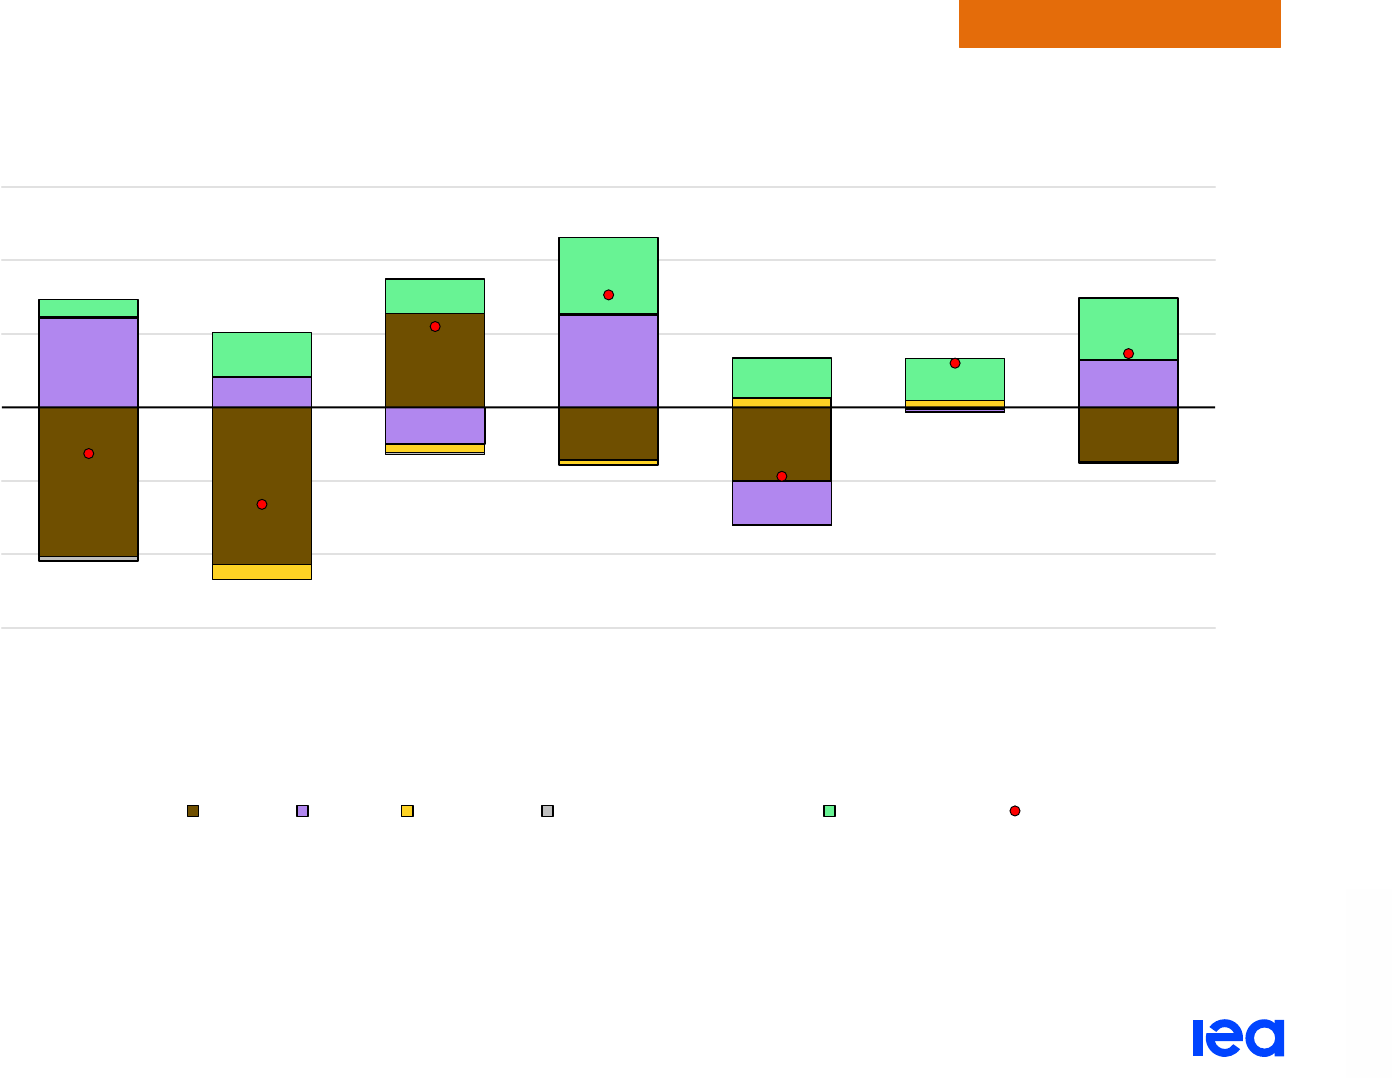
Electricity Market Report 2023
P
AGE | 68
Regional perspectives
IEA. CC BY 4.0.
Coal-fired generation in the United States down in 2022, reversing a sharp increase in 2021
Year-on-year change in electricity generation in the United States, 2019-2025
IEA. CC BY 4.0.
Note: Other non-renewables includes oil, waste and other non-renewable energy sources
- 300
- 200
- 100
0
100
200
300
2019
2020
2021
2022
2023
2024
2025
TWh
Coal Gas Nuclear Other non-renewables Renewables Net change

Electricity Market Report 2023
P
AGE | 69
Regional perspectives
IEA. CC BY 4.0.
Canada
Electricity security also remains a concern in Canada. The NERC’s
November 2022 winter reliability assessment
c
ites Alberta and the
Maritimes as being at risk of insufficient electricity this winter due to
higher-than-average peak electricity demand growth combined with
the potential for high generator unavailability. The continued
economic recovery from the pandemic-induced slowdown, as well
as Canada’s position as a commodities exporter, has sheltered it
from high input costs, resulting in electricity demand growth of 2%
year-on-year in 2022. The expected economic slowdown in 2023
will lead to a decline in demand of 1%.
Total thermal generation is expected to remain steady over our
forecast period, but gas will increasingly replace coal in the
generation mix. This will result in an 18% share for gas and 2%
share for coal in 2025, compared to roughly equal shares of 10% in
2015. For nuclear output, the refurbishment programme at the
Darlington and Bruce
r
eactors will intensify in 2023, resulting in the
temporary shutdown of five out of ten units in the second half of the
year for refurbishment. This will decrease output of the overall fleet
by almost one-quarter over 2023-2025 compared to 2015-2019
averages.
The government’s F
all Economic Statement proposed a refundable
tax credit of 30% for clean energy investments of up to
CAD 6.7 billion over five years, including solar PV, wind, storage
and small modular nuclear reactors. We expect this policy to
contribute to strong growth in renewable generation, with wind and
solar PV growth forecast to rise by about 6% and 14% per year,
respectively, between 2023 and 2025.
Mexico
After the quick recovery in energy demand following the pandemic,
electricity demand grew by almost 4% y-o-y in 2022. After an
expected slowdown to less than 2% growth in 2023, the pace is set
to pick up continuously, reaching 3% by 2025, which equates to an
increase from about 300 TWh in 2022 to almost 330 TWh by 2025.
In 2022, the rise in demand was met by a mix of sources, mainly by
wind and solar PV, but also a small absolute increase in coal-fired
generation.
The Mexican government announced a more ambitious
GHG
reduction target at COP27, shifting from the original 22% to 35% by
2030 as part of a joint investment project with the United States.
The average CO
2
intensity of Mexican power generation, on the
other hand, has risen by 7% y-o-y in 2022 to reach 385 g CO
2
/kWh,
due to the increased share of fossil-fired generation. CO
2
intensity
growth is expected to decline out to 2025, to 370 g CO
2
/kWh, as
renewables and gas-fired output growth meets incremental
demand, while oil-fuelled generation remains flat on average.
In the coming years, growth in renewables such as solar PV and
w
ind from private sector companies is expected to slow. Auctions,
which resulted in much of the growth in renewable energy, were
halted in 2019. This follows a series of disconnections of private
sector renewable energy projects due to generation permit expiry,
permit cancellation or fines as a result of
deviations from their

Electricity Market Report 2023
P
AGE | 70
Regional perspectives
IEA. CC BY 4.0.
original arrangement. In January 2022 a plant in the northern state
of Nuevo Leon ceased operations after being fined USD 467 million
for selling surplus generation to third parties instead of to CFE.
Despite the slowdown of private sector activity in Mexico’s electricity
m
arket, the government has announced a number of clean energy
projects in collaboration with state governments. These include a
new 18 MW solar PV rooftop installation
on t
op of Mexico City’s
largest market, and most notably an ongoing development of the
solar PV plant in the northern state of Sonora, t
hat should add
420 MW by the end of February 2023 and reach a total of
1 000 MW by the end of the fourth phase in 2027.
In the coming years, CFE plans the addition of around 16 new
gas-fired power plants along with the repowering of ten of the
hydropower plants run by the state company.
Brazil
Despite the strong post-pandemic rebound, Brazil’s electricity
demand in 2022 increased only very slightly, by 0.3% year-on-year,
but is set to rise by around 2% per year in the 2023-2025 period.
Hydropower generation rebounded in 2022 with a y-o-y increase of
about 17% after the country’s most severe drought in 90 years
, and
led to a decrease in power system emission intensity from
135 gCO
2
/kWh in 2021 to 80 gCO
2
/kWh in 2022. The CO
2
intensity
is expected to continue decreasing towards 30 gCO
2
/kWh in 2025.
We expect hydropower’s share of generation to rise from 55% to
63% bet
ween 2021 and 2025, which will drive the emissions
reduction along with an increase in the share of wind and solar PV
generation, from 11% to 17% and 3% to 11%, respectively.
In the coming years, several proposed updates, which are part of
the country's power system modernisation programme, may alter
the rate at which renewables are deployed and how different actors
interact in the power system. On 1 November 2022, the regulator
ANEEL launched a consultation to
alter solar PV net-
metering
incentives, leading to a decrease in the number of incentives for
distributed generation (DG). The document also details new
financing schemes for new installations through a special energy
development account (CDE) from 2023. The CDE will be financed
by all captive consumers, reducing the burden in regions with high
penetration of renewables. Additionally, in 2023, the free market
reserve for renewables ends and from 2024 they will have to
participate in the wholesale market.
Brazil’s Law 14 300,
published in January 2022, sets a gradual
transition path for distributed generation; current contracts will be
grandfathered and a de facto net billing system will be introduced in
January 2023. After a transition period, new DG clients will only be
able to compensate for the energy component of their bills and they
will be obliged to pay all distribution components of the tariffs.
Additionally, 514/18
r
egulation will expand access to the liberalised
retail market for consumers with loads between 0.5-1 MW, and from
2024, high-voltage customers of any level of demand will have
access to the free market.

Electricity Market Report 2023
P
AGE | 71
Regional perspectives
IEA. CC BY 4.0.
These new rules spurred the acceleration of decentralised solar PV
deployments in 2022, totalling 10.7 GW. However, as the gradual
opening of the energy market may offer customers an alternative to
investing in distributed PV generation in order to decrease their
electricity bills, it may slow the deployment of the distributed
generation, which is the regulator’s aim due to the impact of DG on
wider system operation.
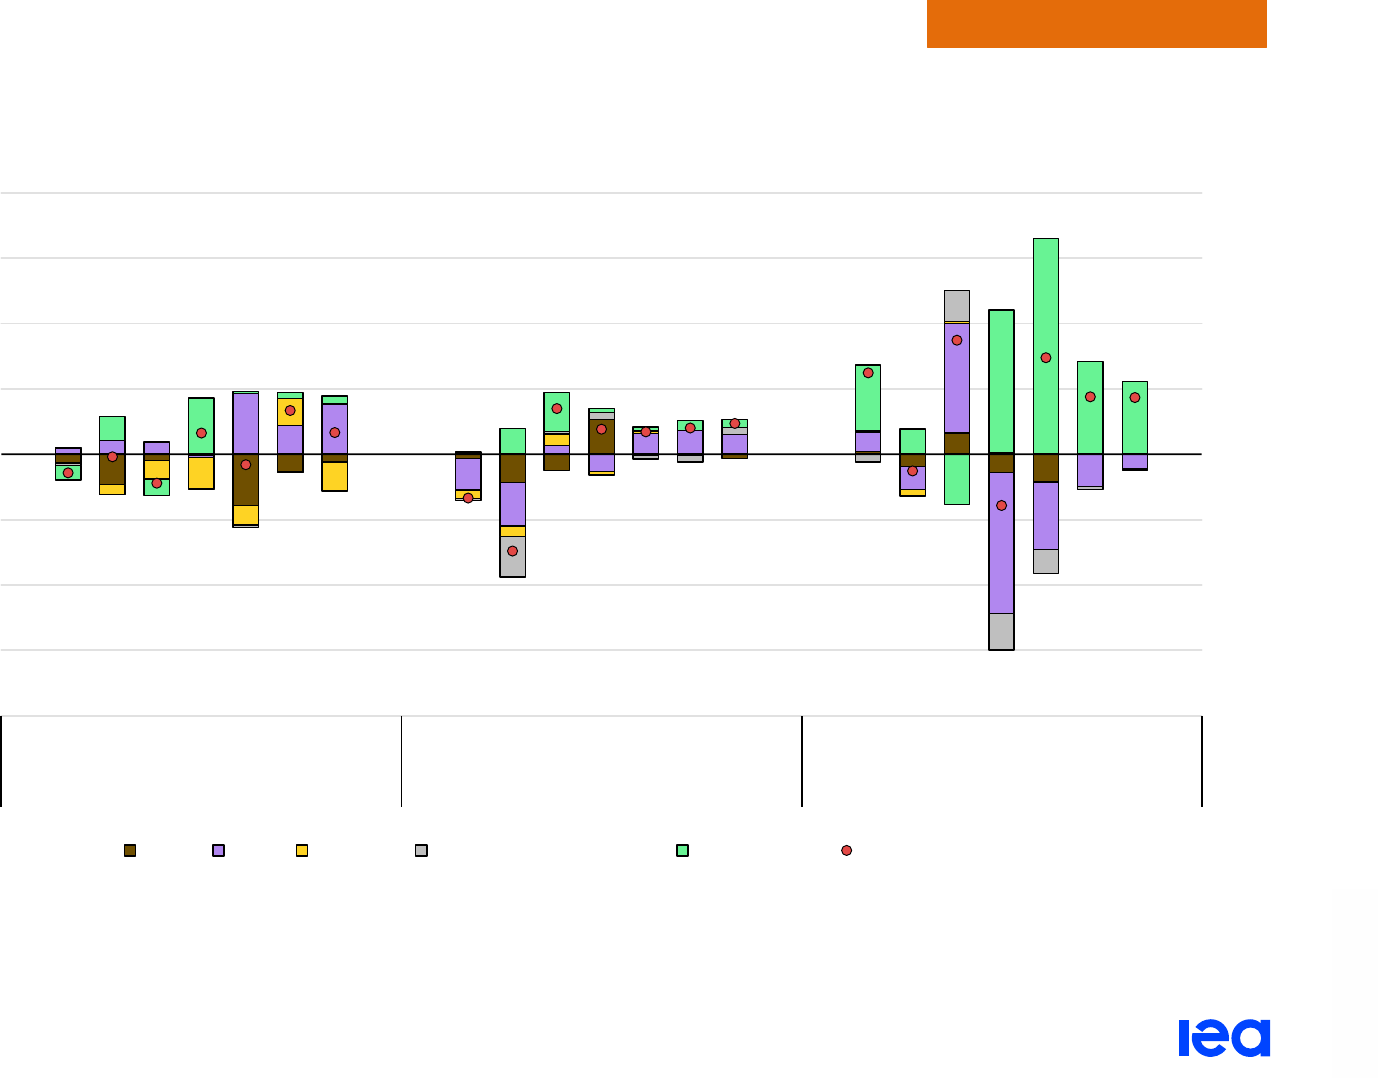
Electricity Market Report 2023
P
AGE | 72
Regional perspectives
IEA. CC BY 4.0.
While gas dominates incremental supply in Canada and Mexico, renewables expand in Brazil
Year-on-year change in electricity generation in selected countries in the Americas, 2019-2025
IEA. CC BY 4.0.
Note: Other non-renewables includes oil, waste and other non-renewable energy sources.
- 80
- 60
- 40
- 20
0
20
40
60
80
2019
2020
2021
2022
2023
2024
2025
2019
2020
2021
2022
2023
2024
2025
2019
2020
2021
2022
2023
2024
2025
Canada Mexico Brazil
TWh
Coal Gas Nuclear Other non-renewables Renewables Net change

Electricity Market Report 2023
P
AGE | 73
Regional perspectives
IEA. CC BY 4.0.
Market trends in selected other countries in the Americas
In Chile, electricity demand grew by about 2% in 2022, following the
end of lockdowns in 2021. For 2023-2025, we expect an average
annual growth of 4% in electricity demand, supported by economic
growth and increased electrification (for example, in transport).
Given the country’s coal-power phase-out plan by 2040 at the
latest, coal-fired generation is forecast to decline by an average of
more than 7% per year in 2023-2025, due to some of these plants
being decommissioned in this period (about 1 GW
). Benefiting from
its large wind and solar power potential, the decline in coal-fired
power in the coming years is more than offset by growth in
renewables. We forecast total renewable output will reach over 65%
of the country’s electricity generation mix by 2025.
Addressing concerns over renewable curtailment related to
t
ransmission bottlenecks (for example, between northern and
central regions) and increasing flexibility requirements, the Chilean
government passed a law to support energy storage development
i
n
October 2022. Additionally, a new electricity tariff stabilisation fund
law was passed in July 2022 aimed at avoiding price hikes that
would put additional pressure on households’ expenses. This
stabilisation fund was first implemented in October 2019 in the wake
of public demonstrations and social unrest.
Electricity demand in Colombia f
ell below 1% in 2020 due to public
health measures to combat the pandemic, and then recovered by
1.6% in 2021. Supported by increased economic activity, electricity
consumption rose by about 1% in 2022. Despite being a significant
hydrocarbon producer, Colombia’s renewable capacity has helped
limit fossil fuel-powered electricity to under 25% in recent years.
Renewable output could surpass 80% of Colombia’s generation mix
by 2025.
To avoid further increases in end-user electricity prices, the
Colombian government
passed three resolutions in September
2022. These allow, for example, to renegotiate some supply
bilateral contracts among market agents, optimise the operation of
thermal power plants, and to decouple price increases from the
consumer and producer price indexes. Additionally, the government
presented an
offshore wind roadmap.
Costa Rica’s electricity system is already almost fully renewable
due to high hydropower availability. After falling by 3% in 2020 amid
Covid-19-related restrictions, electricity demand grew by 5% in
2021. In 2022, consumption rose again, by 3%. Costa Rica’s
transmission system is connected to Panama and Nicaragua, as it
is part of SIEPAC (the Central American interconnected system).
Electricity trade with neighbouring countries in recent years has
usually remained under 1 TWh (less than 10% of national demand).
In order to lower electricity prices, the government of Costa Rica
signed a decree in October 2022 that will allow the state-owned
electricity ICE to buy electricity from private generators
t
hat did not
already have a contract (and many of which were not selling
electricity in recent months).

Electricity Market Report 2023
P
AGE | 74
IEA. CC BY 4.0.
Regional perspectives
Europe

Electricity Market Report 2023
P
AGE | 75
IEA. CC BY 4.0.
Regional perspectives
Renewables will lead to a sharp decline in fossil fuel-fired generation from 2023 onward
Electricity consumption in the European Union rebounded to almost
5% in 2021, in line with the economic recovery, following a
substantial year-on-year decline of 4% in 2020. The return to growth
reversed in 2022 when Russia’s invasion of Ukraine triggered an
unprecedented energy crisis, with Europe at the epicentre. As a
result of demand destruction in electricity-intensive industries,
energy saving measures and unusually mild winter, EU electricity
consumption declined by 3.5% in 2022 – its largest percent
decrease since the Great Recession in 2009, excluding the
exceptional contraction due to Covid-19 in 2020. We forecast EU
electricity demand to rebound slightly from 2023 onwards, with an
average annual growth rate of 1.4%, on expectations of lower
energy prices and the push for electrification.
The energy crisis and its wide-reaching impacts has led to a
significant shift in policy priorities in the European Union. As a
response to the crisis, the European Commission published on
18 May 2022 its REPowerEU plan
t
o reduce the EU’s dependence
on Russian fossil fuels by hastening the clean energy transition.
This was followed in December by the adoption of a
Council
regulation that will set a temporary framework to accelerate the
deployment of renewables. Record-high electricity prices also
prompted discussions on electricity market design and the
Commission
launched a consultation in early 2023 on this subject.
Short-term measures on a national scale were implemented to ease
the tight market situation and provide relief to consumers, such as
the introduction of price caps, reduction of energy taxes and
regulation of retail tariffs, among various other initiatives. To reduce
power sector gas demand and increase the security of supply over
the 2022/23 winter, several countries have brought reserve
generation capacities back online, mainly consisting of coal-fired
plants. In Germany, the operation of the remaining three reactors
has been extended until April 2023. Belgium has decided to extend
the operation of Doel 4 and Tihange 3
by ten years, to 2035.
Coal-fired generation in the European Union increased again in
2022, rising over 6%. Despite high gas prices, gas-fired supply
actually grew by about 2%, largely to offset reduced nuclear power
and low hydro output. Over 2023-2025 we expect a sharp decline in
fossil fuel-fired generation, as strong growth in generation from
renewables of 34% from 2022 levels displaces fossil generation.
Significant increases in nuclear generation occurs only after 2023,
as French plants gradually conclude their maintenance schedules.
After the more than 11% y-o-y rise in 2021 due to the post-
pandemic rebound, the 4.5% growth in 2022 was the highest
percentage growth in power generation emissions in the European
Union since the oil crises of the 1970s. While the global CO
2
intensity of power generation fell in 2022, it increased in the EU by
7% due to the higher share of coal-fired output. With the expansion
of renewables and the decline in coal- and gas-fired supply, we
forecast a decline of 28% in the EU power sector’s CO
2
emissions
by 2025 from 2022 levels, and by 31% in CO
2
intensity.
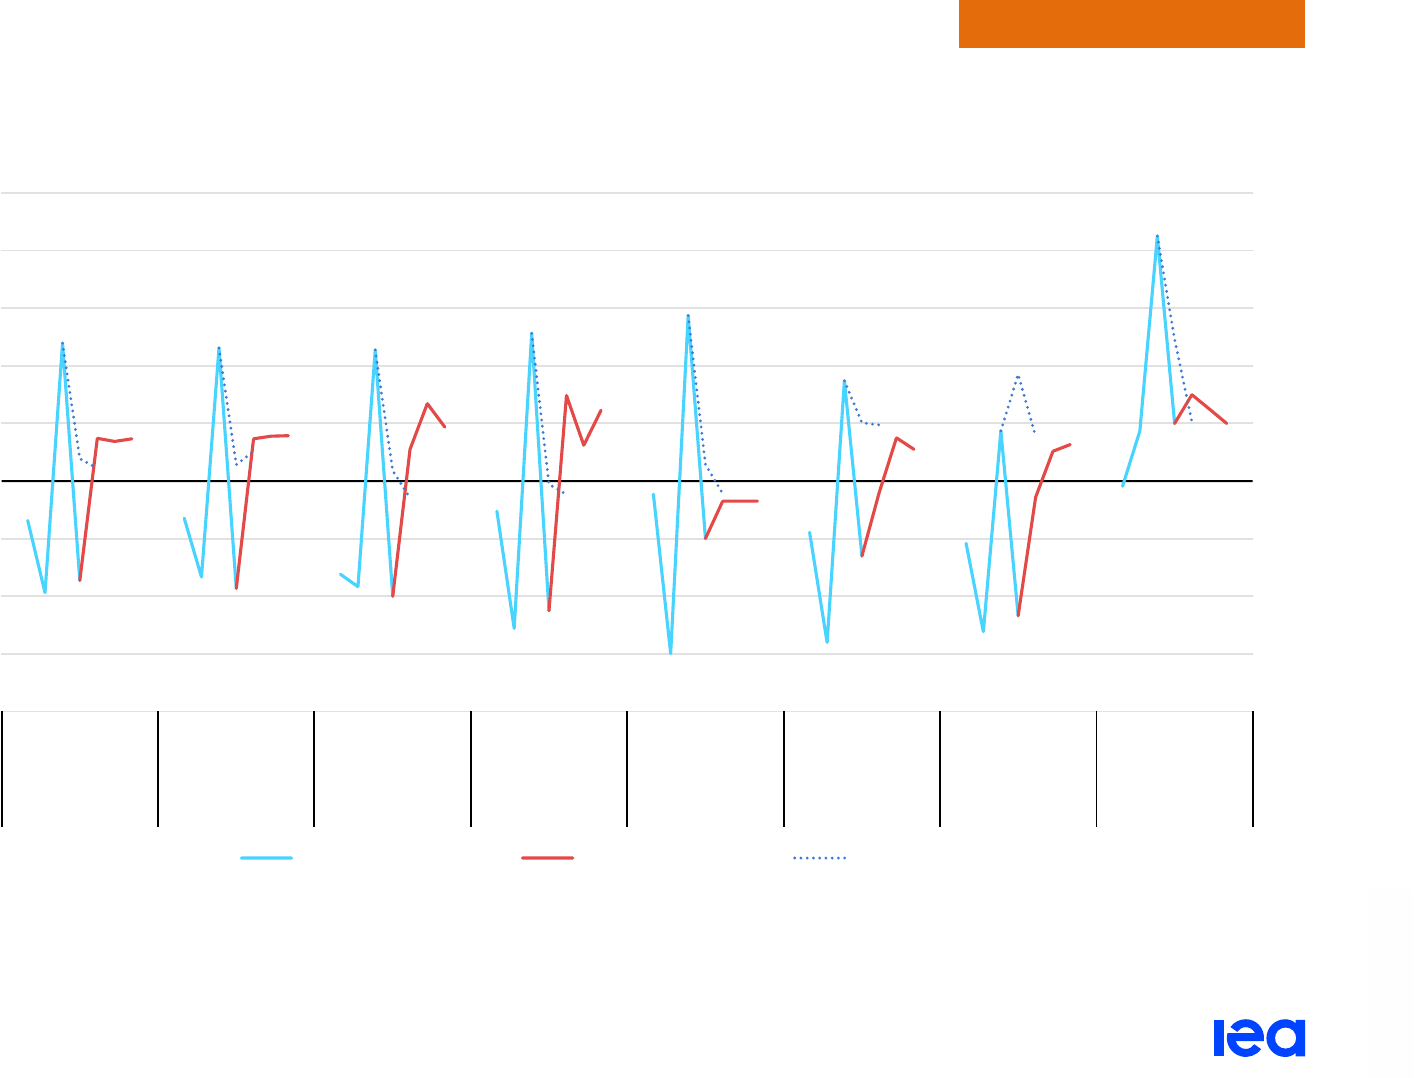
Electricity Market Report 2023
P
AGE | 76
IEA. CC BY 4.0.
Regional perspectives
After significant decline in 2022, European electricity demand is set to recover
Year-on-year relative change in electricity demand, Europe, 2019-2025
IEA. CC BY 4.0.
-8%
-6%
-4%
-2%
0%
2%
4%
6%
8%
10%
2019
2021
2023
2025
2019
2021
2023
2025
2019
2021
2023
2025
2019
2021
2023
2025
2019
2021
2023
2025
2019
2021
2023
2025
2019
2021
2023
2025
2019
2021
2023
2025
European
Union
Europe Germany France Italy Spain
United
Kingdom
Türkiye
Electricity demand growth
Historical demand Updated forecast Previous forecast (July 2022)
Electricity Market Report 2023
P
AGE | 77
IEA. CC BY 4.0.
Regional perspectives
Following two years of increases, CO
2
intensity starts to decline again from 2023 onward
Year-on-year change in electricity generation, European Union,
2019-2025
IEA. CC BY 4.0.
Development of average CO
2
intensity, Europe, 2019-2025
IEA. CC BY 4.0.
Note: Other non-renewables includes oil, waste and other non-renewable energy sources.
- 250
- 200
- 150
- 100
- 50
0
50
100
150
200
250
2019
2020
2021
2022
2023
2024
2025
TWh
Coal Gas
Nuclear Other non-renewables
Renewables Net change
0
50
100
150
200
250
300
350
400
450
500
g CO
₂/kWh
European Union Europe Germany
France Italy Spain
United Kingdom Türkiye

Electricity Market Report 2023
P
AGE | 78
IEA. CC BY 4.0.
Regional perspectives
The European Union faced a multi-crisis year in 2022 amid low nuclear and hydropower output
Year-on-year change in electricity generation by technology in the European Union, 2021-2022
IEA CC BY 4.0.
Note: Other includes oil, other renewable and other non-renewable energy sources. Generation numbers shown in this figure are net generation.
-64
-10
+38
+32
+26
+12
-84
-36
-82
- 200
- 180
- 160
- 140
- 120
- 100
- 80
- 60
- 40
- 20
0
Nuclear Hydro Other Solar Wind Coal Gas
Supply
difference
TWh
EU EU excl. France France
Electricity Market Report 2023
P
AGE | 79
IEA. CC BY 4.0.
Regional perspectives
Countries in Europe have resorted to coal to increase security of electricity supply
To enhance security of supply amid low nuclear availability and tight
gas markets, several countries in the European Union and the
United Kingdom have decided, or are discussing plans, to add
short-term conventional capacity to the market by bringing reserve
capacity back into the market or postponing closure dates, lifting
production caps and reviving idled power plants. Of the additional
capacity of about 24 GW now in place until the end of winter
2022/23, 19 GW is coal-fired, which comes on top of the existing
127 GW that would be in place without these measures. Germany
accounts for most of the additional coal-fired capacity, with almost
10 GW for the 2022/23 winter. In Netherlands, the
removal of the
35% production cap on coal-fired plants will add another 3.8 GW.
Under confirmed plans, overall coal-fired capacity will increase by
about 15% (19 GW) to 146 GW in the European Union and the
United Kingdom combined.
According to current government plans, coal-
fired power plant
capacity will fall again to about 141 GW during the 2023/24 winter
after the temporary return of capacity ends. As some of the revived
coal-fired generating capacity is idled again after winter 2022/23,
output of the French nuclear power plants are expected to start
increasing following maintenance in 2022. Nevertheless, depending
on developments in the ongoing energy crisis, further capacity
increases in European coal-fired generation is possible.
Breakdown of coal-fired capacity and capacity extensions in
selected European countries, 2022-2024
IEA. All rights reserved.
Note: The analysis is conducted with available data and information as of 30
November 2023.
Sources: IEA analysis based on ENTSOE (2022), Transparency Platform,
30 November 2022; Bruegel (2022), National energy policy responses to the energy
crisis, 30 November 2022.
127
146
141
120
125
130
135
140
145
150
Increase
Total
Decrease Increase Total
Winter
2022/23
without
capacity
additions
Winter 2022/23 Winter 2023/24
Coal-fired capacity (GW)
Other EU Denmark Finland
France Germany Netherlands
Spain Austria United Kingdom

Electricity Market Report 2023
P
AGE | 80
IEA. CC BY 4.0.
Regional perspectives
Soaring energy prices led to emergency interventions in Europe
The sharp escalation in electricity prices, starting in the second half
of 2021 and propelled higher by Russia’s invasion of Ukraine in
early 2022, compelled governments to implement measures aimed
at reducing energy prices and mitigating their impact on both
consumers and the wider economy. We explored some of these
measures in our Electricity Market Report – July 2022 Update
, such
as the EC toolbox, the introduction of exceptional taxation and the
establishment of market regulation schemes. Since then, national
governments and the European Union have introduced new
initiatives and continue with discussions on further measures to
address the crisis. These range from non-targeted support that
generally does not distinguish by the beneficent (e.g. wholesale
price regulation, VAT/energy tax reduction or retail price regulation)
to targeted programmes such as supporting vulnerable groups or
businesses.
Several initiatives are particularly noteworthy. One example is the
I
berian exception, which is a form of non-targeted support that caps
gas and coal prices for power generation in Spain and Portugal.
However, since differences in national measures might distort the
European single market, efforts have been made to coordinate the
implemented measures, such as the package with emergency plans
introduced on 30 September 2022 by European Council. This
emergency response entails introducing market revenue caps and
solidarity contributions.
The Iberian model and its consequences
In June 2022, the governments of Spain and Portugal were granted
an exemption by the European Commission
t
hat allowed them to
cap the price of gas and coal for electricity generators. The measure
started on
June 14 and will run until May 31 2023. It limits the
maximum price of gas and coal as an input to generation at
EUR 40/MWh during the first six months and then increases by
EUR 5/MWh per month before reaching EUR 70/MWh. Thus, this
measure reduces the price of electricity and limits windfall profits of
the inframarginal electricity producers. Under the measure, gas- and
coal-fired generators are paid the difference between the market
price of the fuels and the cap, financed through
congestion rents f
or
cross-border trade and an extra charge to consumers with contracts
based on regulated tariffs. The exemption was granted due to the
sufficient availability of gas in the region thanks to its ample LNG
regasification capacities, and also because the potential impact on
the EU internal power market would be limited by its marginal
interconnection with the rest of Europe .
The Iberian model has succeeded in lowering electricity prices in
S
pain but, at the same time, it has had various other consequences.
The price cap led to an increase in gas consumption
in Spain. At the
same time, lower Spanish wholesale prices as also led to increased
and relatively cheaper power exports to neighbouring countries,

Electricity Market Report 2023
P
AGE | 81
IEA. CC BY 4.0.
Regional perspectives
which benefited Portuguese
2
, Moroccan, and especially French
consumers. This caused distortions in the EU internal electricity
market, as well as in Iberian spot and futures markets. These
issues, while important, were limited in scope due to the low level of
interconnection between Spain and the rest of Europe.
Coordination package by the European Council
On 30 September 2022, the Council reached an agreement on a set
of emergency market interventions. Thanks to this agreement, a
Council Regulation on emergency interventions to address high
energy prices was published on 6 October. These measures, which
are deeper and broader than previous interventions at the European
level, are a new attempt of controlling the price surge, addressing
both the supply and demand sides.
These temporary measures on the electricity markets include a
bi
nding demand reduction of 5% during selected peak hours and a
cap on market revenues for inframarginal technologies set at a
maximum of EUR 180/MWh. This revenue cap is applicable for the
period between 1 December 2022 and 30 June 2023. As the
measures are being implemented at the national level, it is too soon
to assess their effects, and key aspects of the implementation
remain to be clarified. Some countries (e.g. France, Belgium
an
d
the Netherlands) decided to set the market revenue cap below the
maximum level, for instance, and in the case of the Netherlands at
2
The benefit to Portugal is due to a bigger share of Portuguese consumers with fixed contracts
and so less contribution to compensating gas generators.
EUR 130/MWh. Particularly, the interaction between the revenue
cap for inframarginal generators and forward markets, where many
of these generators may have already sold their energy, will be key
for the success of the measure.
A temporary solidarity contribution (in place until June 2023) was
also introduced, which entails additional taxation of at least 33%
of
the excess profits received by companies active in the petroleum,
natural gas, coal and refinery sectors during 2022. The solidarity
measure aims at capturing windfall profits without modifying the
market price, and therefore without distorting the operation and
clearing of the markets. The implementation of the solidarity
contribution mechanism is not uniform across the EU member
states. Some EU member countries, such as the Czech Republic,
Greece and Italy, have set their rates much higher at 60%, 90% and
50%, respectively, than the reference rate of 33%. The Czech
government also extended the solidarity tax not only to energy
companies, but also
to some banks. S
imilarly, Spain imposed this
tax, which was originally targeted at energy companies, to some
domestic banks.
Disparity in magnitude of support across Europe
The vast majority of countries in the European Union introduced
some form of business support. However, the targeted direct
financial supports and retail price measures differ significantly

Electricity Market Report 2023
P
AGE | 82
IEA. CC BY 4.0.
Regional perspectives
among the member countries. As a result, the heterogeneity of the
implemented relief measures may lead to discrepancies in the
prices perceived by industrial consumers among European
countries, harming competition.
The German industry support scheme is a part of a EUR 200 billion
energy relief plan (called Economic Defence Shield), of which
EUR 25 billion will be dedicated to the industrial scheme.
Consequently,
electricity tariffs for industrial consumers will be
capped at EUR 130/MWh for 70% of their 2021 consumption (to
motivate electricity savings) whereas the cap for residential
consumers was set at EUR 400/MWh for 80% of the 2021
consumption. In Spain,
over EUR 500 million has been dedicated to
shielding large industrial consumers. Additionally, a plan was
introduced to decrease the transmission and distribution network
fees paid by electricity-intensive industries.
The total magnitude of the financial resources dedicated to shielding
hous
ehold and industrial consumers also differ widely among
European countries. For example, while the German energy support
scheme was above 7% of the German GDP
, the subsidies in
Sweden amount to less than 0.3% of its GDP.
Shielding residential consumers via support measures
In a large majority of countries in the European Union as well as
Norway and the United Kingdom, reductions in energy taxes or VAT
were introduced. Similarly, many countries strengthened financial
transfers to vulnerable consumers. Sixteen member states of the
European Union introduced retail price regulations. Some of the
introduced measures incentivise energy consumers to reduce their
consumption while others do not, which then act as consumption
subsidies. To illustrate, the Greek government implemented an
across-the-board
relief package w
hich subsidises consumption
based on the end-user. In this scheme, households can receive up
to EUR 436/MWh (industrial consumers can receive up to
EUR 398/MWh). In Norway, a subsidy scheme was
introduced to
cover exposed industrial consumers: those with more than 3% of
their costs spent on electricity will be compensated 25% of the
electricity rate if it exceeds a threshold of about EUR 68/MWh.
The implementation of support measures in Europe have helped
dam
pen the effects of the current crisis on residential electricity
prices. Based on VaasaETT's analysis of selected European capital
cities, the measures by governments have prevented on average a
14% price spike in new household electricity contracts in 2022,
considering estimates of mean annual prices with and without
measures.
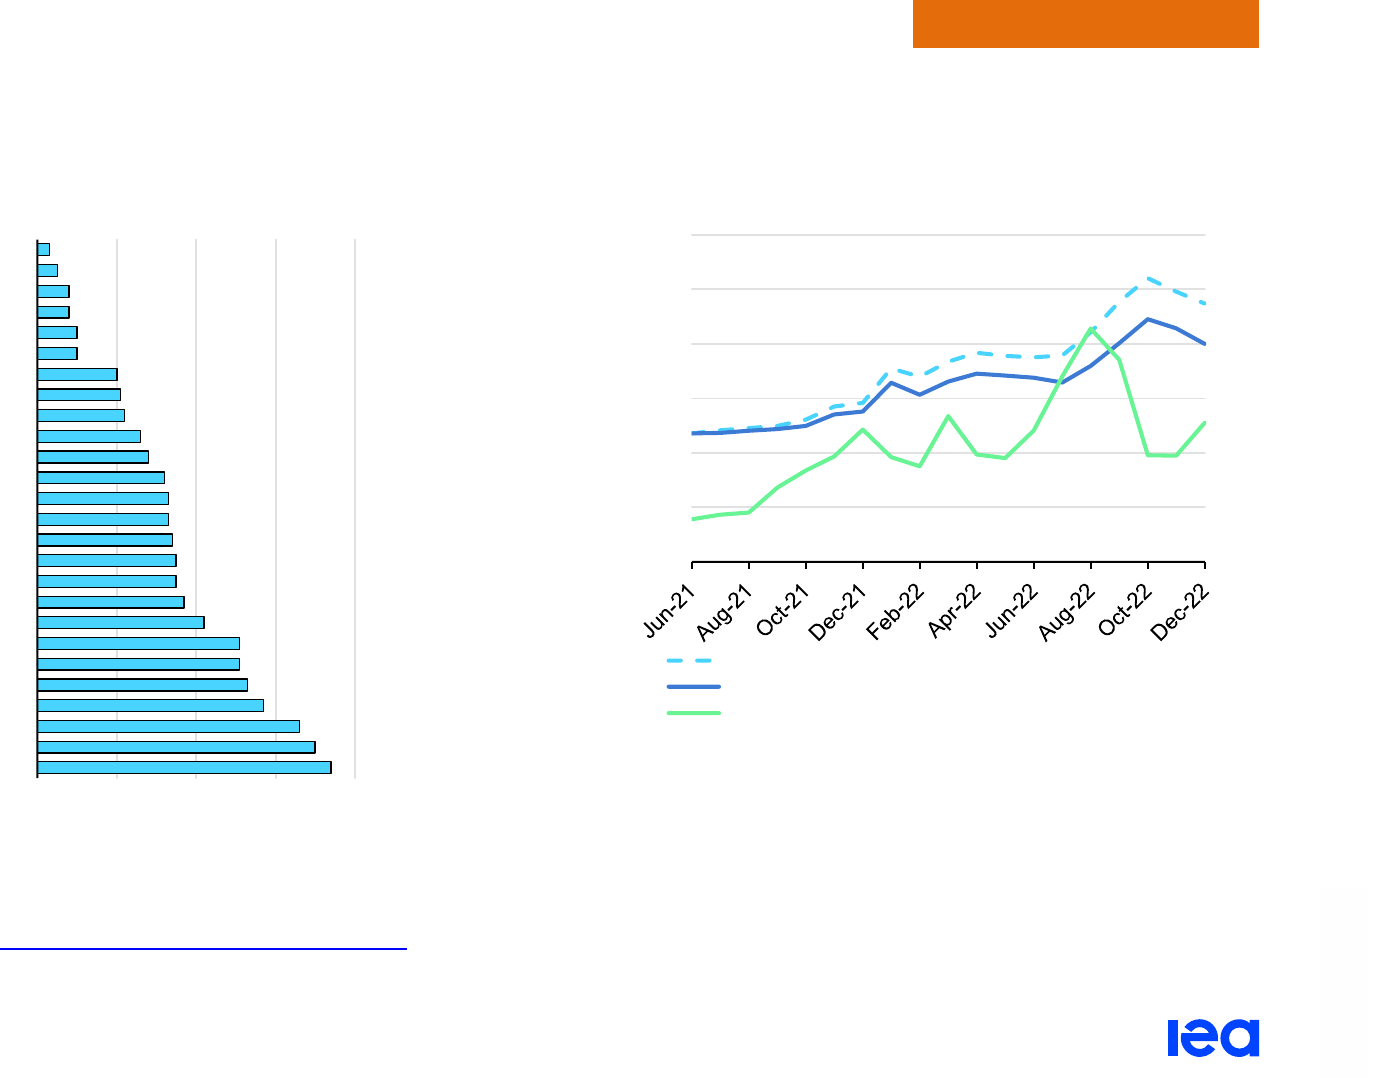
Electricity Market Report 2023
P
AGE | 83
IEA. CC BY 4.0.
Regional perspectives
Support measures in Europe helped dampen the impact of high prices on consumers
Magnitude of support schemes to residential and industrial
consumers in the European Union, Norway and the United
Kingdom, September 2021- November 2022
IEA. All rights reserved.
Note: Data based on a percentage of GDP in the European Union, Norway and the
United Kingdom.
Source: Bruegel (2022), National fiscal policy responses to the energy crisis,
3 December 2022.
Representative household prices including and excluding support
schemes in the European Union, June 2021 to December 2022
IEA. All rights reserved.
Notes: The household price analysis focuses on general measures affecting typical
consumers and selected capital cities which have applied such measures during the
period analysed. Electricity demand-weighted wholesale price for the following EU
countries: Austria, Croatia, Czech Republic, France, Finland, Germany, Italy, Poland,
Romania, Slovak Republic, Slovenia, and Spain. Household prices consider new tariff
offers.
Source: Based on data and analysis provided by VaasaETT (2023), © 2023
VaasaETT Ltd.
0% 2% 4% 6% 8%
Germany
Malta
Lithuania
Greece
Bulgaria
Italy
Netherlands
Croatia
Slovakia
United Kingdom
Romania
Czech Republic
Luxembourg
Portugal
Latvia
France
Austria
Poland
Denmark
Norway
Slovenia
Estonia
Belgium
Cyprus
Finland
Sweden
Support scheme (% of 2021 GDP)
0
100
200
300
400
500
600
EUR/MWh
Household price (excluding support schemes)
Household price (including support schemes)
Weighted-average wholesale price
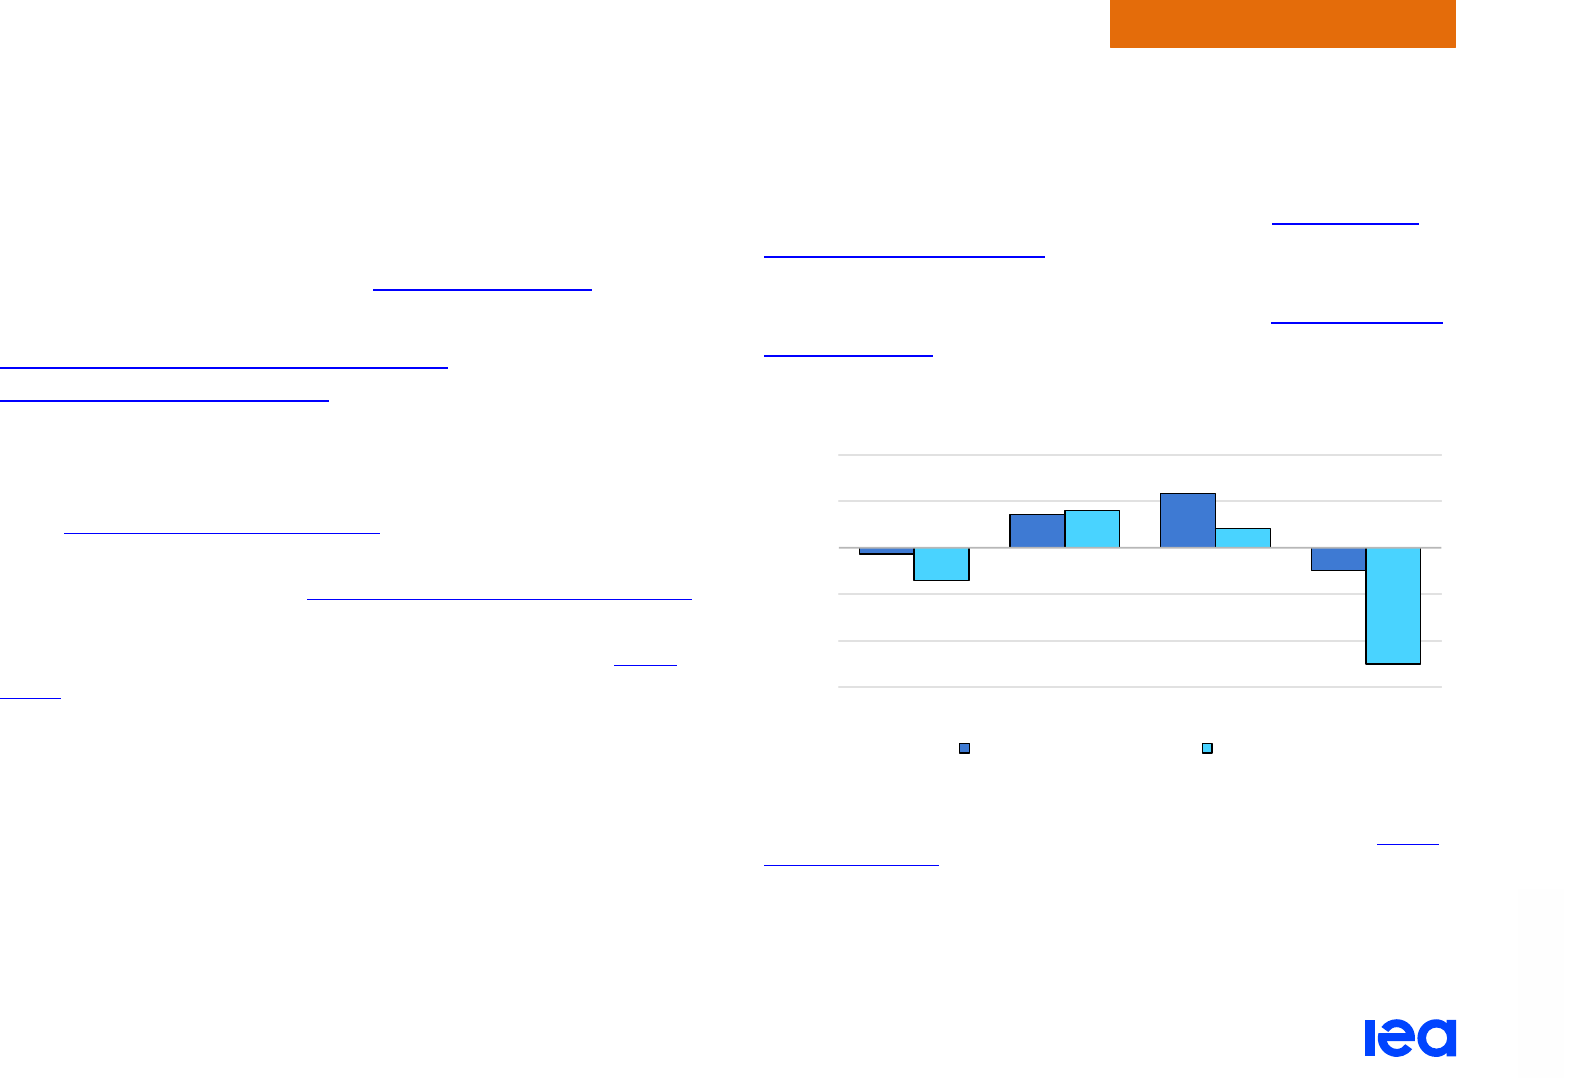
Electricity Market Report 2023
P
AGE | 84
IEA. CC BY 4.0.
Regional perspectives
European electricity-intensive industries decrease their production
Exceptionally high prices are having a significant impact on some
industrial sectors with high electricity use, which has led to a
sharper drop in national electricity consumption. Among energy-
intensive industries (e.g. chemical, iron and steel, non-ferrous metal
production, paper mills, and others), aluminium production
s
eems to
be hit the hardest by steep electricity prices in Europe.
Permanent downsizing of European BASF’s c
apacities due to high
natural gas and electricity prices underscore concerns about
declining competitiveness of European production. Similarly, non-
ferrous metal producers have voiced their concerns over continuing
operations with the current energy prices. For example, in August
2022,
aluminium smelters in Slovakia hal
ted their production until
energy prices reach acceptable levels. The largest aluminium
producer in Germany, Trimet,
decreased production in multiple sites
due to the high energy prices, with the production capacity in Essex
halved in March 2022. Stainless steel production stopped in
fifteen
plants across the European continent. Thus, some metal producers
have requested to be shielded by political interventions. However,
metal producers are also hit by a decrease in demand caused by
slowing economic activity. Hence, the current crisis is affecting both
the demand and supply sides.
After the Russian invasion of Ukraine, not only were European
m
etal producers hit by soaring energy prices, but metal supply
chain issues also occurred due to the decline of Ukrainian metal
production. As a result of the tight supply and increasing production
costs for metals in Europe, China is turning into a
metal exporter
from being a metal importer. However, higher European reliance on
critical raw material imports also raises environmental concerns, for
instance in China, where aluminium production is
three times more
carbon-intensive than in Europe.
Year-on-year growth rate of primary aluminium production in
selected regions, 2022 and 2017-2021 average
IEA. All rights reserved.
Note: See the IAI website for the country groupings for the shown regions.
Source: IEA analysis based on International Aluminium Institute (IAI) (2022),
Primary
Aluminium Production, 1 December 2022.
-15%
-10%
-5%
0%
5%
10%
North America China Asia excl. China Western &
Central Europe
Average 2017-2021 2022

Electricity Market Report 2023
P
AGE | 85
IEA. CC BY 4.0.
Regional perspectives
Germany
Germany’s electricity demand declined by 4% in 2022 amid higher
prices, public calls to save energy
and a
n exceptionally mild winter.
Renewable power generation rose 9% from 2021, when it was
lower than average due to reduced wind speeds. The expansion of
renewable capacity also continued in 2022. In particular,
solar
power installation accelerated, driven by private investments in the
wake of high electricity prices.
Low water levels on the Rhine dur
ing the summer of 2022 disrupted
the transport of coal to plants located along the river, causing a
reduction in their output during the period. Despite this, and the
growth in renewable generation, coal-fired power generation in
Germany increased by more than 10%. for the second year in a row
in 2022, lifting the power sector’s coal use above 2019 levels.
Several factors contributed to this. The natural gas supply shortage
in Europe, resulting in high gas prices, made coal a comparatively
cheap source of electricity. At the same time, low availability of
nuclear power plants in France led to higher imports from Germany
in 2022. Nevertheless, coal fired-generation in Germany was still
much lower (-20%) than its average during the period 2015-2019.
Germany activated a gas replacement reserve f
rom fossil fuel
power plants that are not gas-fired on 13 July 2022. This includes
4.3 GW of hard coal and 1.6 GW of oil-fired plants until
31 March 2024, which were previously put in grid reserve. In
addition, about 1.9 GW of lignite-fired capacity – originally planned
to be decommissioned by 1 October 2022 – was brought back
from the security readiness reserve. These plants will remain
operational until 30 June 2023.
A further 2.2 G
W of hard coal-fired plants that was slated to be
decommissioned by 31 October 2022 according to the auctions
under the Act of Phasing Out Coal-fired Power Stations
and about
0.5 GW of hard coal capacity that would similarly be
decommissioned by 1 July 2023 have had deadlines extended until
31 March 2024. Additionally, 1.2 GW of lignite-fired capacity that
would have to be decommissioned by 31 December 2023 will also
be extended until 31 March 2024.
Germany’s remaining 4.1 G
W of nuclear capacity, initially set to be
shut down at the end of 2022, was put in emergency reserve
instead, allowing it to run during the winter until April 2023.
However, the plants will not be refuelled and therefore have a
reduced total output of an estimated 5 TWh for the duration of the
extension. In 2022, nuclear power provided about 6% of Germany’s
total electricity generation.
In 2023,
we expect coal-fired generation to increase another 4%, as
more of the reserve capacity will be operational while gas prices are
set to remain high. Renewables are set to grow strongly by 12%,
while gas-fired generation similarly records a sharp decline of 15%.
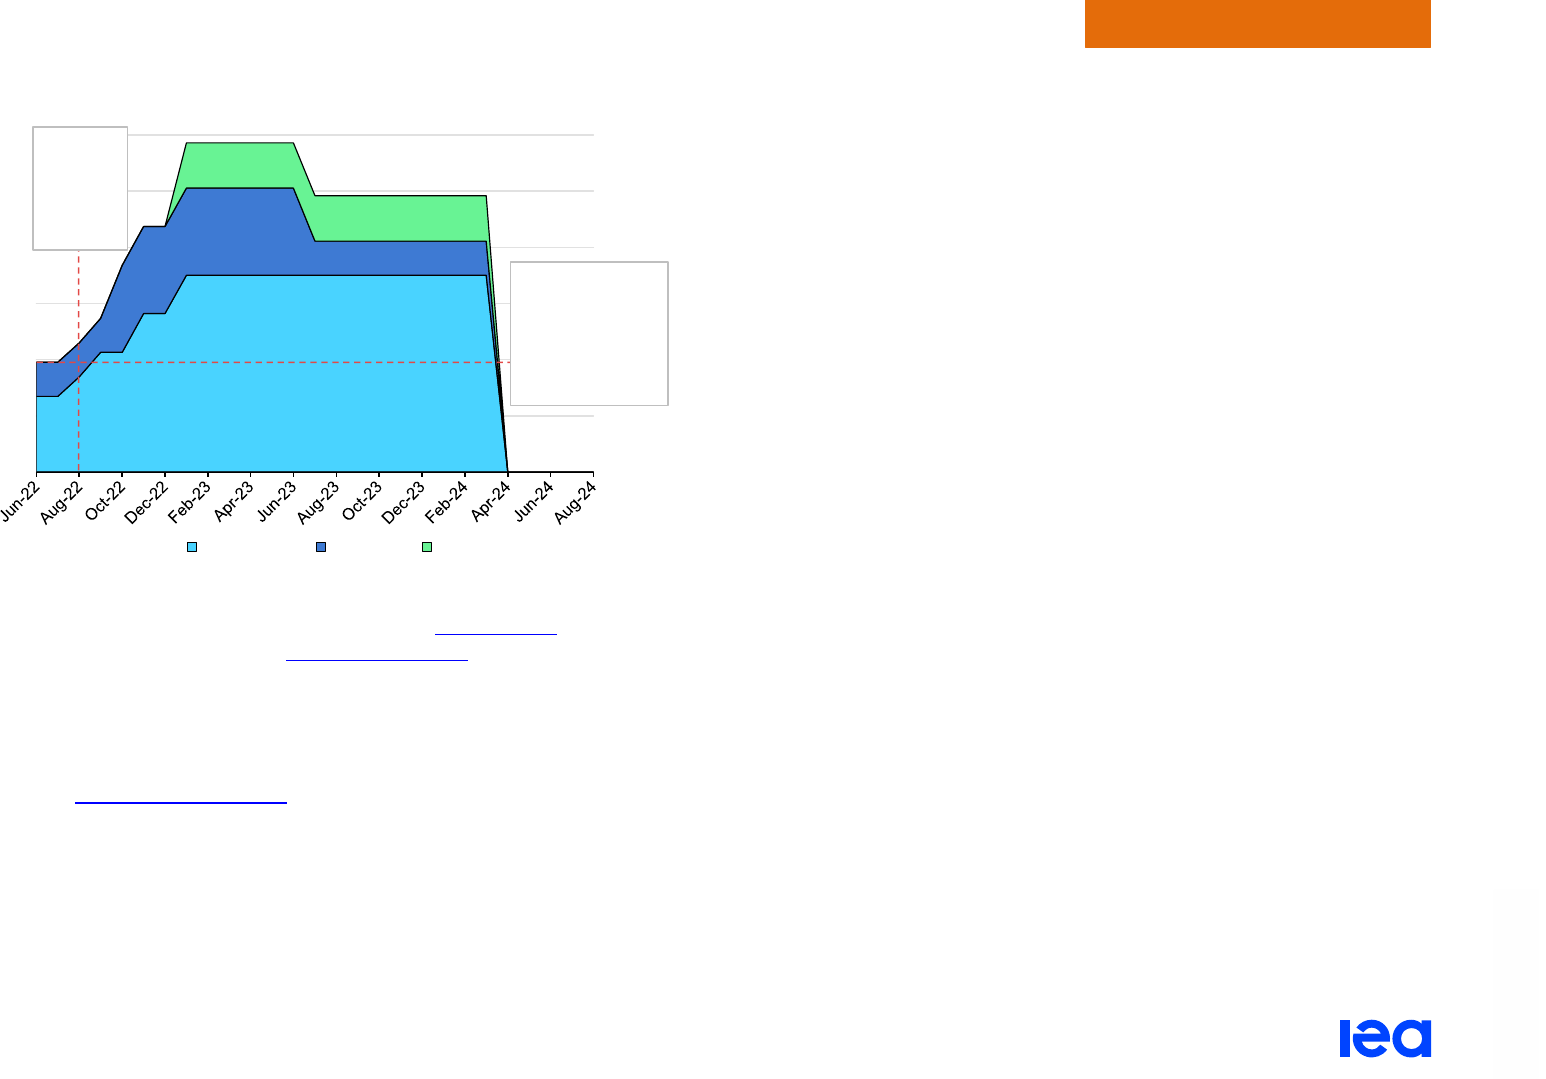
Electricity Market Report 2023
P
AGE | 86
IEA. CC BY 4.0.
Regional perspectives
Evolution of the German gas replacement reserve, 2022-2024
IEA. All rights reserved.
Source: IEA analysis based on data from BNetzA (2022), Power plant list
,
15 December 2022; ENTSO-E (2022), Transparency Platform, 15 December 2022.
In 2024-2025, we expect Germany to fully return to its coal phase-
out plan and, hence, coal-fired power generation to decline. By
then, renewable power generation is forecast to grow significantly,
driven by increased renewable
t
argets, reduced bureaucratic
hurdles and high energy prices. The government aims to install a
total of 38 GW of solar capacity, 19 GW of onshore wind and
3.5 GW of offshore wind capacity from 2023 to 2025. Acceleration
of the permitting procedures and grid build-out will be important
factors to achieve these targets. While our forecast shows Germany
will likely continue to be a net exporter of electricity also in 2023
after 2022, the likelihood increases significantly that it switches from
being a net exporter of electricity to a net importer from 2024
onward.
France
After posting a 5% recovery in electricity demand back to pre-
pandemic levels (475 TWh) in 2021, demand declined by 4.5% in
2022. This was principally driven by higher energy prices amid the
energy crisis in Europe and – despite lawmakers approving a 4%
annual price increase cap on electricity bills in 2022 – as well as by
the mild winter.
Total electricity generation fell by a sharper 15% (-83 TWh) in 2022,
where nuclear reactors produced almost a quarter less (-87 TWh)
than the year before, slightly offset by a 30% increase (+9.5 TWh)
in gas-fired power generation. France also became a net importer of
electricity for the first time in more than two decades, to cover about
4% (18 TWh) of its needs. Power generation from renewables
decreased by 4% in 2022, due to lower hydropower generation than
in 2021.
France’s supply imbalance stems from the nuclear fleet undergoing
continuous maintenance work since 2014, slowed further by safety
obligations in 2020-2021 and exacerbated by corrosion problems
that led to longer maintenance and unplanned shutdowns of 12
additional reactors (about 15 GW). This represents about 17% of
the peak load observed in 2021. In November 2022, out of the 56
total nuclear reactors, 26 were offline. Above average temperatures,
0
2
4
6
8
10
12
GW
Hard coal Lignite Oil
3.9 GW of already
operational lignite
and hard coal
capacity have their
decommissioning
dates extended to
31 March 2024
Activating
plants
from the
reserve
started in
Aug 2022

Electricity Market Report 2023
P
AGE | 87
IEA. CC BY 4.0.
Regional perspectives
along with droughts and heat waves, further magnified the electricity
generation shortfall by creating cooling issues at nuclear reactors
and markedly lowering hydroelectricity output, with reserves
depleted in 2022 to below historical lows.
Several recent developments in France are set to improve its
demand-supply balance in the 2023-2025 period. The country is
aiming to reduce its primary energy consumption
10% by 2024
compared to 2019, with emergency measures announced during
the summer to both accelerate the development of renewable
sources of electricity and to enhance energy security. France’s first
commercial-scale offshore wind farm, with a capacity of 480 MW,
became fully operational in November 2022. Additionally, the coal-
fired power station Saint-Avold (0.5 GW) was temporarily restarted
in November 2022 to boost winter electricity supplies.
In 2023, despite the setbacks experienced by EDF in restarting all
of
its reactors in 2022, nuclear power is expected to reach a gross
output of 326 TWh (+11% y-o-y). Power generation from fossil-fired
sources is expected to decrease by more than 40%, down to
33 TWh. A 7% growth in French power generation is expected, with
a decline in imports. Start of operation of Flamanville 3 is expected
to be delayed to Q4 2024
.
On top of the 10% primary energy consumption decrease target by
2024, the French government’s longer-term objective is to be
carbon-neutral by 2040 with a
40% reduction in energy
consumption.
Italy
Italy’s electricity consumption fell by 2% year-on-year in 2022.
All-time high electricity prices weighed on industrial and commercial
activity, resulting in slower GDP growth which in turn slowed
electricity consumption. In addition, milder temperatures in Q4 2022
reduced space heating requirements in the residential and
commercial sectors. Energy efficiency improvements and slower
economic growth are set to weigh on electricity consumption going
forward. Italy’s electricity demand is set to fall at an average annual
rate of 1% in 2023-2025, and it is not expected to recover to 2022
levels throughout this period.
Dry weather led to a steep drop in Italy’s hydropower generation in
2022, down by 35% (-16 TWh) compared to 2021. Wind power
generation fell y-o-y by 3%. This was only partly compensated for
by higher solar PV generation, increasing by 11% (+3 TWh). Lower
renewables output contributed to higher thermal generation. Coal-
fired generation rose by 50% (+8 TWh), while gas-fired electricity
decreased by 2% (-2 TWh) compared to 2021.
We expect renewable output to rise by 20% (+20 TWh) by 2025
compared to 2021 levels. This will be primarily driven by strong
growth in solar PV. Lower electricity use, together with rapidly
expanding renewables, will reduce Italy’s reliance on thermal
power. Coal is set to be phased out by 2025, while gas-fired
generation is expected to fall at an average rate of 4.5% per year
between 2023 and 2025.

Electricity Market Report 2023
P
AGE | 88
IEA. CC BY 4.0.
Regional perspectives
Spain
Electricity demand in Spain increased by 3.5% in 2021, but was still
below 2019 pre-pandemic levels. However, electricity demand fell
by 2.6% to about 243 TWh in 2022, mainly due to demand
destruction related to high prices.
Despite this, power generation in 2022 increased by 6% (+16 TWh)
year-on-year, surpassing 285 TWh. Royal Decree-Law 10/2022,
also known as the "gas cap" or "Iberian exception", entered into
force on 15 June following its presentation to the European Council
on 26 March. In 2022, the Iberian exception has resulted in Spain
achieving lower wholesale prices at the expense of increasing
electricity exports, and boosting gas-fired generation by about 25%
(+18 TWh) above 2021 levels.
Coal-fired power generation rose by about 50% (+3 TWh), in 2022,
but still accounted for only 3% of electricity generation. Power
generation from solar PV increased by about 23% y-o-y (+5 TWh) in
2022. Solar PV reached an installed capacity of 20 GW, surpassing
hydro as the technology with the third-highest installed capacity. An
unusual event was seen this year, with a sharp drop in solar PV
electricity output in March due to the haze coming from the Sahara
Desert that affected the Iberian Peninsula. This led to a decrease of
14% (-0.2 TWh) compared to the same month of the previous year.
At the same time, record drought in Spain
dec
reased hydro
generation by more than 30% y-o-y in 2022. The aforementioned
cap on gas prices resulted in a further y-o-y decline in power
generation from CHP plants by 23% (-3 TWh), considering the
January-August 2022 period, since these facilities were not eligible
for the cap until an
announcement from the Spanish Government on
6 September.
Another series of measures, included in the recent More Energy
Security Plan, have been taken to better protect consumers,
including electricity-intensive industry, whose access charges have
been
reduced by 80%. Additionally, there has been a temporary
reduction of VAT for gas prices from 21% to 5% as well as the
creation of a new mechanism to manage demand in the event of
excess electricity consumption.
We expect electricity use to decrease by about half a percent during
2023,
before growth recovers to 1% annually in both 2024 and
2025. During that three-year period, we forecast total renewable
output to increase by over 15% annually, together with a moderate
rise in electricity imports. As a consequence of lower utilisation
rates for thermal generation plants due to higher renewable output
and lower gas-fired exports, CO
2
emissions will drop by close to
60% in 2025 compared to 2022 levels.
United Kingdom
After increasing by 1.7% in 2021, electricity consumption in the
United Kingdom declined by almost 5% in 2022, driven by energy
saving measures, high energy prices, sluggish economic growth,
and milder temperatures. 2022 saw a year-on-year decline of coal-
fired power (-20%), whereas gas rose 3% and nuclear increased by
2%. Renewable generation grew by 6%.

Electricity Market Report 2023
P
AGE | 89
IEA. CC BY 4.0.
Regional perspectives
Concerns for security of electricity supply over the winter led system
operator National Grid ESO to take a number of actions. In August it
secured emergency contracts
t
o keep coal-fired plants available
during the winter months. In early October 2022, they warned
consumers about
winter power outage risks i
n a worst-case
scenario. Later in the month, they announced financial incentives
for consumers to shift their electricity consumption.
In 2022, the United Kingdom also became a net electricity exporter
on an ann
ual basis for the first time on record, which accounts for
the positive net change in higher generation despite a decline in
domestic demand. Continental Europe increased purchases of
wholesale power from the United Kingdom to offset sharply lower
European nuclear and hydro power output in 2022 and also to take
advantage of cheaper UK wholesale electricity prices. UK prices
were relatively lower as comparatively lower gas prices than in
continental Europe due to excess regasification capacity fuelled
higher gas-fuelled generation, and combined with record-breaking
renewable electricity, supported exports. As a result, the United
Kingdom became a net electricity exporter in Q2 2022, which was
the first quarter with net exports in 12 years, with flows particularly
strong to France. Later in 2022, during September, the United
Kingdom sent exports to Norway, which was affected by low hydro
availability. By the end of 2022, the United Kingdom had a total net
export balance of about 5 TWh.
As of October 2022, Great Britain’s
interconnector capacity stands
at 8.4 GW (4 GW with France, 1.4 GW with Norway, 1 GW with
Belgium, 1 GW with the Netherlands, 500 MW with Ireland and
500 MW with Northern Ireland). However, the UK-France IFA1
interconnector (2 GW nominal capacity) suffered fire damage in
September 2021, which left it operating at partial capacity. After
repair works, the interconnector began to operate again at full
capacity by the end of January 2023.
Great Britain continues to strengthen its electricity interconnections,
w
ith capacity set to almost double by 2025
. Capacity is set to reach
almost 16 GW, with the commissioning of interconnectors both with
Germany and Denmark (1.4 GW each), and additional capacity with
France (2.8 GW), Ireland (0.5 GW) and Norway (1.4 GW).
For the 2023-2025 period, we forecast electricity consumption in the
U
nited Kingdom to grow by around half a percent per year on
average. We expect demand to decline in 2023 with a slight
recovery in 2024 and 2025. In these three years, electricity
generation from gas and nuclear energy is expected to decline. Due
to high gas prices, coal-fired generation is forecast to remain at just
above 5 TWh in 2022 and 2023 (less than 2% of the electricity mix),
then drop to almost zero by 2025. Finally, from 2023 to 2025,
renewable output is expected to grow by an average of more than
10%, led by wind and solar PV power additions, supported by the
Energy Security Strategy
.
In 2022, the United Kingdom launched a consultation for the Review
of Electricity Market Arrangements with the aim of ensuring the UK
power market is fit for purpose to support the national goal of a fully
decarbonised power supply by 2035.

Electricity Market Report 2023
P
AGE | 90
IEA. CC BY 4.0.
Regional perspectives
Republic of Türkiye
Türkiye’s electricity demand rose by 2% (+6 TWh) year-on-year in
2022. This was supported by strong GDP growth of 7.5% y-o-y in
the first half of 2022 and an estimated 5.5% for the full year. The
country’s electricity demand is expected to increase at an average
rate of close to 2.5% per year over the 2023-2025 period, supported
by expanding economic and industrial activity.
Following the drought of 2021, Türkiye’s hydropower output rose by
20% (+11 TWh) in 2022, recovering close to its 2020 levels. Wind
and solar generation expanded by 12% (+4 TWh) and 80%
(+1.2 TWh), respectively. As a consequence, the share of
renewables in total power generation rose to 42% compared to 35%
in 2021. Higher renewables-based generation weighed on thermal
power, although gas- and coal-based generation posted differing
results. The rapid increase in natural gas import prices led to gas-
to-coal switching dynamics in the power sector. While gas-fired
power generation fell by over 25% (-27 TWh) in 2022, coal-fired
output rose by 8% (+8 TWh) in 2022 compared to the previous
year. Improved hydro availability allowed Türkiye to export close to
2 TWh of electricity into neighbouring markets. By contrast, the
country imported about 2 TWh in 2021.
Türkiye announced at COP27 that it
increased its 2030 emissions
reduction target from 21% to 41%. We forecast that Türkiye’s power
generation will increase at an average rate of 2.5% per year over
the 2023-2025 period. Renewable generation is expected to
increase by almost 30% by 2025 compared to 2022, and will
account for almost half of the power generation mix. The first
reactor of the Akkuyu Nuclear Power Plant is expected to be
commissioned by the end of 2023 and gradually ramp up production
through 2024-2025. Fossil-based thermal generation is forecast at
15% below its 2022 levels by 2025. Over the 2023-2025 period,
coal- and gas-fired generation are expected to decline by an
average rate of 8% and 3% per year, respectively, reducing the
emission intensity of Türkiye’s power sector.
Ukraine
Since the invasion of Ukraine by Russia in February 2022,
electricity consumption has plummeted. It was cut by one-forth
within a week and by 40% two months later. Demand profiles
clearly highlight both the start of the war on 24 February and the
intensification of missile strikes on Ukraine since 10 October
, w
hich
led to massive destruction of infrastructure and power outages.
Between March and end October 2022, electricity consumption fell
by about 30% year-on-year.
The s
ecurity of Ukraine’s nuclear facilities almost immediately
became a serious issue after the invasion, in particular for the 6 GW
Zaporizhzhia nuclear power plant, whose grid connection was lost
on multiple occasions since the Russian army attack on 3
March.
The plant stopped injecting power into the Ukrainian power grid on
25 August 2022
.
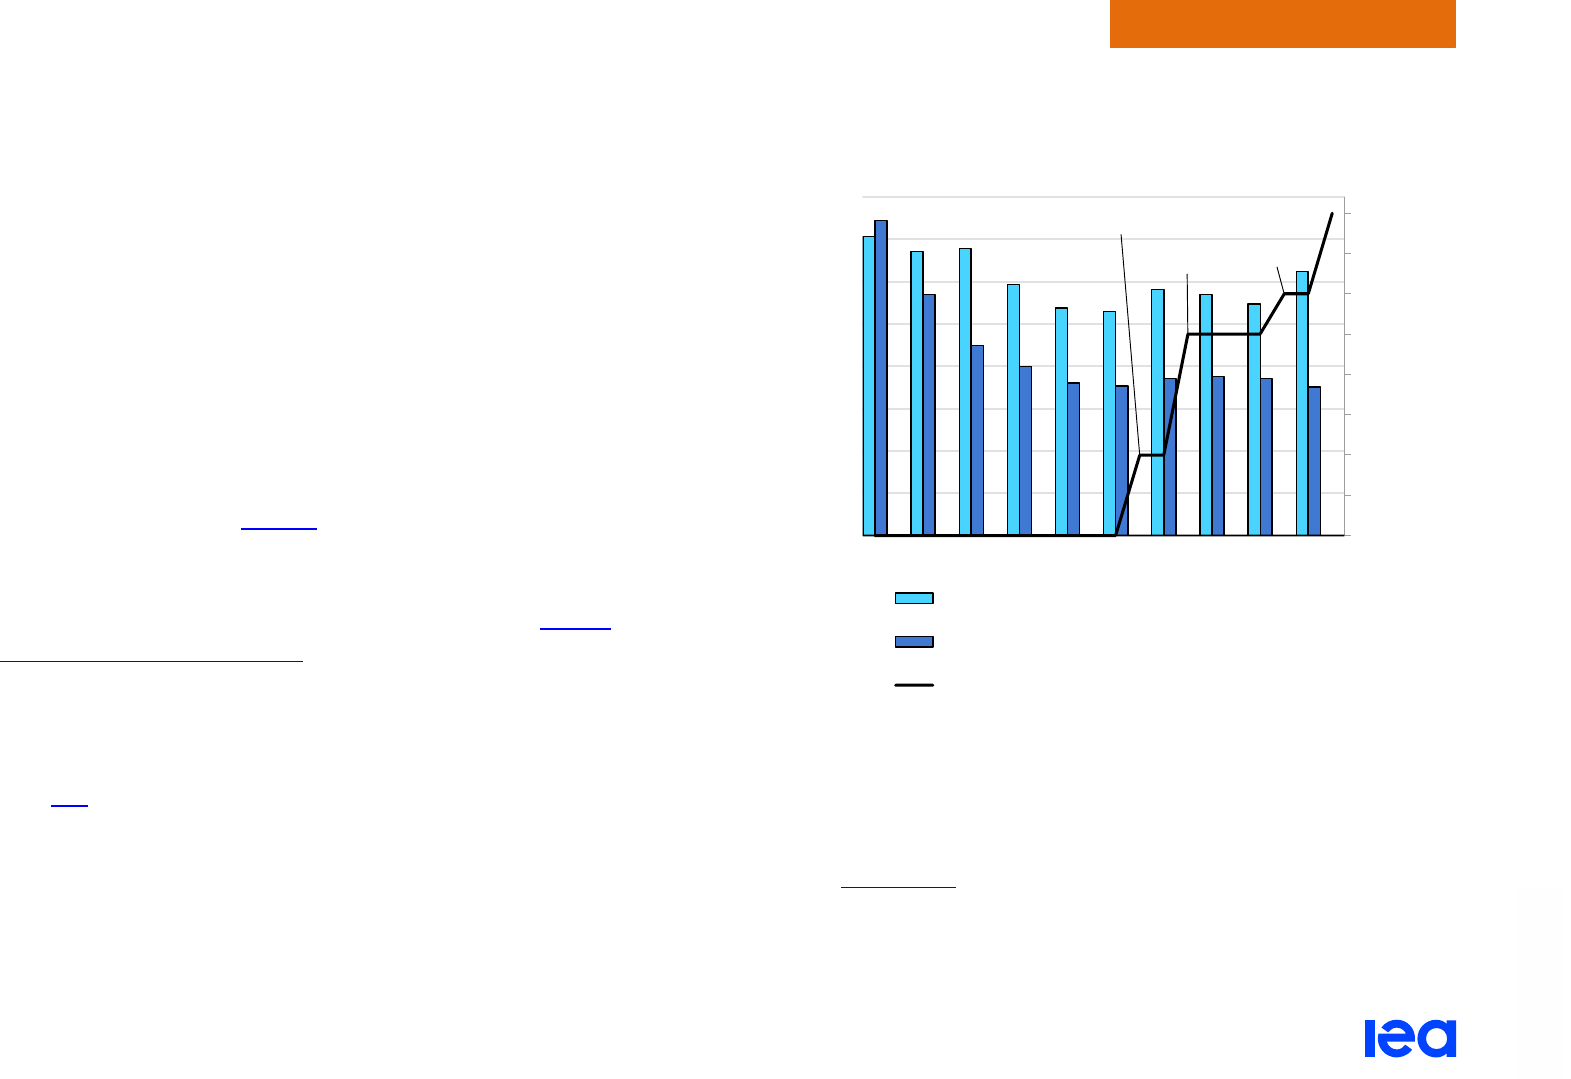
Electricity Market Report 2023
P
AGE | 91
IEA. CC BY 4.0.
Regional perspectives
Another factor influencing the share of nuclear power in the
Ukrainian generation mix is the ability to export excess power to
European neighbours. Ukraine and Moldova were synchronised
with the continental European grid on 16 March. Trading with
European neighbours started on 30 June, with capacity gradually
rising in 100-150 MW increments. On 15 October, TSOs set the
export limit of Ukraine/Moldova to 400 MW and the import limit to
500 MW. The power exchange between Ukraine/Moldova and
continental Europe is beneficial for both parties; with increased
financial revenues for the former and help in balancing tight
electricity markets for the latter. While Ukraine was initially exporting
power in the face of a depressed demand, the situation changed
following the infrastructure damage on 10 October. Following that,
electricity exports were banned
by
Ukrainian authorities to ensure
local demand was met. Moldova swiftly received support from EU
neighbours (e.g. Romania and others) to fill the gap of the lost
electricity imports from Ukraine (which used to cover
30% of
Moldova’s electricity demand).
The outlook for future developments is highly uncertain. The end of
the war is not yet in sight and many factors may influence the post-
war recovery, including the state of the energy infrastructure. More
than half of
the Ukrainian energy infrastructure was destroyed at the
end of 2022.
Monthly electricity consumption in Ukraine and the evolution of
allowed trade capacity Ukraine/Moldova and continental Europe,
2021-2022
IEA. All rights reserved.
Notes: The maximum allowed exchange capacity does not include the already existing
export capacity to Poland of approximately 215 MW from the Ukrainian Dobrotvirska
power plant. Other changes in the allowed exchange capacities might have occurred
after 15 October 2022.
Sources: UKRENERGO
(consumption data available until 27 October 2022) and
ENTSO-E (export).
30/06
30/07
23/09
15/10
0
50
100
150
200
250
300
350
400
0
2
4
6
8
10
12
14
16
Jan Feb Mar Apr May Jun Jul Aug Sep Oct
MW
TWh
2021 Electricity consumption
2022 Electricity consumption
Agreed trade capacity Ukraine/Moldova to
continental Europe in 2022 (right axis)
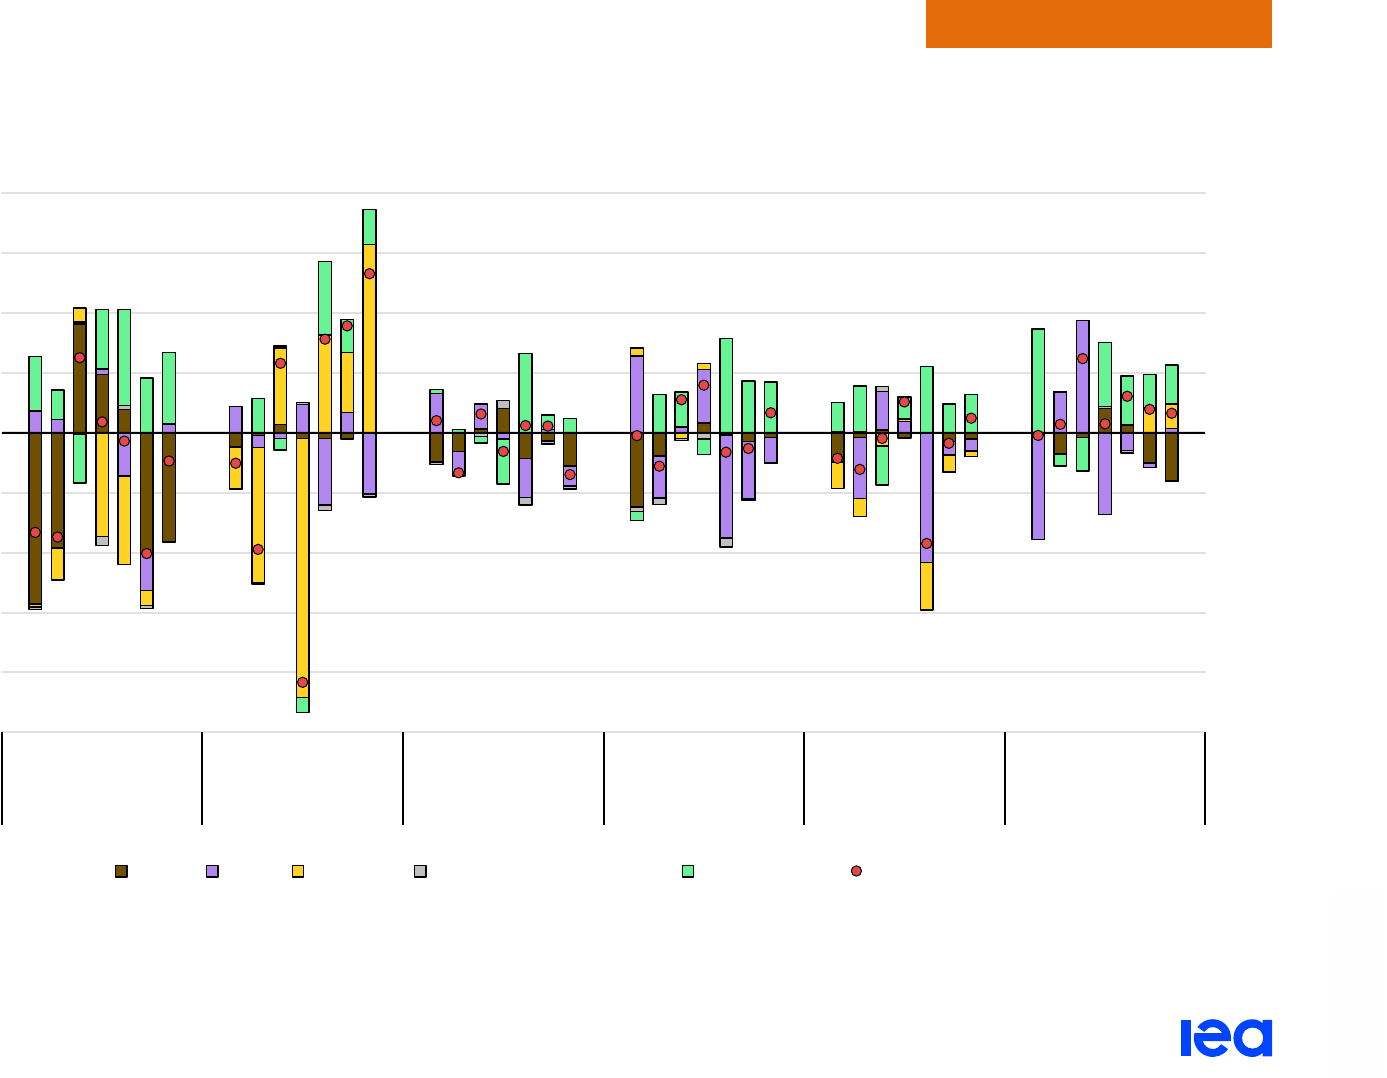
Electricity Market Report 2023
P
AGE | 92
IEA. CC BY 4.0.
Regional perspectives
Renewables lead generation growth in most large European countries until 2025
Year-on-year change in electricity generation in selected countries in Europe, 2019-2025
IEA. CC BY 4.0.
Note: Other non-renewables includes oil, waste and other non-renewable energy sources.
- 100
- 80
- 60
- 40
- 20
0
20
40
60
80
2019
2021
2023
2025
2019
2021
2023
2025
2019
2021
2023
2025
2019
2021
2023
2025
2019
2021
2023
2025
2019
2021
2023
2025
Germany France Italy Spain United Kingdom Türkiye
TWh
Coal Gas Nuclear Other non-renewables Renewables Net change

Electricity Market Report 2023
P
AGE | 93
Regional perspectives
IEA. CC BY 4.0.
Eurasia

Electricity Market Report 2023
P
AGE | 94
Regional perspectives
IEA. CC BY 4.0.
Eurasia’s electricity demand growth slowed in 2022 amid the worsening economic outlook
Russia’s war in Ukraine has cast a long shadow over its domestic
macroeconomic outlook and could have negative spillover effects
on other countries in the region who share close economic or
political ties with Russia.
Eurasia’s electricity consumption increased by an estimated 1.5%
(+24 TWh) year-on-year in 2022 – a marked slowdown compared to
the record growth of 75 TWh in 2021. Over 70% of incremental
electricity demand was concentrated in the first half of the year.
Electricity consumption growth slowed to below 1% y-o-y in the
second half of the year amid the worsening economic performance.
Fossil-based thermal generation rose by over 3%, offsetting lower
hydropower output and meeting the incremental electricity demand.
The region’s electricity demand growth is expected to slow to an
average annual rate below 1% from 2023 to 2025.
Fossil-fired generation is set to continue to dominate Eurasia’s
electricity mix, at a share of around 65% over the 2023 to 2025
forecast period. While the deployment of renewables remains slow
at the current pace, the commissioning of new nuclear plants,
including in Belarus and Russia, is set to slightly reduce the CO
2
intensity of power generation over our forecast period.
Russia
Russia is by far the largest power consumer in Eurasia, with annual
consumption of over 1 000 TWh, and accounts for just over three-
quarters of the region’s electricity demand.
Russia’s electricity consumption grew by over 6% in 2021, or close
to 60 TWh – its highest increase in absolute terms since the demise
of the Former Soviet Union. This was largely supported by a strong
economic recovery (the country’s GDP grew by 4.7%) and adverse
weather conditions, i.e. a cold and long winter season. Power
generation rose by 6.3% (+69 TWh), largely supported by the
country’s significant thermal fleet. Gas-fired power generation
surged by over 10%.
Russian electricity consumption is estimated to have increased by
1.5% (+16 TWh) in 2022. Demand growth was almost entirely
concentrated in the first half of the year, when it rose by 2.2% y-o-y.
Depressed industrial and commercial activity moderated electricity
demand growth to 0.7% year-on-year in Q3 and Q4 2022.
In 2022, fossil-fired generation – including coal, natural gas and fuel
oil-fired power plants – rose by over 3% (+24 TWh) compared to
2021 levels and accounted for over 60% of total power supply. The
strong growth was primarily supported by lower hydro output, which
fell by 8% (-17 TWh) y-o-y.

Electricity Market Report 2023
P
AGE | 95
Regional perspectives
IEA. CC BY 4.0.
Russia’s power generation capacity increased by a marginal 0.5%
y-o-y through the first ten months of 2022. Gas-fired generation
capacity grew by close to 1 GW, more than compensating for a
reduction of 0.3 GW capacity in coal-fired power plants. Nuclear
and hydropower generation capacity remained stable, while solar
power capacity was up by close to 8% (+0.25 GW).
In Russia, lower industrial and commercial activity is expected to
weigh on electricity demand growth. The country’s generation mix is
set to remain broadly unchanged over the medium term, with fossil-
fired generation maintaining its share of over 60%. There are
currently two nuclear reactors under construction and expected to
come online before 2026, Kursk II-1 and Kursk II-2, with a combined
capacity of 2.5 GW. They are expected to be commissioned over
2023-2024 and will match the retirement of the first two old Kursk
units. Russia is also undertaking a large-scale modernisation
programme of its thermal fleet, with the target to refurbish over
20 GW between 2022 and 2026. According to initial estimates, this
could decrease the carbon footprint of Russia’s power system by
5%. In 2022, power generation companies requested to postpone
the modernisation of 26 thermal power plants (with a combined
capacity of close to 6 GW) by one year or a year and a half in some
cases. This is primarily due to the delayed delivery of gas turbines
due to Western sanctions imposed on Russia’s technology
procurement.
Kazakhstan
Kazakhstan is the second largest electricity consumer in Eurasia,
with annual demand of over 100 TWh. Electricity consumption rose
by 7% (+7 TWh) in 2021, driven by a recovery in industrial and
commercial activity. Higher demand was primarily met by fossil-fired
generation, which increased by 2% (+2 TWh) and compensated for
the decline in hydro output of 9% (-0.6 TWh).
Power generation fell by an estimated 1% (-1.1 TWh) in 2022 amid
slower economic growth. According to preliminary data, fossil-fired
generation declined by over2% (-2 TWh) y-o-y in 2022 .
Hydropower outputremained broadly flat compared to 2021. .
Kazakhstan’s electricity demand is forecast to increase by 1.7% per
year over the 2023-2025 forecast period, largely to be met by
expanding gas-fired power generation and renewable sources of
electricity supply. According to the country’s development plan for
the natural gas sector, published in July 2022, gas consumption in
the power sector is expected to rise 55% by 2025 from 2022 levels.
This would translate into an estimated 14 TWh of gas-based
electricity supply. While the growing share of renewable and gas-
based generation is set to reduce the power sector’s emissions
intensity, coal-fired generation will retain its dominant position,
accounting for more than half of the generation mix in 2025.
Other Eurasia
Similar to Russia and Kazakhstan, electricity consumption also
grew strongly (over 6% y-o-y) in other Eurasian countries in 2021,

Electricity Market Report 2023
P
AGE | 96
Regional perspectives
IEA. CC BY 4.0.
supported by recovery in economic and industrial activity after the
start of Covid-19 in 2020. Preliminary estimates indicate that
electricity demand growth in those markets slowed to around 4% in
2022.
In Uzbekistan, the region’s third largest electricity consumer,
electricity demand rose by 7% (+4.1 TWh) in 2021 and declined by
an estimated 1% in 2022. In the first eleven months of 2022,
Uzbekistan commissioned six thermal power plants with a
combined capacity of 1.4 GW and one solar power generation
complex with a capacity of 100 MW. According to the Ministry of
Energy, the new and more efficient power plants could save around
1.5 bcm of natural gas per year by replacing older units. Uzbekistan
continues to face electricity supply cuts due to natural gas supply
shortages for power plants. Natural gas output fell by 4% (-2 bcm)
y-o-y in 2022 due to ageing fields with rapidly deteriorating
production rates. As of mid-November 2022, Uzbekistan stopped
natural gas exports, with officials suggesting a supply-demand gap
of 20 mcm/d in the country.
In gas-rich Turkmenistan electricity generation rose by an
estimated 11% y-o-y in 2022, largely driven by the country’s
electricity exports, which increased by 30% compared to 2021.
These strong export gains were due to growing output from the
giant gas-fired power plant complex in the Mary province. For 2022,
Turkmenistan had planned exports of around 9 TWh of electricity
into neighbouring markets, including Afghanistan, Iran, Kyrgyzstan
and Uzbekistan. Turkmenistan started electricity exports to
Kyrgyzstan in August 2021, with deliveries rising to 1.7 TWh in the
first half of 2022. In October 2022, Turkmenistan and Uzbekistan
agreed to ramp up electricity supplies to 4 TWh/yr, which could
improve electricity supply security in Uzbekistan.
In Azerbaijan, electricity consumption grew by 7% (+1.5 TWh) in
2021, largely supported by the strong growth in fossil-fired
generation (up by 5%). Electricity demand grew by 4% y-o-y in
2022, supported by the economic growth. The country’s generation
mix continues to be dominated by gas-fired thermal generation.
Electricity demand in Eurasia (excluding Kazakhstan and Russia) is
expected to increase at an average growth rate of 2% per year over
the 2023-2025 forecast period. This will be largely supported by the
region’s rising population and economic expansion, although the
region’s macroeconomic outlook has worsened since Russia’s
invasion of Ukraine.
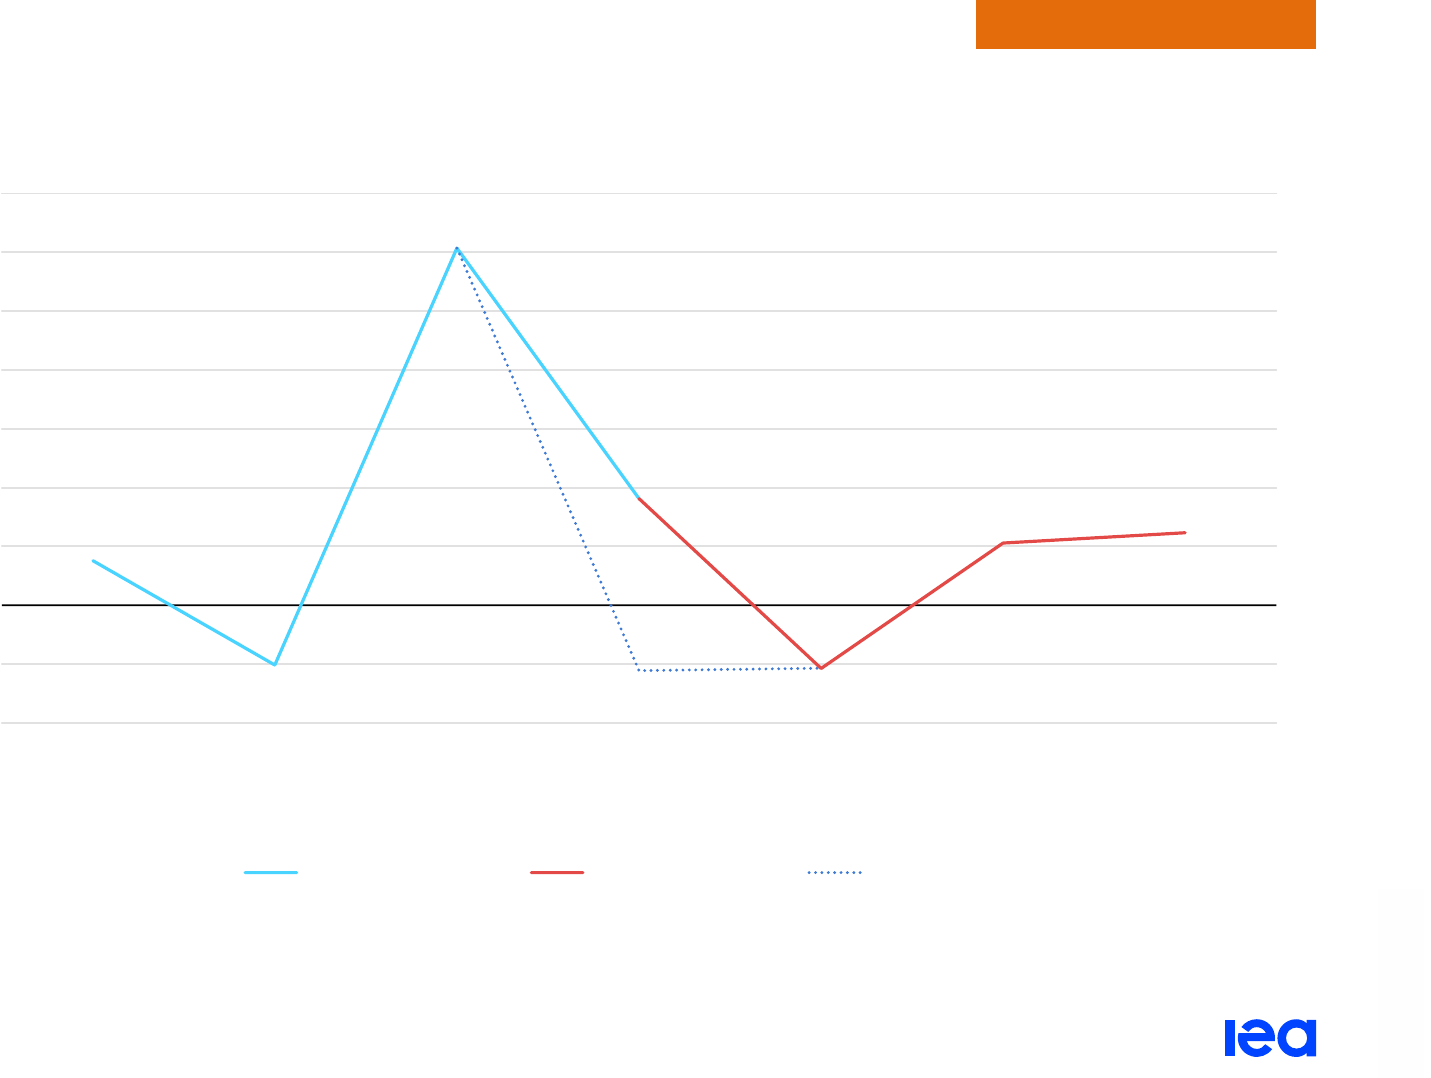
Electricity Market Report 2023
P
AGE | 97
Regional perspectives
IEA. CC BY 4.0.
Russia’s bleak economic outlook weighs on Eurasia’s electricity demand growth
Year-on-year relative change in electricity demand, Eurasia, 2019-2025
IEA. CC BY 4.0.
-2%
-1%
0%
1%
2%
3%
4%
5%
6%
7%
2019
2020
2021
2022
2023
2024
2025
Electricity demand growth
Historical demand Updated forecast Previous forecast (July 2022)
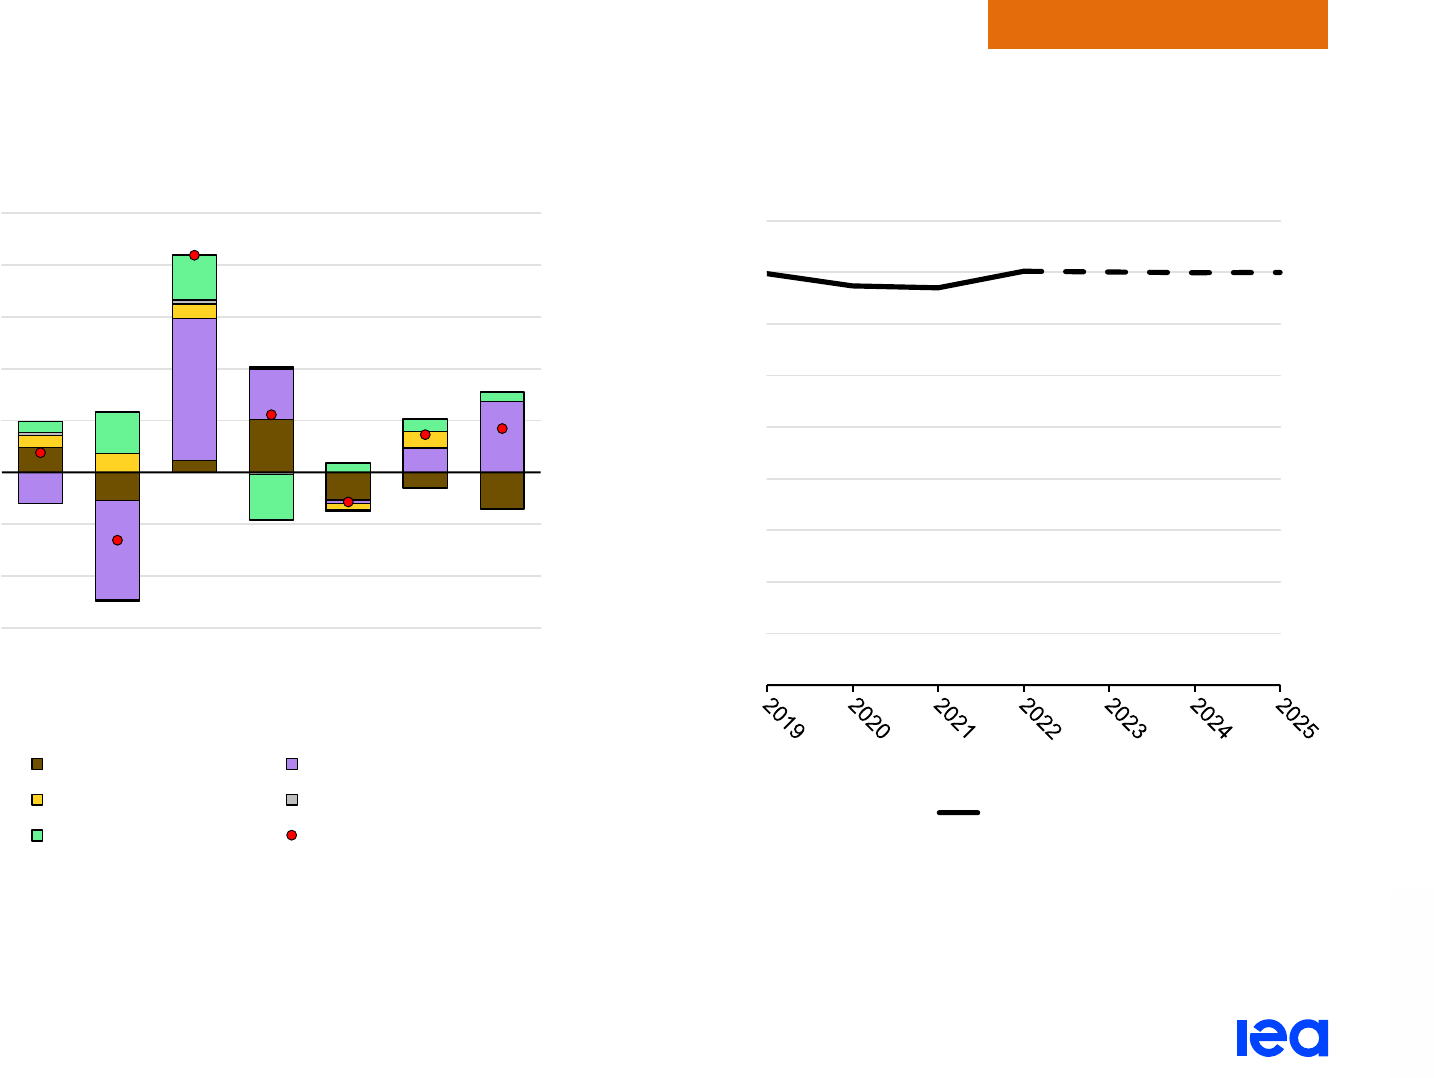
Electricity Market Report 2023
P
AGE | 98
Regional perspectives
IEA. CC BY 4.0.
Gas-fired power generation dominates incremental electricity supply in Eurasia
Year-on-year change in electricity generation, Eurasia,
2019-2025
IEA. CC BY 4.0.
Development of average CO
2
intensity, Eurasia, 2019-2025
IEA. CC BY 4.0.
Notes: Other non-renewables includes oil, waste and other non-renewable energy sources. The CO
2
intensity is calculated as total CO
2
emissions divided by total generation.
- 60
- 40
- 20
0
20
40
60
80
100
2019
2020
2021
2022
2023
2024
2025
TWh
Coal Gas
Nuclear Other non-renewables
Renewables Net change
0
50
100
150
200
250
300
350
400
450
g CO
₂/kWh
Eurasia

Electricity Market Report 2023
P
AGE | 99
Regional perspectives
IEA. CC BY 4.0.
Middle East
IEA. CC BY
4.0.

Electricity Market Report 2023
P
AGE | 100
Regional perspectives
IEA. CC BY 4.0.
Middle East electricity demand to grow 2% annually in 2023-2025 while CO
2
intensity declines
Electricity demand in the Middle East grew by about 4% in 2021
following a 1% decline in 2020 due to Covid-19 lockdowns.
Members of the Gulf Cooperation Council (GCC) – particularly
Saudi Arabia, Iraq, Oman, and the United Arab Emirates (hereafter
“UAE”) – saw the strongest absolute increases in electricity
consumption. However, lower-income countries in the region –
including Iraq, Lebanon and Iran – experienced periodic electricity
shortages throughout the year 2021.
We estimate that electricity consumption rose by 2.6% in 2022
across the region and expect growth to continue at a similar but
slightly reduced rate in the 2023-2025 forecast period. Electricity
demand in the Middle East is primarily driven by a growing
population, rising demand for cooling and water desalination, and
the continued expansion of energy-intensive industries. In the near
term, power demand will receive additional support from surging
GDP growth and higher public spending in the region’s leading oil
and gas exporters amid the current high energy price environment.
Multiple projects to enhance regional interconnections progressed
in 2022: a 150 MW line
to export power from Jordan to Iraq in 2023
started construction in 2021, a 3 GW interconnection between
Saudi Arabia and Egypt secured financing, and an agreement on a
1.8 G
W direct link between Iraq and the GCC grid (via Saudi
Arabia) was reported to have been finalised.
Gas remains the dominant fuel for electricity production across the
r
egion, and its share in total generation is on course to increase
from 72% in 2022 to 77% by 2025 as it captures market share from
both oil- and coal-fired generation. The share of oil in the generation
mix is set to drop from 21% to 14% between 2022 and 2025, led by
steep declines in Saudi Arabia, Iraq, Iran and Kuwait in particular.
Coal is projected to see its share diminish from 1% to just under
0.3% over the same period due to Israel’s decision to phase out
coal-fired generation by the end of 2025 and the recent conversion
of the new Hassyan power plant in the UAE from coal to gas.
Nuclear generation is expected to nearly double between 2022 and
2025, reaching 50 TWh (or 3.5% of total generation) by the end of
our forecast period, as the UAE’s Barakah nuclear plant ramps up
to full capacity. Renewable generation (led by solar PV) is set to
increase by 50% from 2022 levels and account for more than 5% of
total generation by 2025. The biggest increments are expected in
Saudi Arabia, Israel, Oman and the UAE, while the rollout of
renewables in the rest of the region remains slow or non-existent.
Annual power generation emissions increased only marginally (by
around 0.7%) in 2022 as higher gas-related emissions were largely
offset by lower emissions from oil- and coal-fired output. Total
power generation emissions are set to fall by 2% between 2022 and
2025 to around 710 Mt CO
2
. The biggest emission declines are
expected in the UAE (thanks to the rapid rise of renewables and the
ramp up of nuclear output), Israel (due to the phase-out of coal) and
Saudi Arabia (as a result of a steep drop in oil-fired generation).

Electricity Market Report 2023
P
AGE | 101
Regional perspectives
IEA. CC BY 4.0.
However, these declines are partly offset by growing emissions in
the rest of the region, mainly due to rising gas-fired generation.
The regional CO
2
intensity of power generation fell by nearly 2% in
2022, reaching about 540 g CO
2
/kWh. It is on course to drop by
another 7% in 2025 compared with 2022 levels, as the share of coal
and oil declines while the share of nuclear and renewables
increases in the region’s electricity mix.
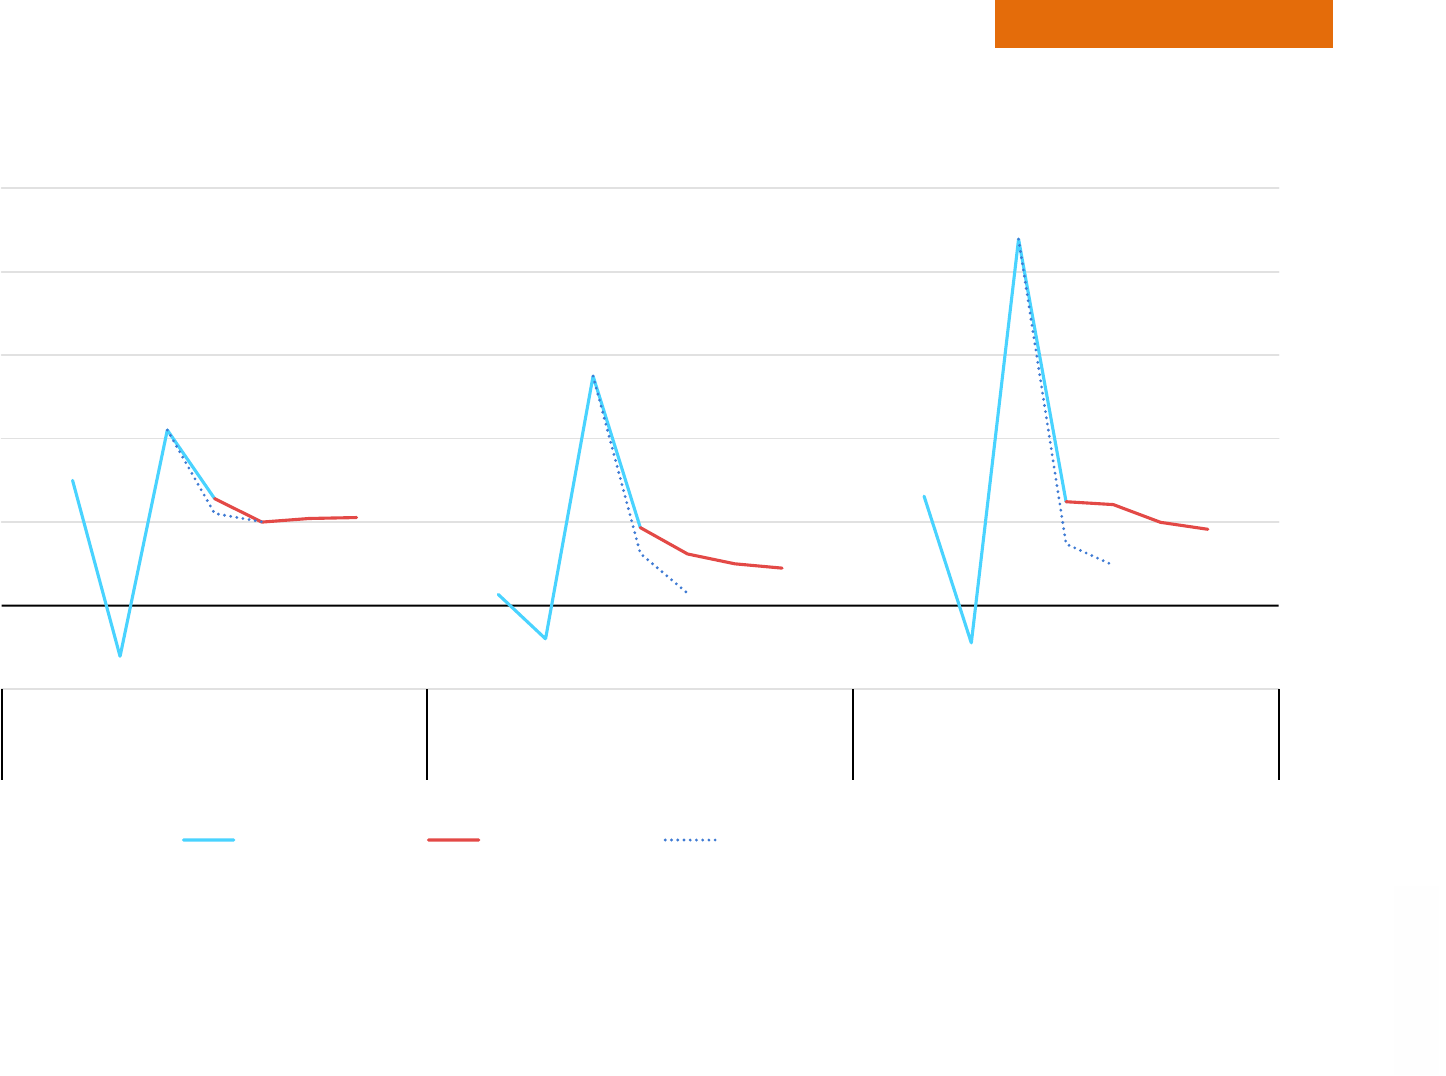
Electricity Market Report 2023
P
AGE | 102
Regional perspectives
IEA. CC BY 4.0.
Electricity demand growth in the Middle East moderates in 2022-2025 following the 2021 spike
Year-on-year relative change in electricity demand, Middle East, 2019-2025
IEA. CC BY 4.0.
-2%
0%
2%
4%
6%
8%
10%
2019
2020
2021
2022
2023
2024
2025
2019
2020
2021
2022
2023
2024
2025
2019
2020
2021
2022
2023
2024
2025
Middle East Saudi Arabia United Arab Emirates
Electricity demand growth
Historical demand Updated forecast Previous forecast (July 2022)
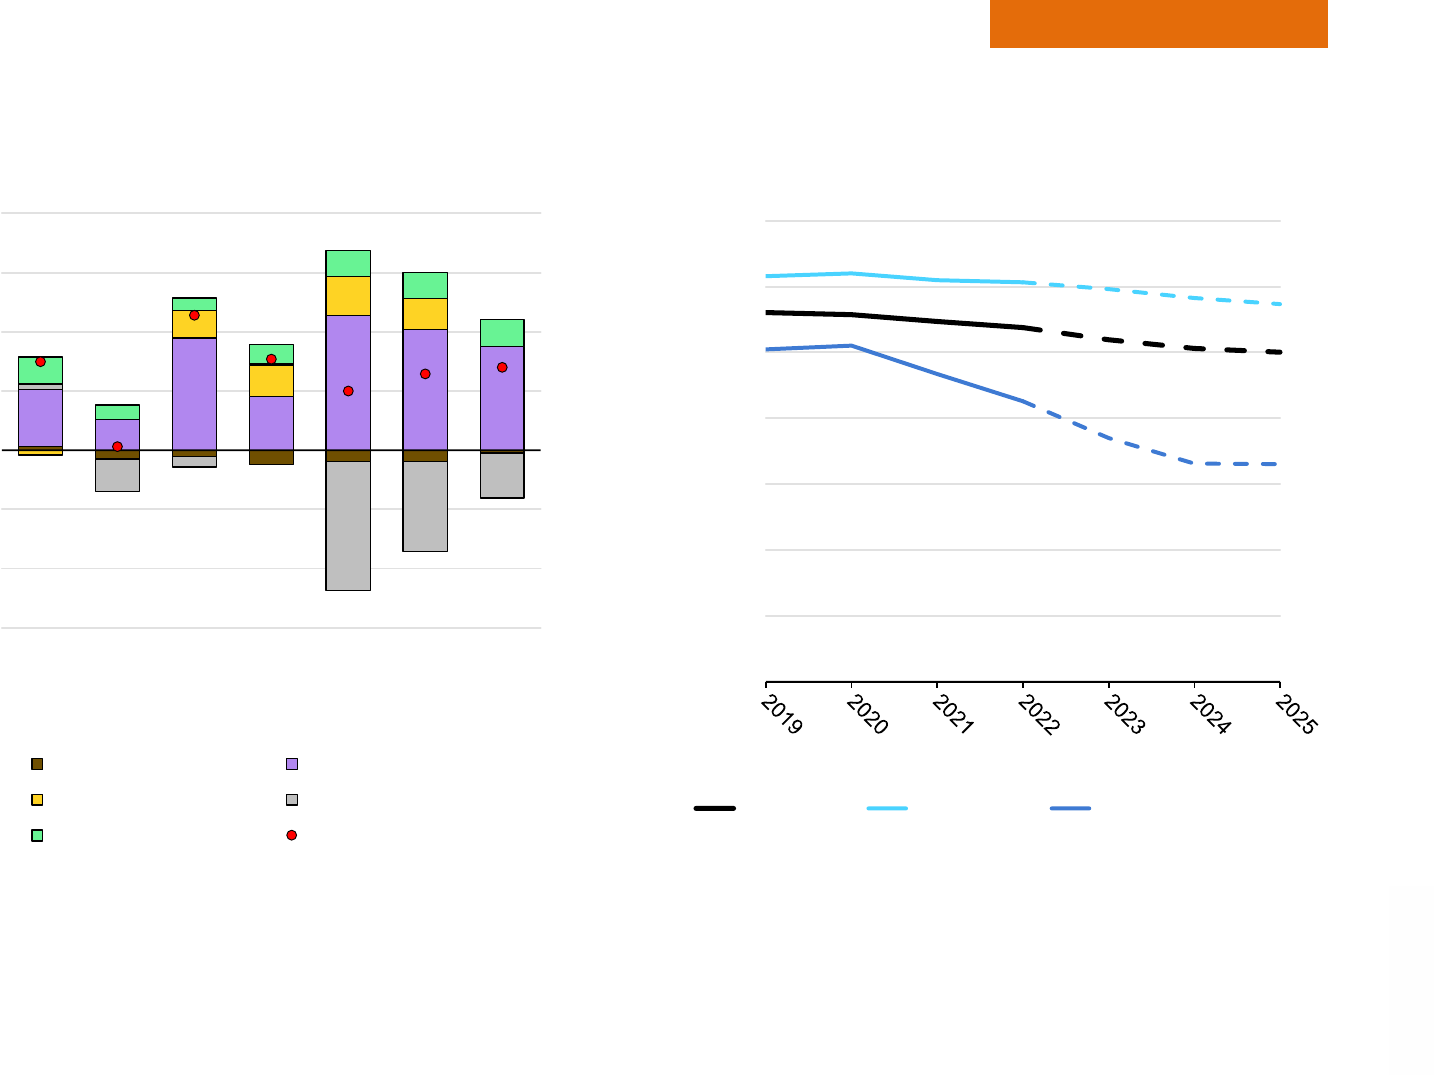
Electricity Market Report 2023
P
AGE | 103
Regional perspectives
IEA. CC BY 4.0.
Gas-fired generation is set to continue to be the largest source of additional supply to 2025
Year-on-year change in electricity generation, Middle East,
2019-2025
IEA. CC BY 4.0.
Development of average CO
2
intensity, Middle East, 2019-2025
IEA. CC BY 4.0.
Notes: Other non-renewables includes oil, waste and other non-renewable energy sources. The CO
2
intensity is calculated as total CO
2
emissions divided by total generation.
- 60
- 40
- 20
0
20
40
60
80
2019
2020
2021
2022
2023
2024
2025
TWh
Coal Gas
Nuclear Other non-renewables
Renewables Net change
0
100
200
300
400
500
600
700
g CO
₂/kWh
Middle East Saudi Arabia United Arab Emirates

Electricity Market Report 2023
P
AGE | 104
Regional perspectives
IEA. CC BY 4.0.
Saudi Arabia
Saudi Arabia’s electricity consumption rose by 5.5% in 2021
(following a Covid-induced dip of 0.8% in 2020) with commercial
users and public sector entities registering the strongest recovery.
In the first half of 2022, power demand was up by 2.3% y-o-y, led
higher by commercial, government and industrial consumption as
well as water desalination. For 2022, we estimate electricity
demand increased by 2%. However, the average growth rate is
expected to slow to around 1% per year in the 2023-2025 forecast
period, as the demand boost from new grid connections is tempered
by earlier price reforms in 2018 (when tariffs for some residential
users were increased by as much as 260%). Moreover, a smart
meter rollout is proceeding rapidly, with more than 10 million
installed in 2020 and 2021 alone. This can potentially help increase
energy efficiency.
Saudi Arabia’s total generating capacity stood at 83 GW at the end
of 2021, which included 710 MW of renewable capacity. The Saudi
Electricity Company, the country’s state-owned power utility, plans
for the addition of another 2.1 GW of solar capacity and 7.2 GW of
combined-cycle gas turbine (CCGT) capacity by private operators
during the 2022-2025 period. We expect gas-fired generation to
increase by nearly 30% (+67 TWh) from 2021 to 2025, supported
by a string of high-profile gas developments (namely Hawiyah,
Tanajib, and the initial phase of the Jafurah unconventional gas
project), which are scheduled to begin operating between 2023 and
2025. At the same time, we project oil-fired output to decline by
35% (-57 TWh) and its share in total generation drops from 39% to
25% by 2025 as higher gas burn in new and existing thermal plants
reduce costly oil-fired power in the generation mix. Renewable
generation, though growing rapidly, is expected to account for less
than 3% (11 TWh) of Saudi Arabia’s total generation in 2025. The
most notable renewable projects in the pipeline include the Sudair
(1 500 MW), Jeddah (300 MW) and Rabigh (300 MW) solar
developments.
United Arab Emirates
In the UAE electricity consumption increased by 9% in 2021
following a slump of about 1% in 2020 due to Covid-related
restrictions. Growth has continued in 2022 as well. The Dubai
Electricity and Water Authority (DEWA), which serves about 35% of
UAE demand, reported a strong 5% year-on-year growth in the first
nine months of 2022. For the whole country, we estimate total
demand growth in 2022 was slightly below 3%. We anticipate total
electricity consumption to expand at a 2% annual average rate in
the 2023-2025 period on the back of strong economic growth
(averaging about 4% per year, according to the IMF).
Installed generation capacity across the UAE reached 35 GW in
2021, of which 31 GW was gas-fired, 2.6 GW solar and 1.4 GW
nuclear. Following the grid connection of 4.2 GW of nuclear,
3.6 GW of gas-fired and 4.8 GW of solar capacity during the 2022-
2025 period, the respective shares of gas, renewables and nuclear
in the generation mix are projected at 64%, 10% and 26% by 2025.
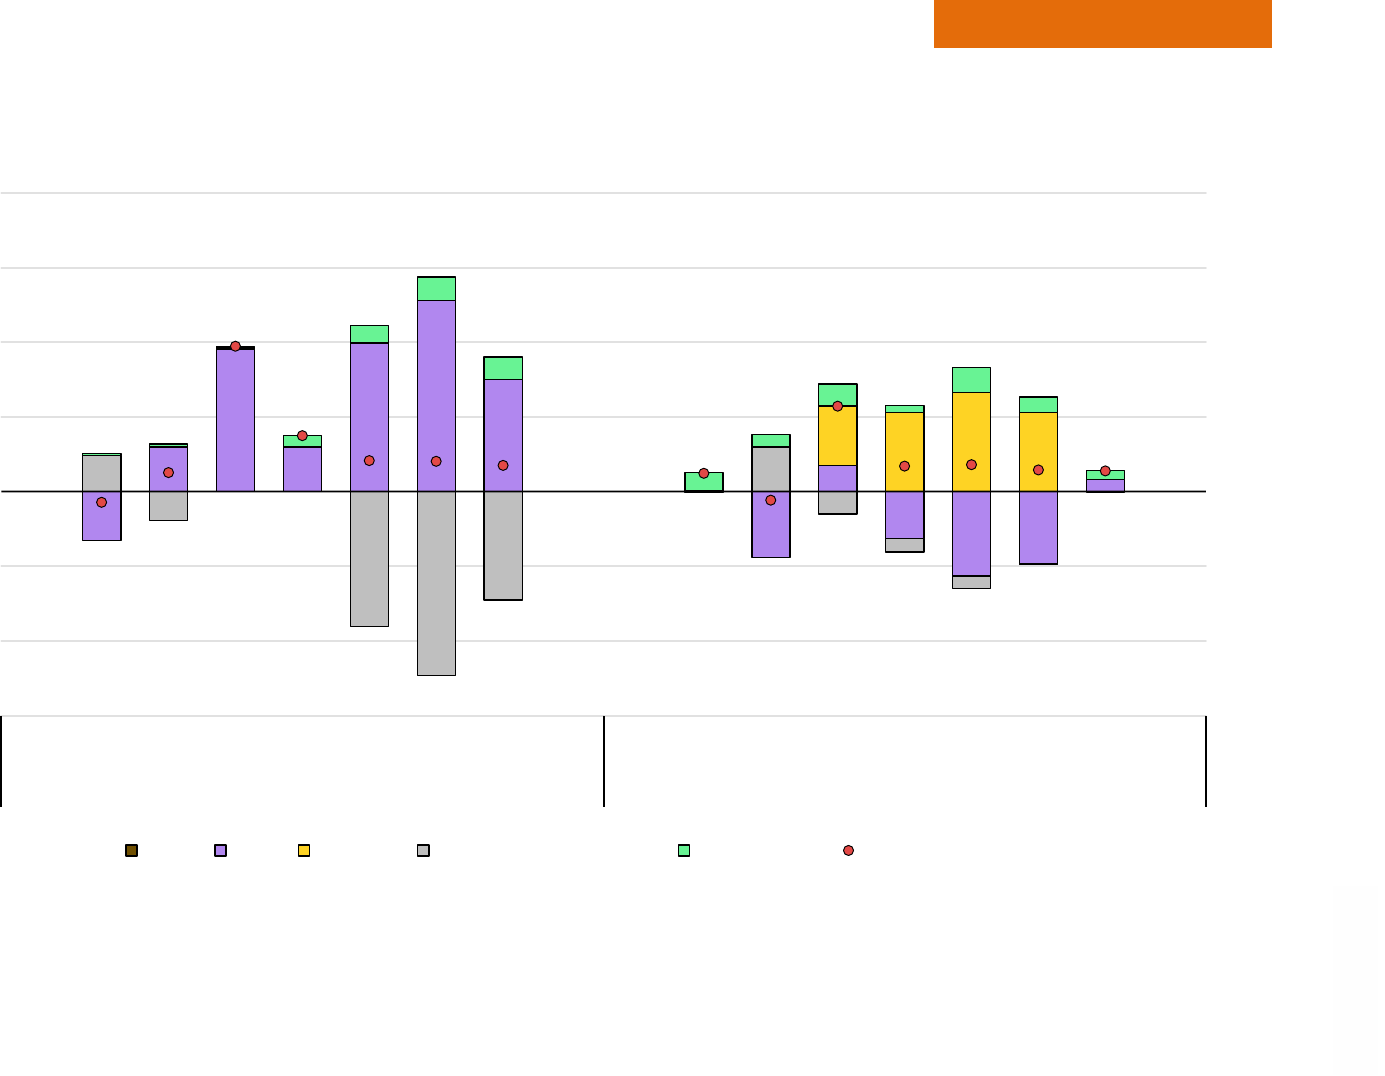
Electricity Market Report 2023
P
AGE | 105
Regional perspectives
IEA. CC BY 4.0.
Gas fuels most of the additional generation in Saudi Arabia, nuclear increments lead in the UAE
Year-on-year change in electricity generation in selected countries in the Middle East, 2019-2025
IEA. CC BY 4.0.
Note: Other non-renewables includes oil, waste and other non-renewable energy sources.
- 30
- 20
- 10
0
10
20
30
40
2019
2020
2021
2022
2023
2024
2025
2019
2020
2021
2022
2023
2024
2025
Saudi Arabia United Arab Emirates
TWh
Coal Gas Nuclear Other non-renewables Renewables Net change

Electricity Market Report 2023
P
AGE | 106
Regional perspectives
IEA. CC BY 4.0.
Market trends in selected Middle Eastern countries
Kuwait’s installed generation capacity stood at just over 20 GW at
the end of 2021, of which 84% (17 GW) was simple steam or gas
turbine, 15% (3 GW) was CCGT and only about 0.3% (70 MW)
was renewable capacity. While the government has plans to add
9 GW of gas-fired and 5 GW of solar capacity by 2030, stalled
progress on these projects means they are unlikely to be added to
the generation mix before 2026. Electricity consumption is
expected to grow at an average annual rate of 2% between 2022
and 2025, driven by increasing demand for cooling and water
desalination.
Israel’s electricity consumption rose by 1% in 2021 (following
minimal growth in 2020) and is expected to grow by 3% per year
on average during the 2022-2025 period, driven by population
growth, rising water desalination requirements and the
electrification of energy end-uses. Gas-fired generation in 2025 is
projected to be 30% above 2021 levels (increasing 4 TWh/yr),
thanks to the ramp up of the Karish gas field in 2022-2024, whose
production is solely dedicated to the domestic market. Renewable
output in 2025 is set to reach 15% of the generation mix following
a 110% (+6 TWh) increase from 2021 levels, while coal-fired
power drops to close to zero by the end of 2025. This is in line with
the government’s plan to phase out all coal-fired power and
convert the remaining coal plants to natural gas by 2025.
Qatar’s electricity demand grew by about 5% in 2021 following a
small 1% decline in 2020. We expect demand to grow at an annual
average of 3% during the 2022-2025 period, driven by population
growth, rising demand for cooling and water desalination, and
expanding infrastructure. Incremental generation will mainly come
from gas (on top of Qatar’s 10.6 GW of existing gas-fired
capacity), but solar projects adding 1.7 GW of capacity between
2022 and 2025 are set to contribute 4% of the generation mix by
2025.
Oman’s electricity consumption posted a sharp 8% rebound in
2021 (after a 2% drop in 2020) and is projected to rise at an
annual average of 2.6% over the 2022-2025 period. The
government plans to add 1.9 GW of renewable capacity by 2026
(on top of the existing 550 MW of grid-connected capacity) to meet
growing demand and reduce dependence on gas-fired generation,
but only 1 GW of this is slated to come online by 2025. We
estimate that the share of gas in total generation will decline from
97% in 2021 to 87% in 2025, while the share of renewables is on
course to rise from below 2% in 2021 to around 11% by 2025.
Oman’s long-term plans target a renewable generation share of
39% by 2040. In an effort to increase system-wide efficiency and
support energy transition goals, the government of Oman
launched the first spot electricity market in the Middle East in
2022.
Jordan’s total electricity demand rose by about 2% in 2021 (after
remaining flat in 2020) and we expect it to grow at an annual
average of 2.6% in the 2022-2025 period. In 2021, 77% of total

Electricity Market Report 2023
P
AGE | 107
Regional perspectives
IEA. CC BY 4.0.
generation was fuelled by gas, 23% by renewables and under 1%
by oil. Of the country’s 6.2 GW of installed capacity, 3.7 GW (60%)
was thermal capacity (capable of burning oil or natural gas) and
2.5 GW (40%) was renewable. The government’s long-term plan
calls for a 50% renewable share in the generation mix by 2030; we
forecast a 26% renewable share to be achieved by 2025.

Electricity Market Report 2023
P
AGE | 108
Regional perspectives
IEA. CC BY 4.0.
Africa

Electricity Market Report 2023
P
AGE | 109
Regional perspectives
IEA. CC BY 4.0.
Africa’s electricity consumption growth is set to accelerate to 2025
Electricity demand in Africa increased by an estimated 5.7% in
2021, rebounding from a 3.3% decline in 2020 due to the Covid-19
pandemic impact on the economy. We estimate that electricity
demand in the region grew by 1.5% in 2022, down from our
previous forecast of 4%. Russia’s invasion of Ukraine triggered a
downward revision in economic growth prospects in Africa due to a
combination of record-level energy prices and high inflation rates,
which weighed heavily on our forecast for electricity demand across
the region. In addition, electricity consumption in South Africa was
revised lower – the continent’s largest electricity consumer –
because of production capacity constraints that turned out to be
worse than previously expected.
Natural gas-fired output, which accounted for an estimated 42% of
Africa’s electricity generation in 2022, remained stable in volume
compared to 2021. However, coal and nuclear (accounting for a
respective 27% and 1% share of Africa’s generation mix) both saw
their output decline in relation with supply shortages, while oil-fired
generation (5% of the mix) jumped by an estimated 24% year-on-
year. Supply from renewables (24% of the generation mix)
increased by 2% in 2022.
Electricity demand growth on the continent is expected to rebound
in 2023 to over 3%, thanks to an improvement in South African
production capacity as well as slightly enhanced macroeconomic
conditions, followed by an average 4.5% regional growth for 2024
and 2025.
The large majority of incremental generation to 2025 will come from
renewable sources, followed by natural gas. We expect electricity
delivered from renewable sources to increase by over 60 TWh in
2023-2025, to reach almost a 30% share of total generation by the
end of the forecast period (from 24% in 2021), replacing coal as the
second largest source of electricity in Africa.
Natural gas is expected to remain the largest source of electricity in
Africa through 2025, rising by around 30 TWh from 2022 to 2025, to
close to 400 TWh. However, despite this increase, gas sees its
share in the power generation mix decline slightly from 42% to 41%
over the same period as renewables expand. Coal-fired electricity
generation is expected to remain stable in output at around
240 TWh, declining in terms of share from 28% in 2021 to 24% in
2025.
The declining share of fossil-fuelled generation to 2025 results in
lower power generation CO
2
intensity in the region by the end of our
forecast period. We expect CO
2
intensity to decrease from about
540 g CO
2
/kWh in 2021 to around 500 g CO
2
/kWh in 2025. In the
same period, electricity generation CO
2
emissions would increase
slightly (+18 Mt CO
2
), reaching almost 490 Mt CO
2
, mainly due to
higher gas-fired generation than in 2021.
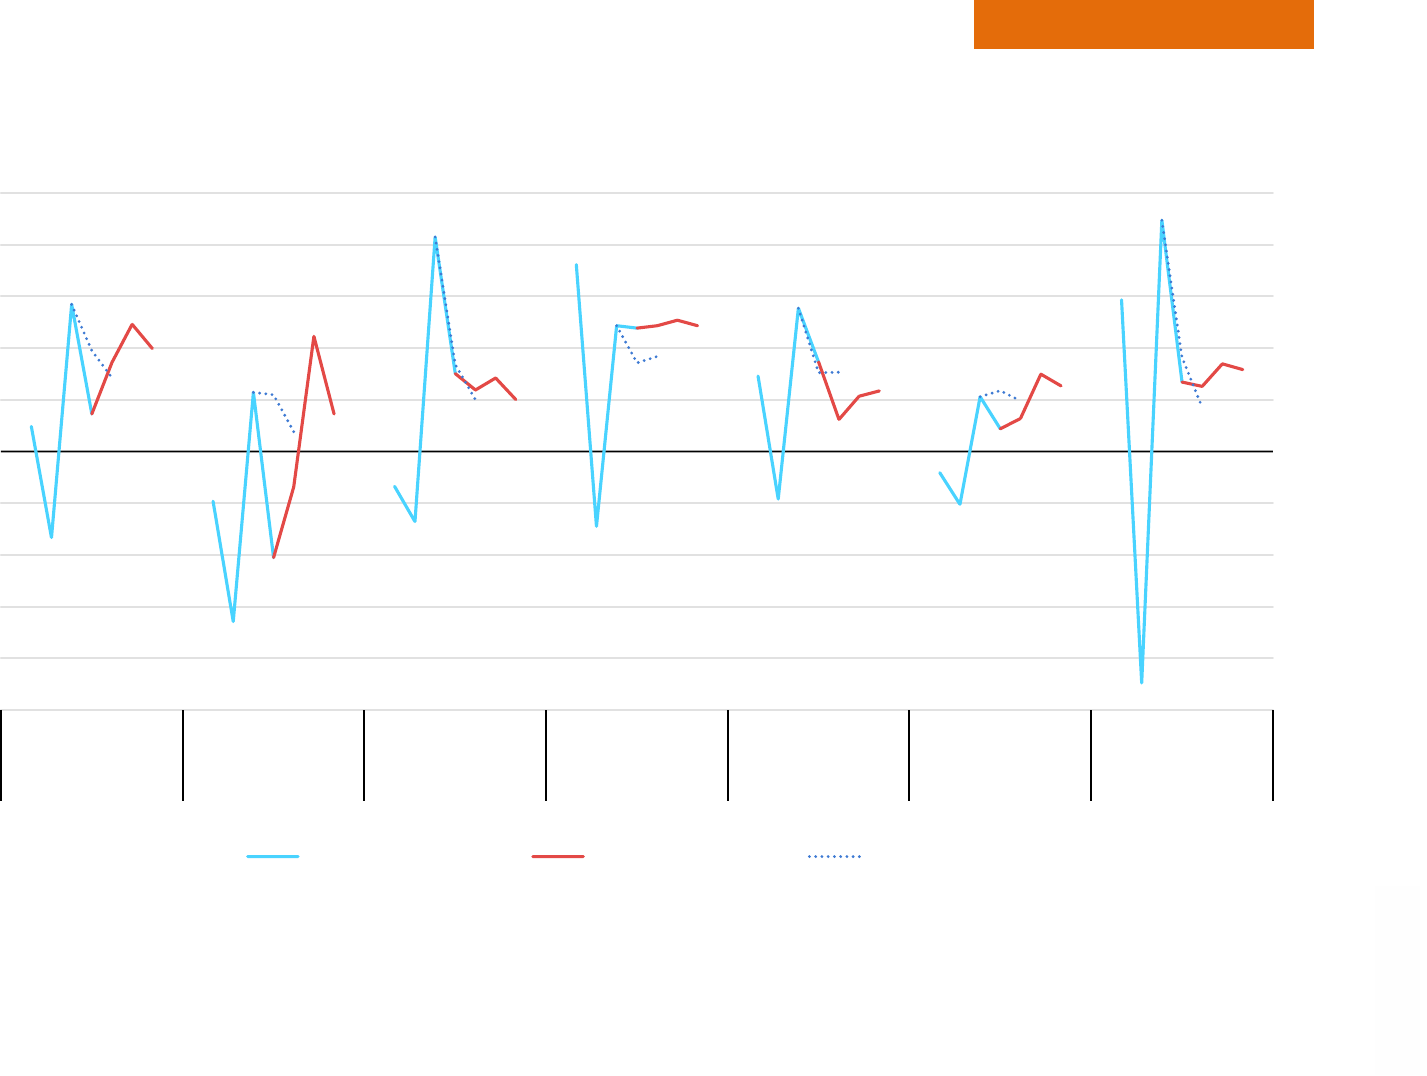
Electricity Market Report 2023
P
AGE | 110
Regional perspectives
IEA. CC BY 4.0.
South Africa deviates in its demand growth trend from other countries in Africa
Year-on-year relative change in electricity demand, Africa, 2019-2025
IEA. CC BY 4.0.
-10%
-8%
-6%
-4%
-2%
0%
2%
4%
6%
8%
10%
2019
2021
2023
2025
2019
2021
2023
2025
2019
2021
2023
2025
2019
2021
2023
2025
2019
2021
2023
2025
2019
2021
2023
2025
2019
2021
2023
2025
Africa South Africa Egypt Algeria Morocco Nigeria Tunisia
Electricity demand growth
Historical demand Updated forecast Previous forecast (July 2022)
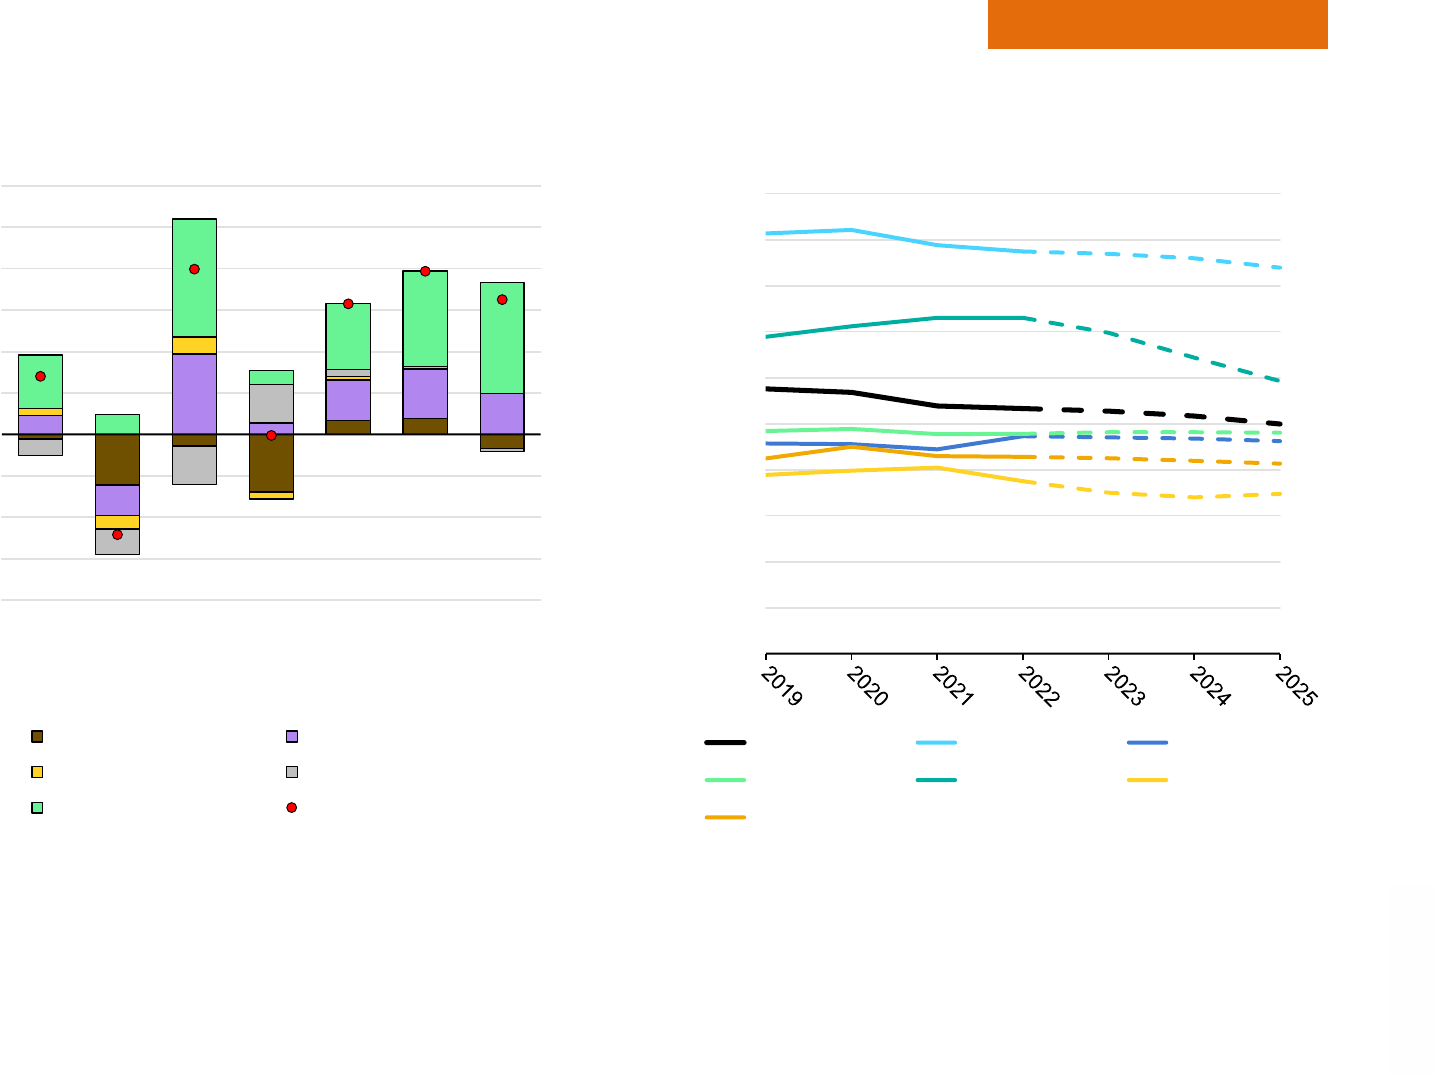
Electricity Market Report 2023
P
AGE | 111
Regional perspectives
IEA. CC BY 4.0.
Renewables lead the race in terms of generation increases, followed by natural gas
Year-on-year change in electricity generation, Africa, 2019-2025
IEA. CC BY 4.0.
Development of average CO
2
intensity, Africa, 2019-2025
IEA. CC BY 4.0.
Notes: Other non-renewables includes oil, waste and other non-renewable energy sources. The CO
2
intensity is calculated as total CO
2
emissions divided by total generation.
- 40
- 30
- 20
- 10
0
10
20
30
40
50
60
2019
2021
2023
2025
TWh
Coal Gas
Nuclear Other non-renewables
Renewables Net change
0
100
200
300
400
500
600
700
800
900
1 000
g CO₂
/kWh
Africa South Africa Egypt
Algeria Morocco Nigeria
Tunisia
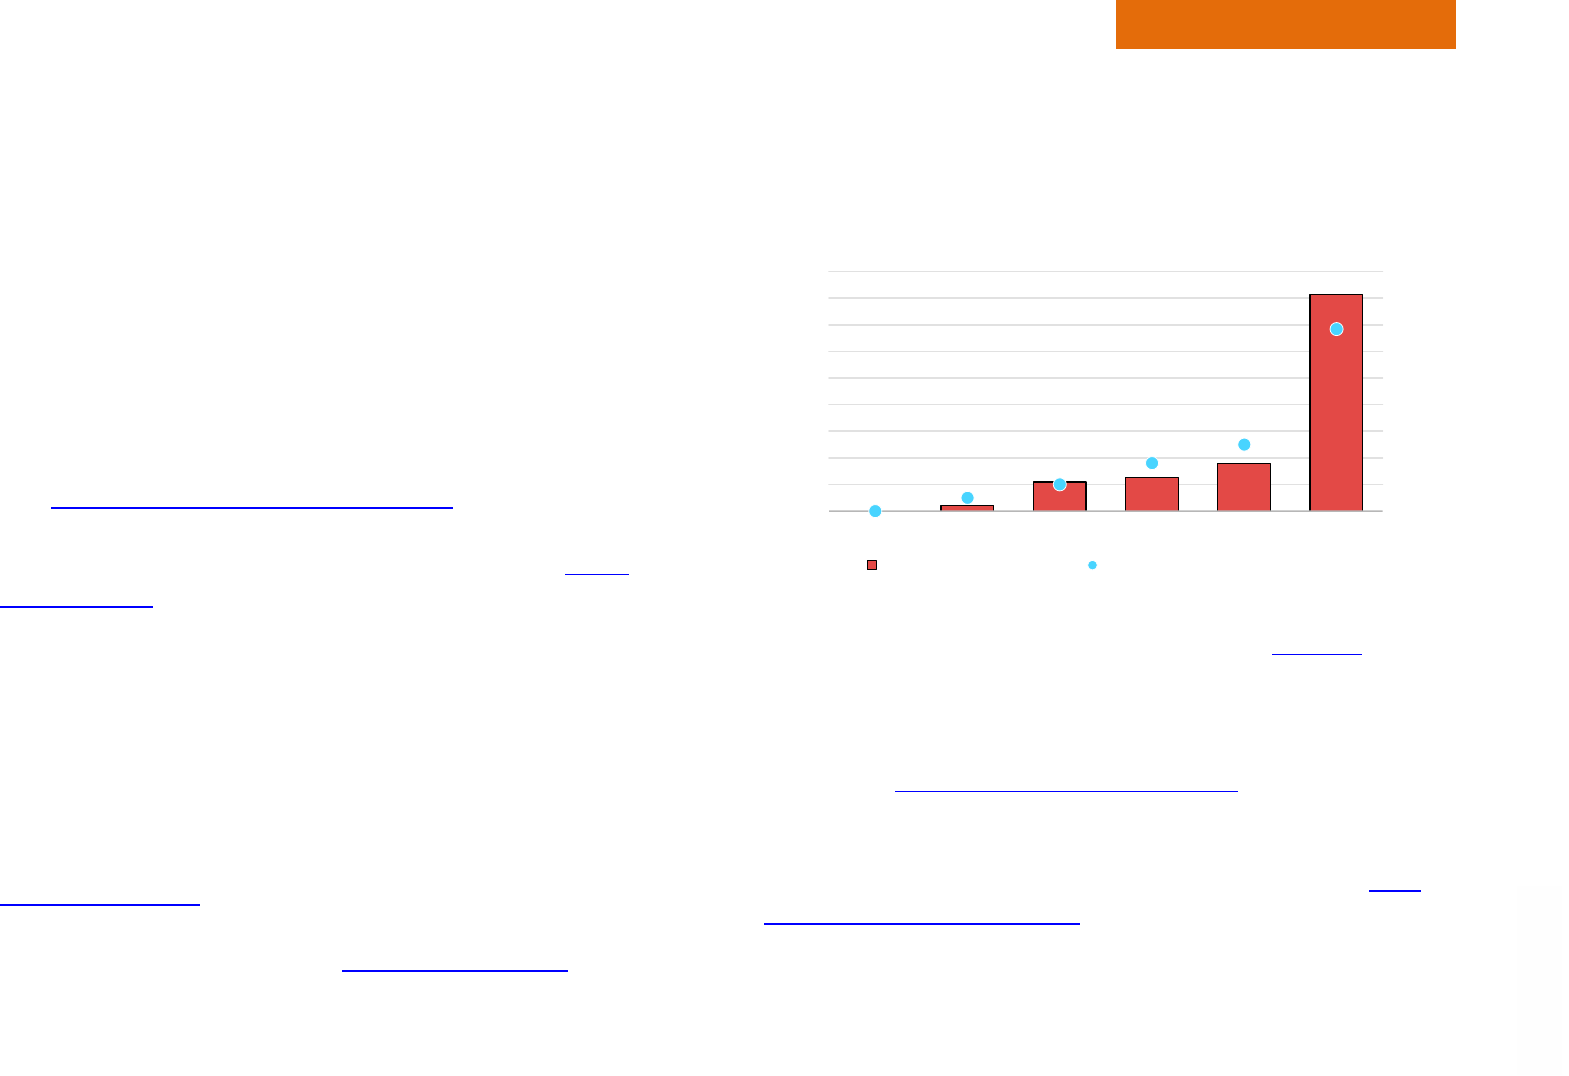
Electricity Market Report 2023
P
AGE | 112
Regional perspectives
IEA. CC BY 4.0.
South Africa
Electricity consumption in South Africa fell by less than 4% y-o-y in
2022, due to declining availability of its ageing coal fleet and delays
in construction and commissioning of new generation projects. This
has resulted in unprecedented amounts of load shedding, with over
8 TWh (or 5% of forecasted annual demand) being reduced through
load shedding during 2022. This represents a fourfold increase in
unmet demand compared to 2021. In addition, load shedding was
implemented 205 days during 2022, approaching almost a threefold
increase on the 75 days in 2021.
At the end of August 2022, Eskom, the state-owned utility, released
their System Status and Outlook for 2022/23
, where its base case
scenario for the period September 2022 to August 2023 would see
a reduction in load shedding to only 24 days. However,
due to
ongoing issues with the commissioning of its new-build coal
generation, it has already seen 46 days of load shedding across
September and October 2022 alone. This aligns with the middle of
its most pessimistic scenarios, which forecasts between 203 and
326 days of load shedding over the September 2022 to August
2023 period, painting a potentially sombre picture for the South
African power sector in 2023, with new sources of generation
needed to lift the country out of this crisis. This is not aided by the
fact that one of the units of its only nuclear plant is also due to be
taken out of service f
or most of the first half of 2023, which will
result in an even tighter system. The outlook could be even more
dire after reports that Eskom had
spent its entire budget f
or the
financial year (April 2022-March 2023) for diesel used in its 3 GW of
gas peaking plants, and therefore this capacity will not be available
until the start of the next financial year in April 2023.
Volume and number of days of load shedding, South Africa,
2017-2022
IEA. All rights reserved.
Source: IEA analysis based on hourly data from Eskom (2023), Data Portal, 18
January 2023.
In July 2022, President Cyril Ramaphosa announced a 10-point
plan to address the ongoing power crisis in South Africa. Measures
included the removal of licensing requirements
f
or private energy
projects, although still retaining the requirement for registration with
the regulator. This builds upon the earlier relaxation of licensing
requirements, which raised the licence exemption threshold
from
1 MW to 100 MW in June 2021. In coming years this should
accelerate Eskom’s and the municipalities’ ability to procure clean
power directly. Already, the change in the licence exemption
0
30
60
90
120
150
180
210
240
270
0
1
2
3
4
5
6
7
8
9
2017 2018 2019 2020 2021 2022
days
GWh
Load shedding Days of load shedding (right-axis)

Electricity Market Report 2023
P
AGE | 113
Regional perspectives
IEA. CC BY 4.0.
threshold in 2021 led to a number of announcements from major
industrial consumers, including many large mining companies, to
power their own operations using a combination of renewable
technologies.
Another measure announced was the almost doubling of the
al
located capacity for procurement in the latest renewable energy
auction (i.e. Bid Window 6 of the REIPP Procurement Programme)
from 2 600 MW to 4 200 MW
. This sixth auction round was
concluded in December 2022, with South Africa selecting five solar
PV projects for a total capacity of 860 MW, significantly lower
capacity compared to the originally planned allocation. The auction
also saw no wind power project selected, due to a lack of grid
capacity for connection.
This is the second auction of this kind after a seven-year disruption
f
ollowing the refusal of Eskom to sign
pow
er purchase agreements
(PPAs) with the preferred bidders of the fourth bid window. While
the preferred bidders for Bid Window 5 have been announced, only
three of the bidders have signed a PPA as the others have
struggled to reach financial close due to delays in receiving
quotations on connection infrastructure from Eskom. An initial
deadline at the end of April 2022 was continuously delayed, then
extended until the end of October 2022 and
has been extended
beyond this date in November. There are also ongoing delays with
the Risk Management IPP Procurement Programme (RMIPPPP)
that aimed to procure 2 GW of firm capacity and was concluded in
2021, but which has been continuously delayed since.
It is expected that capacity from these auctions, along with the
c
oming online of the two coal megaprojects Kusile and Medupi and
improvements to performance of the existing coal fleet, will lead to
an increase in available capacity and a recovery of demand. Given
the uncertainty due to the tight supply situation, we estimate
South African demand and generation could recover to 2021 levels
in 2024-2025. While we expect coal to continue making up the
majority of the South African generation mix (82% in 2025), our
forecast sees the share of renewables increasing to 12% in 2025,
from 9% in 2022.
Egypt
Electricity consumption in Egypt increased by 8% in 2021 after a
2.7% decline in 2020. Growth slowed down in the first seven
months of 2022 to an estimated 3% y-o-y increase
, against the
backdrop of domestic economic pressures and the global energy
crisis. The continuous weakening of the Egyptian pound and
spiralling inflation (24.5% core inflation annualised rate in 2022)
since the beginning of the year puts the country’s economy under
pressure and resulted in a record USD 7.3 billion deficit in the
balance of payments in the first nine months of 2022. For the third
time since 2020, the Egyptian government decided in June to
postpone its planned increase i
n electricity tariffs until early 2023 in
order not to add new burdens on citizens. The country took
measures to reduce its natural gas consumption in power
generation (which provides up to 90% of total generation) in order to
maximise its LNG export volumes and generate revenue in foreign

Electricity Market Report 2023
P
AGE | 114
Regional perspectives
IEA. CC BY 4.0.
currencies. This included substantial switching back to oil-fired
generation, with fuel oil burn averaging above 100 kb/d in the first
nine months of 2022, its highest level in four years.
Demand-side measures were also adopted in order to reduce
electricity consumption. In August 2022, the government
implemented electricity rationing measures
t
argeting reductions in
lighting and air conditioning in administrative buildings, commercial
and leisure facilities, as well as for street lighting.
We estimate a 3%
y-o-y growth in electricity demand in Egypt for
2022, and an average annual 2.4% growth rate in 2023-2025 based
on the combination of an expected prolonged preference for gas
exports against domestic use and planned continuation of electricity
tariff rises as part of a government programme to lift subsidies by
2025.
Egypt has shifted its priority for new capacity from conventional
thermal to low-carbon sources of power generation over recent
years, after strong development of its gas-fired generation fleet in
the mid-2010s. The country currently has 3.1 GW of installed wind
and solar capacity on top of 2.8 GW of hydropower, and an
additional 2.8 GW of planned renewable capacity to be
commissioned by the end of 2023. Diversification and
decarbonisation of the generation mix also includes nuclear, with
the start of construction work for the 4.8 GW El Dabaa plant in
July 2022, which is scheduled for commissioning in 2026. Egypt
aims at using its rising electricity surplus to become a regional hub
for the east Mediterranean, with several transmission projects under
way, including a 3 GW interconnection with Saudi Arabia under
construction and scheduled for 2026, and plans to develop a 3 GW
interconnection with Europe via Greece.
Algeria
Algeria’s installed production capacity grew by 3.2 GW, or about
13%, between September 2021 and August 2022, according to the
government’s policy statement
to t
he parliament in September
2022. State-owned utility Sonelgaz indicated in September that a
new consumption peak record was reached in August 2022 at
16 822 MW. Algeria’s domestic electricity consumption increased by
an estimated 5% in 2021, after a 3% decline in 2020 and an
average 6% growth rate during 2015-2019. The country’s
continuous rise in electricity consumption is supported by
substantial subsidies. In spite of its growing deficit and a
quadrupling of its debt i
n two years, Sonelgaz’ confirmed in August
that tariffs would not be revised. This forecast expects Algeria’s
electricity demand to increase at an average rate of about 5% per
year in 2022-2025.
Algeria seeks to expand its electricity exports to nei
ghbouring
countries in North Africa and Southern Europe, thanks to planned
development of its renewable generation capacity over the next
decade. The country’s energy strategy has set a target of
developing 15 GW of renewable capacity by 2035. Renewable
development operator Shaems announced in July that
first
production of 50 MW from solar should be expected by end 2023
from the 1000 MW solar project currently underway. A potential

Electricity Market Report 2023
P
AGE | 115
Regional perspectives
IEA. CC BY 4.0.
project of a subsea interconnection with Italy was announced in July
and is currently being studied.
Morocco
Electricity consumption increased by 5.5% in 2021 in Morocco,
recovering from a 1.8% decline in 2020. This was supported by a
16% rebound from high-voltage customers, while residential
consumption increased by 2%. Domestic generation grew by 6.7%
year-on-year, principally driven by thermal generation from state-
owned ONEE (up 11.9%), while electricity supplied by independent
power producers (which account for about 60% of total domestic
generation) and from renewable sources both increased by close to
5%. According to statistics from the Ministry of Economy and
Finance, electricity demand rose by 4.8% y-o-y
i
n the first eight
months of 2022, down from 6.5% over the same period in 2021,
principally driven by medium- and low-voltage electricity customers
(up by 7% and 3.8% y-o-y, respectively) while demand from high-
voltage users rose 1.5%. Domestic production was up by 3% y-o-y in
the first eight months of 2022, with renewable generation growing by
8.6% and thermal from ONEE up by 22.6%. Output declined 3.2%
from independent producers. The balance of trade, which had shifted
to net electricity exports in 2021, returned to net imports, with a more
than doubling of imports while exports declined by 29%.
Morocco has experienced strong growth in renewables over the
pas
t several years. As of end 2021, renewable capacity accounted
for 3 950 MW, or 37% of the country’s
installed electricity
generation capacity – with 1 770 MW of hydro, 1 430 MW of wind,
and 750 MW of solar. The country aims to increase the share of
renewable capacity to 52% by 2030, 70% by 2040 and 80% by
2050, and to gradually expand its exports to Europe over the period.
The European Union signed in October 2022 a Green Partnership
on energy, climate and the environment with Morocco, the first of its
kind with a partner country, which will contribute to scale up
cooperation on energy transition and decarbonisation. We forecast
Morocco’s electricity demand to grow at an average annual rate of
2% between 2023 and 2025, similar to generation – with
renewables growing at an average 19% per year while thermal
declines by an annual average of 5% over the same period.
Tunisia
Tunisia’s final consumption of electricity increased by 9% y-o-y in
2021, driven by all types of consumers – the residential sector is the
largest and accounted for 38% of total electricity consumption,
followed by industry with 30%, commercial at 20%, and other
sectors for the remaining 12%. In 2022, total electricity demand
(including the sector’s own consumption and exports) increased by
10%. In comparison, electricity generation grew by 2% to 22 TWh,
principally from gas-fired generation which accounted for close to
94% of total generation. The remaining supply requirements were
met by 1 TWh of renewable electricity generation and by a strong
increase in electricity imports from Algeria (up by close to 1 TWh)
and reduced exports to Libya (down by close to 0.6 TWh). Statistics
from the Ministry of Industry, Energy and Mines indicate that
Tunisia’s reliance on electricity imports
f
urther increased in the first

Electricity Market Report 2023
P
AGE | 116
Regional perspectives
IEA. CC BY 4.0.
ten months of 2022 due to higher gas import prices, up by a sharp
150%, from 864 GWh to 2 169 GWh, a jump from less than 5% of
total supply to over 11%. This stems from a 2% decline in domestic
generation from gas-fired plants from independent power producers
(down 74% from 2 725 GWh to 706 GWh over January to October)
while generation from state-owned STEG (also primarily gas-driven)
increased by 12% to 16 024 GWh to bridge the gap. Electricity
consumption increased by 6% y-o-y in January through October,
driven by low- and medium-voltage customers (up by 9% and 6%,
respectively) while demand from high-voltage customers declined
7%.
We forecast an average 3% growth per year in Tunisia’s electricity
consumption in the 2023-2025 period, principally met by growing
domestic renewable generation. Generation from renewable
sources is expected to increase by 80% between 2022 and 2025
and reach around 2 TWh by the end of the period – or the
equivalent of close to 8% of Tunisia’s electricity consumption,
against less around 5% in 2022. Tunisia’s
energy strategy pl
an to
2030 targets a 30% share of renewables by the end of the decade.
Nigeria
Access to electricity in Nigeria is hampered by insufficient available
power generation and transmission capacity, and is further
constrained by grid collapses. According to industry data, Nigeria’s
power grid collapsed seven times
i
n January through to September
2022. This is higher than in 2020 and 2021, when there were four
grid collapses each year according to the
Nigerian Electricity
Regulatory Commission, but still shows some improvement
compared to the average rate of default observed since 2015, which
averaged 13 collapses per year (with a peak of 28 in 2016).
Earlier this year, President Buhari announced that electricity
av
ailability issues were mainly caused by low gas-fired generation
(which represents 73% of the electricity mix in 2022) resulting from
sabotage of gas pipelines. A report from Nigeria’s Association of
Power Generation Companies showed that the country’s average
available generation capacity fell to its
lowest level in seven years i
n
2022 (January to August) with 5 634 MW available, 20% below an
annual average of 7 078 MW over the reported period, and 28%
below the highest capacity – recorded in 2020 (7 792 MW).
New capacity is expected to be commissioned in early 2023, with
t
he start-up of the 700 MW Zungeru hydroelectric power plant
scheduled for the first quarter. President Buhari reaffirmed
in
October 2022 the country’s dedication to the Presidential Power
Initiative, an ambitious electricity development plan launched in
2019 with Siemens and with the support of the German
government, which would raise the country’s total available
generation capacity to 25 GW by 2025. The Senate passed a
constitutional amendment bill i
n July 2022 that would allow states to
own and develop electricity generation, transmission and
distribution capacity. This proposed removal of the federal state’s
monopoly on the electricity system would contribute to foster
investment in new capacity through public-private partnerships.
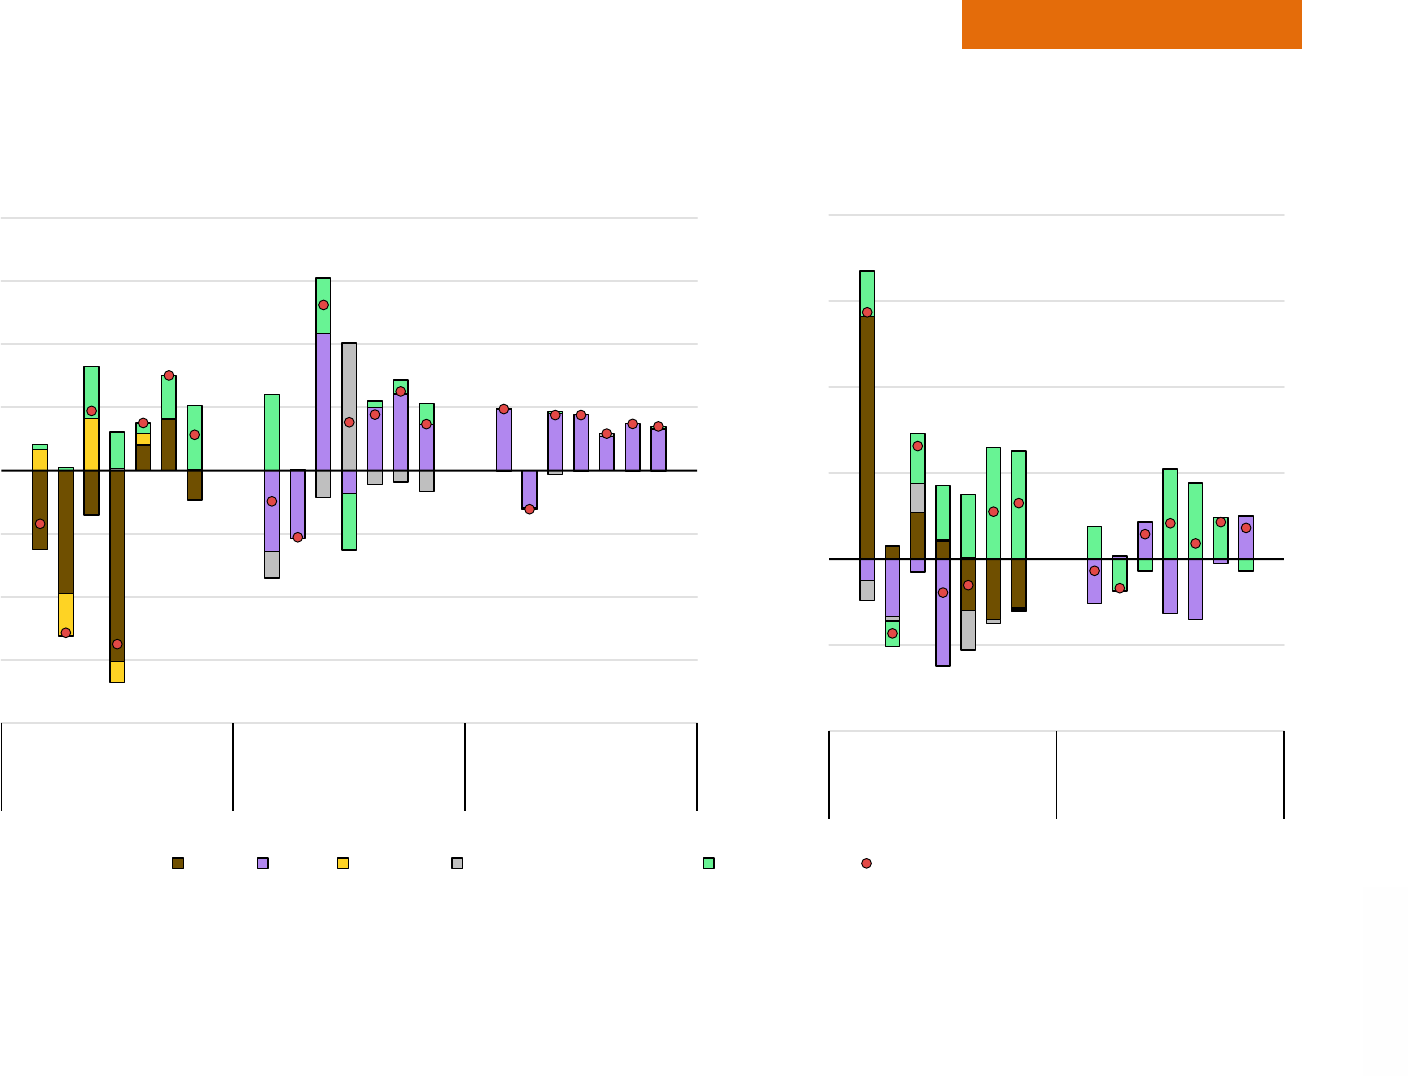
Electricity Market Report 2023
P
AGE | 117
Regional perspectives
IEA. CC BY 4.0.
Morocco set to see the highest relative growth in renewables in Africa, followed by South Africa
Year-on-year change in electricity generation in selected countries in Africa, 2019-2025
IEA. CC BY 4.0.
Note: Other non-renewables includes oil, waste and other non-renewable energy sources.
- 20
- 15
- 10
- 5
0
5
10
15
20
2019
2021
2023
2025
2019
2021
2023
2025
2019
2021
2023
2025
South Africa
Egypt
Algeria
TWh
Coal Gas Nuclear Other non-renewables Renewables Net change
- 4
- 2
0
2
4
6
8
2019
2021
2023
2025
2019
2021
2023
2025
Morocco Nigeria
TWh

Electricity Market Report 2023
P
AGE | 118
Annex
IEA. CC BY 4.0.
General annex

Electricity Market Report 2023
P
AGE | 119
Annex
IEA. CC BY 4.0.
Summary table: Demand
Regional breakdown of electricity demand, 2020-2025
TWh 2020 2021 2022 2025
Growth rate
2020-2021
Growth rate
2021-2022
CAAGR
2023-2025
Africa 707 747 758 856 5.7% 1.5% 4.1%
Americas 6 037 6 200 6 342 6 535 2.7% 2.3% 1.0%
of which United States 4 109 4 211 4 320 4 402 2.5% 2.6% 0.6%
Asia Pacific 12 118 13 045 13 479 15 428 7.7% 3.3% 4.6%
of which China 7 471 8 188 8 400 9 790 9.6% 2.6% 5.2%
Eurasia 1 234 1 309 1 332 1 349 6.1% 1.8% 0.4%
Europe 3 648 3 817 3 675 3 846 4.6% -3.7% 1.5%
of which European Union 2 625 2 751 2 656 2 773 4.8% -3.5% 1.4%
Middle East 1 115 1 162 1 192 1 268 4.2% 2.6% 2.1%
World 24 860 26 281 26 779 29 281 5.7% 1.9% 3.0%
Notes: CAAGR = compounded average annual growth rate. For the CAAGR 2023-2025 reported, end of 2022 data is taken as base year for the calculation. For the entire period
European Union data is for the current 27 member states. Data for 2021 are preliminary; 2022 data are estimated; 2023 to 2025 are forecasts. Differences in totals are due to
rounding.

Electricity Market Report 2023
P
AGE | 120
Annex
IEA. CC BY 4.0.
Summary table: Supply and emissions, world
Breakdown of electricity sector supply and emissions, 2020-2025
TWh 2020 2021 2022 2025
Growth rate
2020-2021
Growth rate
2021-2022
CAAGR
2023-2025
Nuclear 2 676 2 803 2 684 2 986 4.8% -4.3% 3.6%
Coal 9 414 10 171 10 325 10 217 8.0% 1.5% -0.3%
Gas 6 330 6 489 6 500 6 522 2.5% 0.2% 0.1%
Other non-renewables 776 764 785 611 -1.5% 2.7% -8.0%
Total renewables 7 475 7 902 8 349 10 799 5.7% 5.7% 9.0%
Total generation 26 671 28 129 28 642 31 135 5.5% 1.8% 2.8%
Mt CO
2
2020 2021 2022 2025
Growth rate
2020-2021
Growth rate
2021-2022
CAAGR
2023-2025
Total emissions 12 302 13 039 13 207 13 043 6.0% 1.3% -0.4%
Notes: CAAGR = compound average annual growth rate. For the CAAGR 2023-2025 reported, end of 2022 data is taken as base year for the calculation. Data for 2021 are
preliminary; 2022 data are estimated; 2023-2025 are forecasts. Differences in totals are due to rounding. Unless otherwise specified, generation numbers refer to gross generation.

Electricity Market Report 2023
P
AGE | 121
Annex
IEA. CC BY 4.0.
Summary table: Supply and emissions, Asia Pacific
Breakdown of electricity sector supply and emissions, Asia Pacific, 2020-2025
TWh 2020 2021 2022 2025
Growth rate
2020-2021
Growth rate
2021-2022
CAAGR
2023-2025
Nuclear 653 723 750 908 10.8% 3.7% 6.6%
Coal 7 334 7 898 8 092 8 407 7.7% 2.5% 1.3%
Gas 1 502 1 508 1 438 1 495 0.4% -4.6% 1.3%
Other non-renewables 162 148 172 129 -8.2% 15.5% -9.0%
Total renewables 3 190 3 524 3 758 5 224 10.5% 6.6% 11.6%
Total generation 12 841 13 801 14 209 16 163 7.5% 3.0% 4.4%
Mt CO
2
2020 2021 2022 2025
Growth rate
2020-2021
Growth rate
2021-2022
CAAGR
2023-2025
Total emissions 7 739 8 224 8 395 8 694 6.3% 2.1% 1.2%
Notes: CAAGR = compound average annual growth rate. For the CAAGR 2023-2025 reported, end of 2022 data is taken as base year for the calculation. Data for 2021 are
preliminary; 2022 data are estimated; 2023-2025 are forecasts. Differences in totals are due to rounding. Unless otherwise specified, generation numbers refer to gross generation.

Electricity Market Report 2023
P
AGE | 122
Annex
IEA. CC BY 4.0.
Summary table: Supply and emissions, Americas
Breakdown of electricity sector supply and emissions, Americas, 2020-2025
TWh 2020 2021 2022 2025
Growth rate
2020-2021
Growth rate
2021-2022
CAAGR
2023-2025
Nuclear 954 941 924 941 -1.4% -1.8% 0.6%
Coal 973 1 098 1 027 808 12.9% -6.5% -7.7%
Gas 2 162 2 160 2 223 2 241 -0.1% 2.9% 0.3%
Other non-renewables 180 192 182 156 7.0% -5.6% -5.0%
Total renewables 2 213 2 255 2 461 2 847 1.9% 9.1% 5.0%
Total generation 6 482 6 646 6 816 6 993 2.5% 2.6% 0.9%
Mt CO
2
2020 2021 2022 2025
Growth rate
2020-2021
Growth rate
2021-2022
CAAGR
2023-2025
Total emissions 1 927 2 062 2 008 1 789 7.0% -2.6% -3.8%
Notes: CAAGR = compound average annual growth rate. For the CAAGR 2023-2025 reported, end of 2022 data is taken as base year for the calculation. Data for 2021 are
preliminary; 2022 data are estimated; 2023-2025 are forecasts. Differences in totals are due to rounding. Unless otherwise specified, generation numbers refer to gross generation.

Electricity Market Report 2023
P
AGE | 123
Annex
IEA. CC BY 4.0.
Summary table: Supply and emissions, Europe
Breakdown of electricity sector supply and emissions, Europe, 2020-2025
TWh 2020 2021 2022 2025
Growth rate
2020-2021
Growth rate
2021-2022
CAAGR
2023-2025
Nuclear 834 885 746 845 6.1% -15.7% 4.2%
Coal 584 653 681 513 11.7% 4.4% -9.0%
Gas 801 844 822 581 5.3% -2.6% -10.9%
Other non-renewables 87 87 86 69 0.4% -0.6% -7.4%
Total renewables 1 577 1 579 1 593 2 086 0.1% 0.9% 9.4%
Total generation 3 884 4 047 3 929 4 095 4.2% -2.9% 1.4%
Mt CO
2
2020 2021 2022 2025
Growth rate
2020-2021
Growth rate
2021-2022
CAAGR
2023-2025
Total emissions 925 1 005 1 023 763 8.6% 1.8% -9.3%
Notes: CAAGR = compound average annual growth rate. For the CAAGR 2023-2025 reported, end of 2022 data is taken as base year for the calculation. Data for 2021 are
preliminary; 2022 data are estimated; 2023-2025 are forecasts. Differences in totals are due to rounding. Unless otherwise specified, generation numbers refer to gross generation.

Electricity Market Report 2023
P
AGE | 124
Annex
IEA. CC BY 4.0.
Summary table: Supply and emissions, Eurasia
Breakdown of electricity sector supply and emissions, Eurasia, 2020-2025
TWh 2020 2021 2022 2025
Growth rate
2020-2021
Growth rate
2021-2022
CAAGR
2023-2025
Nuclear 219 224 225 229 2.6% 0.3% 0.6%
Coal 256 261 281 251 1.8% 7.8% -3.8%
Gas 604 659 679 714 9.1% 3.0% 1.7%
Other non-renewables 12 13 12 12 12.8% -6.5% -1.4%
Total renewables 277 294 277 289 6.2% -6.0% 1.4%
Total generation 1 368 1 452 1 474 1 495 6.1% 1.5% 0.5%
Mt CO
2
2020 2021 2022 2025
Growth rate
2020-2021
Growth rate
2021-2022
CAAGR
2023-2025
Total emissions 530 560 592 599 5.6% 5.8% 0.4%
Notes: CAAGR = compound average annual growth rate. For the CAAGR 2023-2025 reported, end of 2022 data is taken as base year for the calculation. Data for 2021 are
preliminary; 2022 data are estimated; 2023-2025 are forecasts. Differences in totals are due to rounding. Unless otherwise specified, generation numbers refer to gross generation.

Electricity Market Report 2023
P
AGE | 125
Annex
IEA. CC BY 4.0.
Summary table: Supply and emissions, Middle East
Breakdown of electricity sector supply and emissions, Middle East, 2020-2025
TWh 2020 2021 2022 2025
Growth rate
2020-2021
Growth rate
2021-2022
CAAGR
2023-2025
Nuclear 6 15 26 50 160.8% 70.2% 24.5%
Coal 20 18 13 4 -10.7% -27.4% -30.6%
Gas 917 955 973 1 094 4.1% 1.9% 4.0%
Other non-renewables 288 285 285 196 -1.3% 0.2% -11.8%
Total renewables 40 44 50 77 10.5% 14.7% 15.3%
Total generation 1 270 1 316 1 346 1 420 3.6% 2.3% 1.8%
Mt CO
2
2020 2021 2022 2025
Growth rate
2020-2021
Growth rate
2021-2022
CAAGR
2023-2025
Total emissions 708 720 725 711 1.7% 0.7% -0.6%
Notes: CAAGR = compound average annual growth rate. For the CAAGR 2023-2025 reported, end of 2022 data is taken as base year for the calculation. Data for 2021 are
preliminary; 2022 data are estimated; 2023-2025 are forecasts. Differences in totals are due to rounding. Unless otherwise specified, generation numbers refer to gross generation.

Electricity Market Report 2023
P
AGE | 126
Annex
IEA. CC BY 4.0.
Summary table: Supply and emissions, Africa
Breakdown of electricity sector supply and emissions, Africa, 2020-2025
TWh 2020 2021 2022 2025
Growth rate
2020-2021
Growth rate
2021-2022
CAAGR
2023-2025
Nuclear 10 14 12 13 41.9% -12.0% 2.3%
Coal 247 244 231 234 -1.1% -5.7% 0.5%
Gas 344 363 366 398 5.6% 0.8% 2.8%
Other non-renewables 48 38 48 49 -19.3% 23.9% 1.1%
Total renewables 178 206 209 275 16.0% 1.7% 9.5%
Total generation 826 866 866 970 4.8% 0.1% 3.8%
Mt CO
2
2020 2021 2022 2025
Growth rate
2020-2021
Growth rate
2021-2022
CAAGR
2023-2025
Total emissions 472 469 464 487 -0.6% -1.1% 1.6%
Notes: CAAGR = compound average annual growth rate. For the CAAGR 2023-2025 reported, end of 2022 data is taken as base year for the calculation. Data for 2021 are
preliminary; 2022 data are estimated; 2023-2025 are forecasts. Differences in totals are due to rounding. Unless otherwise specified, generation numbers refer to gross generation.

Electricity Market Report 2023
P
AGE | 127
Annex
IEA. CC BY 4.0.
Regional and country groupings
Africa – Algeria, Angola, Benin, Botswana, Cameroon, Congo,
Democratic Republic of the Congo, Côte d’Ivoire, Egypt, Equatorial
Guinea, Eritrea, Ethiopia, Gabon, Ghana, Kenya, Libya, Mauritius,
Morocco, Mozambique, Namibia, Niger, Nigeria, Senegal, South
Africa, South Sudan, Sudan, United Republic of Tanzania, Togo,
Tunisia, Zambia, Zimbabwe and other African countries and
territories.
1
Asia – Bangladesh, Brunei Darussalam, Cambodia, Chinese
Taipei, India, Indonesia, Japan, Korea, Democratic People’s
Republic of Korea, Lao People’s Democratic Republic, Malaysia,
Mongolia, Myanmar, Nepal, Pakistan, People’s Republic of China,
2
Philippines, Singapore, Sri Lanka, Thailand, Viet Nam and other
Asian countries, territories and economies.
3
Asia Pacific – Australia, Bangladesh, Brunei Darussalam,
Cambodia, Chinese Taipei, India, Indonesia, Japan, Korea,
Democratic People’s Republic of Korea, Lao People’s Democratic
Republic, Malaysia, Mongolia, Myanmar, Nepal, New Zealand,
Pakistan, People’s Republic of China,
2
Philippines, Singapore, Sri
Lanka, Thailand, Viet Nam and other Asian countries, territories and
economies.
4
Central and South America – Argentina, Bolivia, Brazil, Chile,
Colombia, Costa Rica, Cuba, Curaçao, Dominican Republic,
Ecuador, El Salvador, Guatemala, Haiti, Honduras, Jamaica,
Nicaragua, Panama, Paraguay, Peru, Suriname, Trinidad and
Tobago, Uruguay, Venezuela and other Latin American countries
and territories.
5
Eurasia – Armenia, Azerbaijan, Georgia, Kazakhstan, Kyrgyzstan,
Russian Federation, Tajikistan, Turkmenistan and Uzbekistan.
Europe – Albania, Austria, Belgium, Belarus, Bosnia and
Herzegovina, Bulgaria, Croatia, Cyprus,
6,7
Czech Republic,
Denmark, Estonia, Finland, France, Germany, Gibraltar, Greece,
Hungary, Iceland, Ireland, Italy, Kosovo
8
Latvia, Lithuania,
Luxembourg, Malta, Montenegro, Netherlands, North Macedonia,
Norway, Poland, Portugal, Republic of Moldova, Romania, Serbia,
Slovak Republic, Slovenia, Spain, Sweden, Switzerland, Republic of
Türkiye, Ukraine and United Kingdom.
European Union – Austria, Belgium, Bulgaria, Croatia, Cyprus,
6,7
Czech Republic, Denmark, Estonia, Finland, France, Germany,
Greece, Hungary, Ireland, Italy, Latvia, Lithuania, Luxembourg,
Malta, Netherlands, Poland, Portugal, Romania, Slovak Republic,
Slovenia, Spain and Sweden.
Middle East – Bahrain, Islamic Republic of Iran, Iraq, Israel
9
,
Jordan, Kuwait, Lebanon, Oman, Qatar, Saudi Arabia, Syrian Arab
Republic, United Arab Emirates and Yemen.
Nordics – Denmark, Finland, Norway, Sweden
North Africa – Algeria, Egypt, Libya, Morocco and Tunisia.
North America – Canada, Mexico and United States.

Electricity Market Report 2023
P
AGE | 128
Annex
IEA. CC BY 4.0.
Southeast Asia – Brunei Darussalam, Cambodia, Indonesia, Lao,
People’s Democratic Republic, Malaysia, Myanmar, Philippines,
Singapore, Thailand and Viet Nam. These countries are all
members of the Association of Southeast Asian Nations (ASEAN).
Advanced economies – OECD member nations, plus Bulgaria,
Croatia, Cyprus, Malta and Romania.
Emerging markets and developing economies – All other
countries not included in the advanced economies regional
grouping.
1
Individual data are not available and are estimated in aggregate for: Burkina Faso, Burundi,
Cape Verde, Central African Republic, Chad, Comoros, Djibouti, Gambia, Guinea, Guinea-
Bissau, Lesotho, Liberia, Madagascar, Malawi, Mali, Mauritania, Reunion, Rwanda, Sao Tome
and Principe, Seychelles, Sierra Leone, Somalia, Eswatini and Uganda.
2
Including Hong Kong.
3
Individual data are not available and are estimated in aggregate for: Afghanistan, Bhutan,
Macau (China), Maldives and Timor-Leste.
4
Individual data are not available and are estimated in aggregate for: Afghanistan, Bhutan, Cook
Islands, Fiji, French Polynesia, Kiribati, Macau (China), Maldives, New Caledonia, Palau, Papua
New Guinea, Samoa, Solomon Islands, Timor-Leste, Tonga and Vanuatu.
5
Individual data are not available and are estimated in aggregate for: Anguilla, Antigua and
Barbuda, Aruba, Bahamas, Barbados, Belize, Bermuda, British Virgin Islands, Cayman Islands,
Dominica, Falkland Islands (Malvinas), Grenada, Guyana, Montserrat, Saba, Saint Eustatius,
Saint Kitts and Nevis, Saint Lucia, Saint Pierre and Miquelon, Saint Vincent and the Grenadines,
Sint Maarten, and the Turks and Caicos Islands.
6
Note by Türkiye: The information in this document with reference to “Cyprus” relates to the
southern part of the Island. There is no single authority representing both Turkish and Greek
Cypriot people on the Island. Türkiye recognises the Turkish Republic of Northern Cyprus
(TRNC). Until a lasting and equitable solution is found within the context of United Nations,
Türkiye shall preserve its position concerning the “Cyprus issue”.
7
Note by all the European Union Member States of the OECD and the European Union: The
Republic of Cyprus is recognised by all members of the United Nations with the exception of
Türkiye. The information in this document relates to the area under the effective control of the
Government of the Republic of Cyprus.
8
The designation is without prejudice to positions on status and is in line with the United Nations
Security Council Resolution 1244/99 and the Advisory Opinion of the International Court of
Justice on Kosovo’s declaration of Independence.
9
The statistical data for Israel are supplied by and under the responsibility of the relevant Israeli
authorities. The use of such data by the OECD and/or the IEA is without prejudice to the status of
the Golan Heights, East Jerusalem and Israeli settlements in the West Bank under the terms of
international law.

Electricity Market Report 2023
P
AGE | 129
Annex
IEA. CC BY 4.0.
Abbreviations and acronyms
ASEAN Association of Southeast Asian Nations
CAAGR Compound average annual growth rate. Throughout
the report we refer to the CAAGR when talking about
average growth.
CCGT combined-cycle gas turbine
CFE Federal Electricity Commission (Mexico)
EC European Commission
EMDEs Emerging Markets and Developing Economies
ETS emissions trading system
EU European Union
EUA European Union Allowance (emissions)
EU ETS European Union Emissions Trading System
FY fiscal year
GCC Gulf Cooperation Council
GDP Gross Domestic Product
GHG greenhouse gas
IEA International Energy Agency
IEX Indian Energy Exchange
IMF International Monetary Fund
LNG liquefied natural gas
MoU memorandum of understanding
NDCs Nationally Determined Contributions
NERC North American Electric Reliability Corporation (US)
OECD Organisation for Economic Co-operation and
Development
PPA power purchase agreement
RE renewable energy
REIPPPP Renewable Energy Independent Power Producer
Procurement Programme (South Africa)
RES renewable energy sources
RMIPPPP Risk Mitigation Independent Power Producer
Procurement Programme (South Africa)
TSO transmission system operator
PV photovoltaic
TTF Title Transfer Facility (the Netherlands)
UAE United Arab Emirates
UK United Kingdom
US United States
UN United Nations
VAT value-added tax

Electricity Market Report 2023
P
AGE | 130
Annex
IEA. CC BY 4.0.
Units of measure
CO
2
carbon dioxide
g CO
2
gramme of carbon dioxide
g CO
2
/kWh gramme of carbon dioxide per kilowatt hour
Gt CO
2
gigatonne of carbon dioxide
GW gigawatt
kWh kilowatt hour
MBtu million British thermal units
mcm/d million cubic metres per day
Mt CO
2
million tonnes of carbon dioxide
Mt/yr million tonnes per year
MW megawatt
MWh megawatt-hour
t CO
2
tonne of carbon dioxide
t CO
2
-eq tonne of carbon dioxide equivalent
TWh terawatt-hour

Electricity Market Report 2023
P
AGE | 131
Annex
IEA. CC BY 4.0.
Acknowledgements, contributors and credits
This publication has been prepared by the Gas, Coal and Power
Markets (GCP) Division of the International Energy Agency (IEA).
The report was led and coordinated by Eren Çam, Energy Analyst
for Electricity.
Javier Jorquera Copier led the modelling and coordinated earlier
stages of the production of the report. The main authors are (in
alphabetical order): Eren Çam, Julia Guyon, Zoe Hungerford, Javier
Jorquera Copier, and Martin Strand Husek. The report also
benefited from analysis, data and input from Carlos Fernández
Álvarez, Louis Chambeau, Jean-Baptiste Dubreuil, Keith Everhart,
David Fischer, Craig Hart, Tetsuro Hattori, Pablo Hevia-Koch, YuJin
Jeong, Luis Lopez, Akos Losz, Gergely Molnár, Gabriel Saive,
Enrique Gutiérrez Tavarez, Camille Paillard, and Jacques Warichet.
Arne Lilienkamp, Stefan Lorenczik, Javier Sesma Montolar, and
Jonas Zinke, former IEA colleagues, and Astha Guptha, IEA
consultant, also provided valuable analysis.
Keisuke Sadamori, director of the IEA Energy Markets and Security
(EMS) Directorate, and Carlos Fernández Álvarez, Acting Head of
GCP, provided expert guidance and advice.
Further IEA colleagues provided valuable input, comments and
feedback, in particular Nadim Abillama, Fengquan An, Yasmine
Arsalane, Heymi Bahar, Alessandro Blasi, Laura Cozzi, Davide
D’Ambrosio, Dan Dorner, Carole Etienne, Syrine El Abed, Pablo
González, Tim Gould, Haneul Kim, Jinpyung Kim, Rita Madeira,
Laura Marí Martínez, Rebecca McKimm, Jack Miller, Arnaud
Rouget, Diana Pérez Sánchez, Apostolos Petropoulos, Isaac
Portugal, Hiroyasu Sakaguchi, Brent Wanner, Biqing Yang.
Timely and comprehensive data from the Energy Data Centre were
fundamental to the report. Particularly, we thank to Aloys Nghiem,
Alessia Scoz, and Marta Silva. We also thank Einar Einarsson for
his assistance on setting up the peer review.
The authors would also like to thank Diane Munro for skilfully editing
the manuscript and the IEA Communication and Digital Office, in
particular Brainard Curtis, Astrid Dumond, Jad Mouawad, Jethro
Mullen, Isabelle Nonain-Semelin, Gregory Viscusi and Therese
Walsh.
Several international experts provided input and/or reviewed the
draft report. Their suggestions and comments were very valuable.
They include: A Balan (CEA), Rhea Caguete (IEMOP), Bram
Claeys (The Regulatory Assistance Project), Brent Dixon (Idaho
National Laboratory), Ganesh Doluweera (Canada Energy
Regulator), Gina Downes (Eskom), Carlos Finat (independent
consultant), Marco Foresti (ENTSO-E), Peter Fraser (independent
consultant), Rafaila Grigoriou (VaasaETT), Michael Grubb (UCL),
Renato Haddad (EPE), Edwin Haesen (ENTSO-E), Cristián Herrera
(ACERA), Sarah Keay-Bright (National Grid ESO), Donghoon Kim
(SK), Francisco Laverón (Iberdrola), Sanglim Lee (KEEI), Xiaomeng
Lei (CEC), Stefan Lorenczik (Frontier Economics), Tatiana Mitrova
(Columbia University), Enrique De Las Morenas Moneo (ENEL),
Emmanuel Neau (EDF R&D), Luiz Gustavo Silva de Oliveira (IEA

Electricity Market Report 2023
P
AGE | 132
Annex
IEA. CC BY 4.0.
consultant), Anne Radermecker (European Commission), Noor
Miza Razali (Tenaga Nasional Berhad), SC Saxena (POSOCO),
Abdullah Al Shereiqi (R&D, Oman), María Sicilia (Enagas),
Fereidoon Sioshansi (Menlo Energy Economics), Henrike Sommer
(Aurora Energy Research), Carlos Suazo (Ministry of Energy of
Chile/SPEC/ISCI), Arjon Valencia (IEMOP), Matthew Wittenstein
(United Nations ESCAP), Karen E. Young (Columbia University)
and Rina Bohle Zeller (Vestas).
The individuals and organisations that contributed to this report are
not responsible for any opinion or judgement it contains. Any error
or omission is the sole responsibility of the IEA.
For questions and comments, please contact GCP ([email protected]
).

Electricity Market Report 2023
P
AGE | 133
Annex
IEA. CC BY 4.0.
International Energy Agency (IEA)
This work reflects the views of the IEA Secretariat but does not
necessarily reflect those of the IEA’s individual member countries or
of any particular funder or collaborator. The work does not
constitute professional advice on any specific issue or situation. The
IEA makes no representation or warranty, express or implied, in
respect of the work’s contents (including its completeness or
accuracy) and shall not be responsible for any use of, or reliance
on, the work.
For further information, please contact: GCP ([email protected]).
Subject to the IEA’s Notice for CC-licenced
C
ontent, this work is
licenced under a Creative Commons Attribution 4.0 International
Licence.
This document and any map included herein are without prejudice
to the status of or sovereignty over any territory, to the delimitation
of international frontiers and boundaries and to the name of any
territory, city or area.
Unless otherwise indicated, all material presented in figures and
tables is derived from IEA data and analysis.
IEA Publications
International Energy Agency
Website: www.iea.org
Contact information: www.iea.org/about/contact
Typeset in France by the IEA – February 2023
Cover design: IEA
Photo credits: © GettyImages