United Nations
ENERGY STATISTICS
POCKETBOOK
2019
Department of Economic and Social Aairs

ST/ESA/STAT/SER.E/2
Department of Economic and Social Affairs
Statistics Division
Statistics Papers
Series E No.2
2019
Energy Statistics Pocketbook
United Nations
New York, 2019
Department of Economic and Social Affairs
The Department of Economic and Social Affairs of the United Nations is a vital
interface between global policies in the economic, social and environmental
spheres and national action. The Department works in three main interlinked
areas: (i) it compiles, generates and analyses a wide range of economic, social
and environmental data and information on which United Nations Member
States draw to review common problems and to take stock of policy options;
(ii) it facilitates the negotiations of Member States in many intergovernmental
bodies on joint courses of action to address ongoing or emerging global
challenges; and (iii) it advises interested Governments on the ways and means
of translating policy frameworks developed in United Nations conferences and
summits into programmes at the country level and, through technical
assistance, helps build national capacities.
Note
The designations employed and the presentation of the material in the present
publication do not imply the expression of any opinion whatsoever on the part
of the United Nations concerning the legal status of any country or of its
authorities, or the delimitations of its frontiers. The term “country” as used in this
report also refers, as appropriate, to territories or areas. The designations of
country groups are intended solely for statistical or analytical convenience and
do not necessarily express a judgement about the stage reached by a
particular country, territory or area in the development process. Mention of the
names of firms and commercial products does not imply endorsement by the
United Nations. The symbols of United Nations documents are composed of
capital letters and numbers.
ST/ESA/STAT/SER.E/2
UNITED NATIONS PUBLICATION
Sales number: E.19.XVII.8
ISBN 978-92-1-159120-0
eISBN 978-92-1-047681-2
print ISSN 2617-2828
online ISSN 2617-2836
Copyright United Nations 2019
All rights reserved
iii
Content
Page
Introduction…………………………………………………………………….........
iv
Total energy supply…………………………………………………………………
1
Primary energy production………………………………………….……………
6
Electricity…………………………………………………………………...…………
19
Refinery output………………………………………………………………………
32
Total final consumption………………………………………………….………...
36
Energy balances……...…………………………………………………..………...
42
Energy indicators………………………………………………………….………...
56
General notes……………………………………………………………..………...
68

iv
Introduction
This publication is the second in a series of pocketbook compilations on
energy statistics designed to highlight the availability of data on various
aspects of energy production, transformation and use and its linkages to
other key statistics. Energy is central to the achievement of the 2030
Agenda for Sustainable Development and the Paris Agreement on climate
change, and sound energy statistics are the basis for the reliable
measurement of progress, thereby assisting the formulation of policy
measures to achieve international and national sustainable development
goals.
The information in this publication is primarily based on the energy data
collection carried out by the Energy Statistics Section of the United Nations
Statistics Division (UNSD). The data are available in the 2016 editions of the
Energy Statistics Yearbook, the Energy Balances, and the Electricity Profiles,
three annual UNSD publications that present energy data in basic indicator
formats, as well as formats that show a more detailed, yet number-heavy,
picture of production, trade, transformation and consumption of energy
products in more than 200 countries and territories.
The present publication aims at providing additional information by
highlighting key indicators and using different visualizations to also show
developments, dependencies and distributions in a way that standard
data tables cannot convey.
More information about the data collection process, as well as the three
publications underlying the information in this pocketbook, are available at
https://unstats.un.org/unsd/energy.
Acknowledgements
This publication has been compiled by the Energy Statistics Section of UNSD,
which is headed by Mr. Leonardo Souza. The conceptual design of this
pocketbook has been carried out by Mr. Souza, Ms. Agnieszka Koscielniak
and Ms. Costanza Giovannelli, based on the original conceptual
framework developed also with the contribution from Mr. Ralf Becker,
former Chief of the Section. Ms. Giovannelli took the lead in the graphic
design, supported by Mr. Graham Osborn and Ms. Peng Guo. The energy
data used for the pocketbook have been collected and processed by the
staff of the Energy Statistics Section.
Enquiries, comments and suggestions for improving this publication are
welcome and should be addressed to: [email protected].
2019 Energy Statistics Pocketbook
United Nations Statistics Division
1
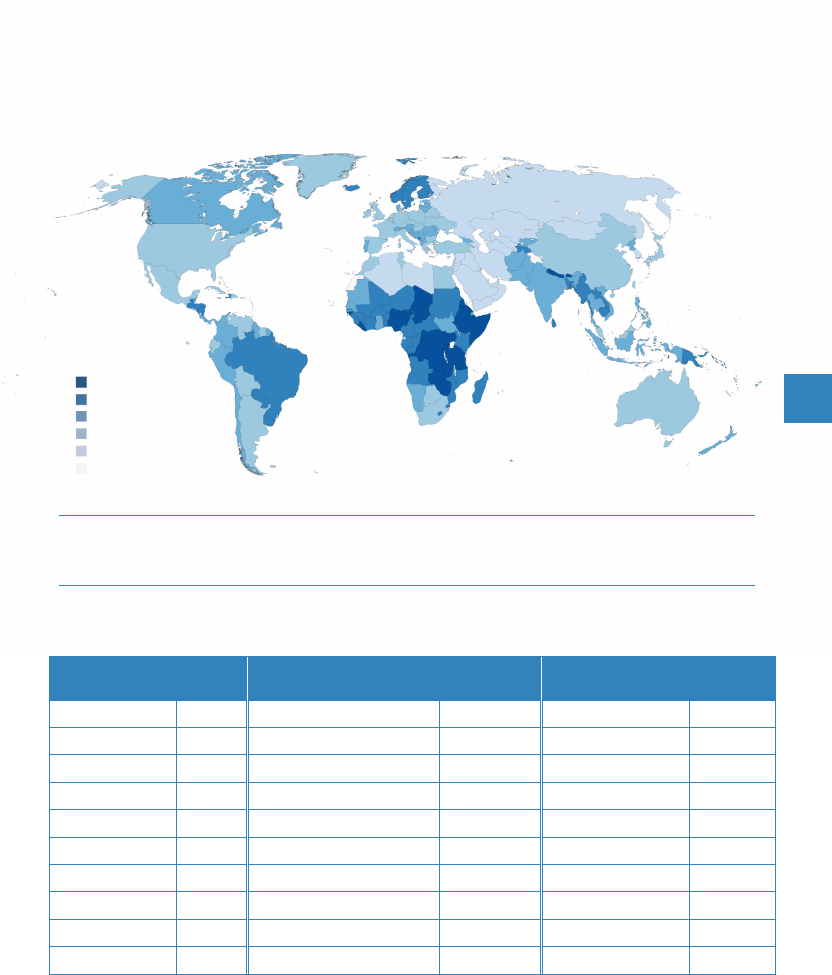
Total energy supply
FACTS AND FIGURES
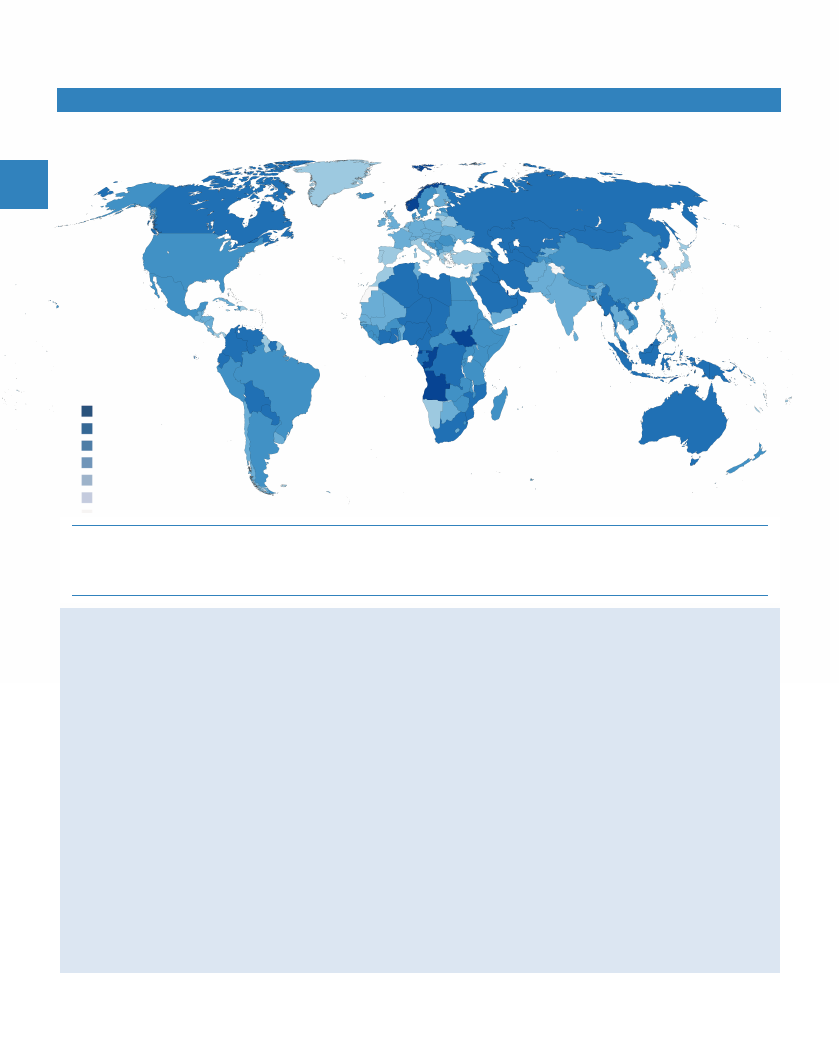
World total energy supply
1
(TES) increased by almost 60% from 1990 to 2016,
reaching 568 EJ. This growth was driven by Asia, where Chinese total energy
supply increased nearly fourfold during this period, accounting for 21% of world
TES in 2016.
The European share of world TES fell from 35% in 1990 to 19% in 2016, with an
absolute drop of 20.7 EJ. The United States, whose share of TES dropped by 6.5
percentage points since 1990 to reach 16% in 2016, showed an absolute
increase in TES of 10 EJ during this period.
International bunkers were equal to 16.3 EJ in 2016 (accounting for 3% of world
TES), almost doubling from 1990.
Source: United Nations Energy Database.
The designations employed and the presentation of material on this map do not imply the expression of any opinion whatsoever on the part of the Secretariat of the United Nations
concerning the legal status of any country, territory, city or area or of its authorities, or concerning the delimitation of its frontiers or boundaries. Dotted line represents approximately
the Line of Control in Jammu and Kashmir agreed upon by India and Pakistan. The final status of Jammu and Kashmir has not yet been agreed upon by the parties. Final boundary
between the Republic of Sudan and the Republic of South Sudan has not yet been determined. A dispute exists between the Governments of Argentina and the United Kingdom
of Great Britain and Northern Ireland concerning sovereignty over the Falkland Islands (Malvinas).
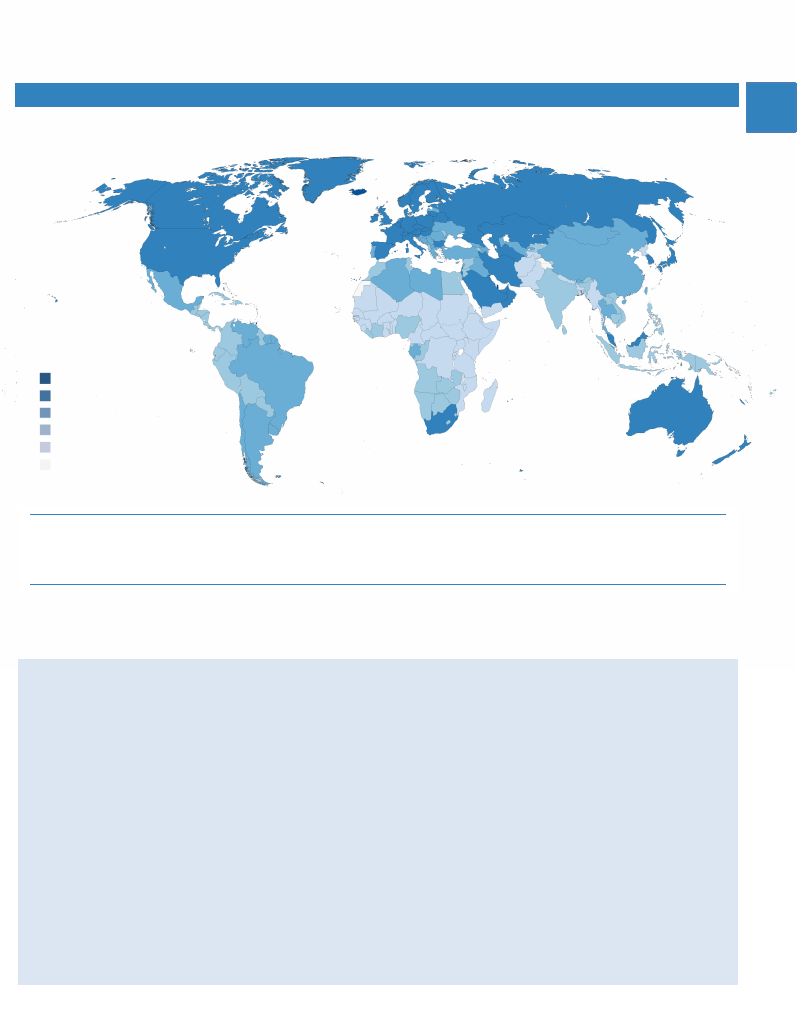
1. Total energy supply per capita, 2016
Gigajoules per capita
(1) World total energy supply includes international aviation and marine bunkers; conversely, bunkers are excluded from
total energy supply calculated for countries and regions. For further explanations, please refer to the General notes.
Gigajoules per capita
500
100-499.9
50-99.9
20-49.9
<20
No data
2019 Energy Statistics Pocketbook
United Nations Statistics Division
2
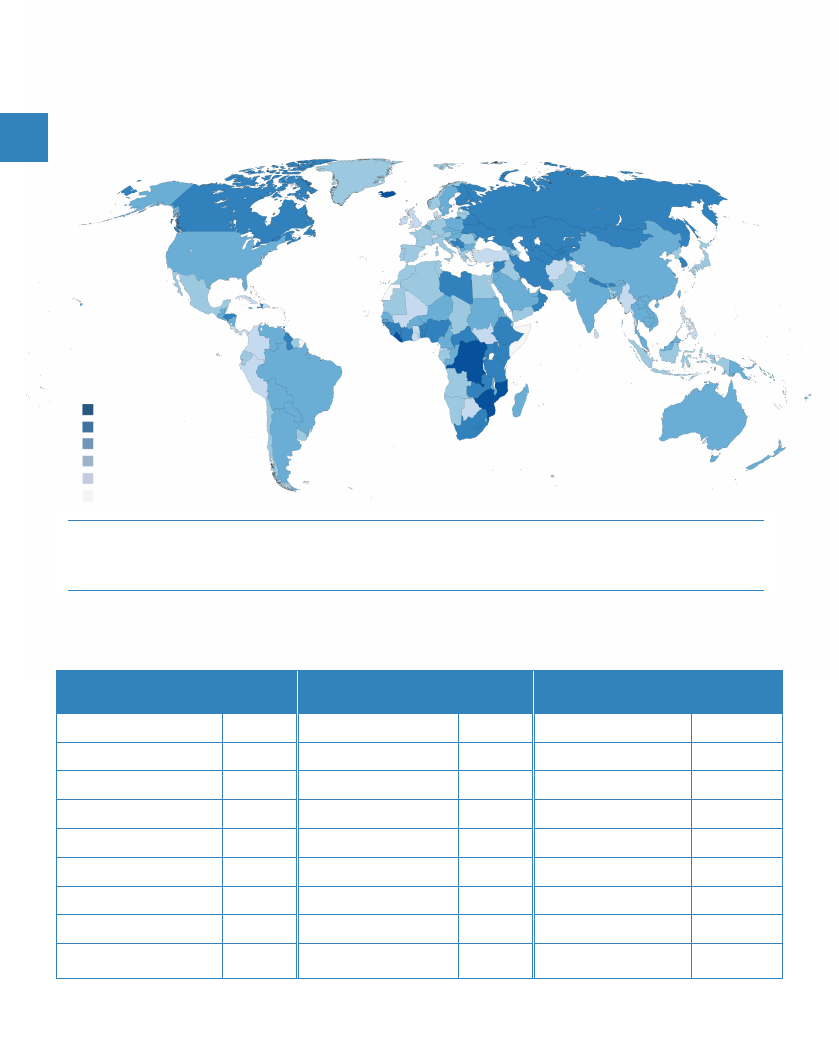
2. Energy intensity
2
, 2016
Gigajoules per thousand international $
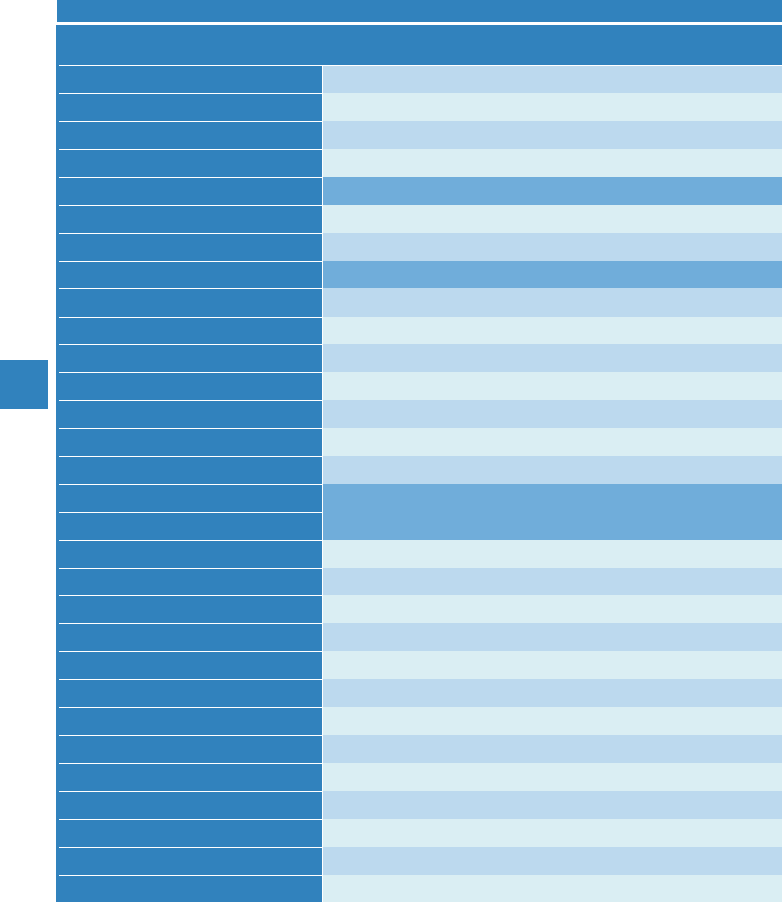
3. Energy supply (total, per capita and energy intensity
2
), major countries, 2016
Exajoules, gigajoules per capita and gigajoules per thousand international $
Country
TES
Country
TES per
capita
Country
Energy
intensity
2
China
118.5
Iceland
995.6
Liberia
27.9
United States
89.7
Qatar
686.0
Iceland
21.6
India
36.9
Trinidad and Tobago
562.4
Dem. Rep. Congo
19.6
Russian Federation
30.5
Curaçao
502.6
Trinidad and Tobago
19.0
Japan
17.8
Bahrain
391.0
Mozambique
17.1
Germany
12.9
Kuwait
372.5
Zimbabwe
15.4
Brazil
12.2
United Arab Emirates
369.8
Togo
14.2
Republic of Korea
11.8
Canada
317.6
Turkmenistan
13.1
World
567.9
World
76.1
World
5.1
(2) Energy intensity is calculated by dividing the total energy supply by GDP, PPP (constant 2011 international $).
Gigajoules per
thousand international $
15
6-14.99
4-5.99
3-3.99
<3
No data
Source: United Nations Energy Database.
The designations employed and the presentation of material on this map do not imply the expression of any opinion whatsoever on the part of the Secretariat of the United Nations
concerning the legal status of any country, territory, city or area or of its authorities, or concerning the delimitation of its frontiers or boundaries. Dotted line represents approximately
the Line of Control in Jammu and Kashmir agreed upon by India and Pakistan. The final status of Jammu and Kashmir has not yet been agreed upon by the parties. Final boundary
between the Republic of Sudan and the Republic of South Sudan has not yet been determined. A dispute exists between the Governments of Argentina and the United Kingdom
of Great Britain and Northern Ireland concerning sovereignty over the Falkland Islands (Malvinas).
2019 Energy Statistics Pocketbook
United Nations Statistics Division
3
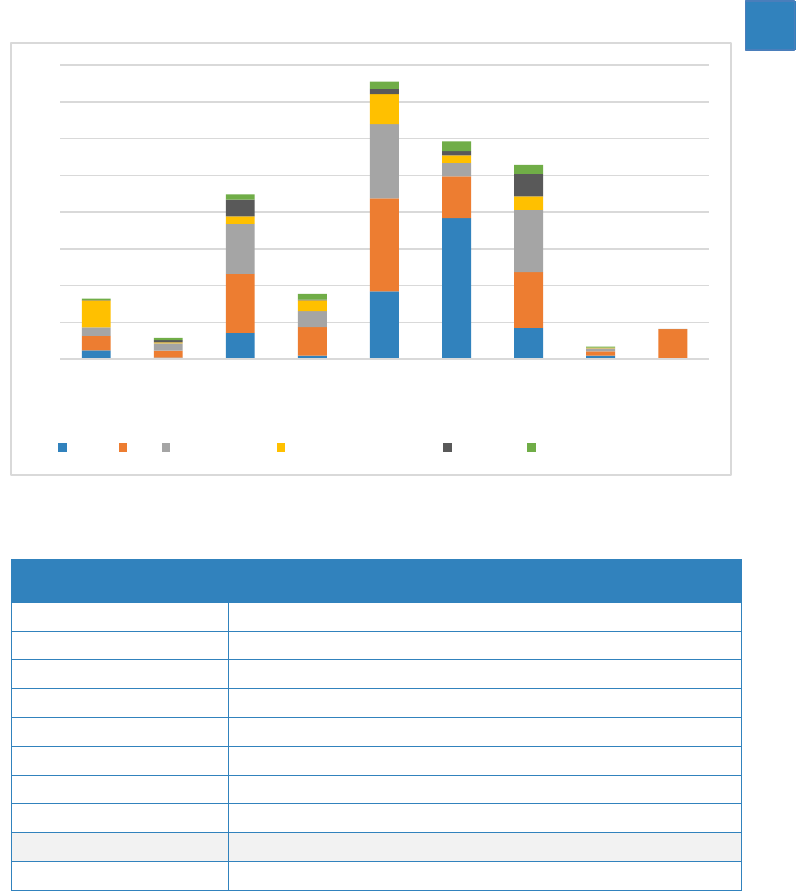
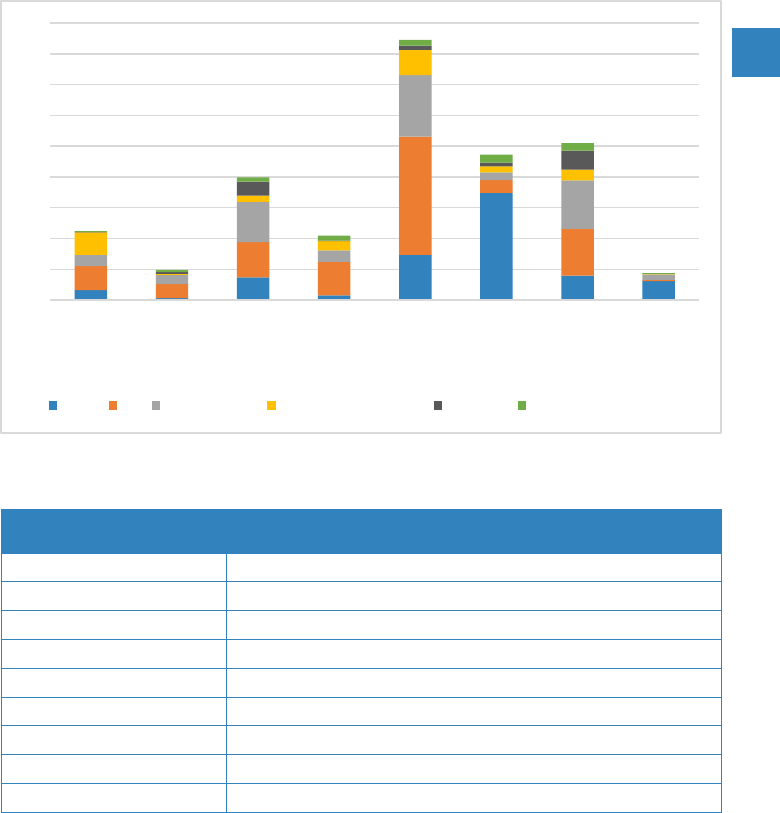
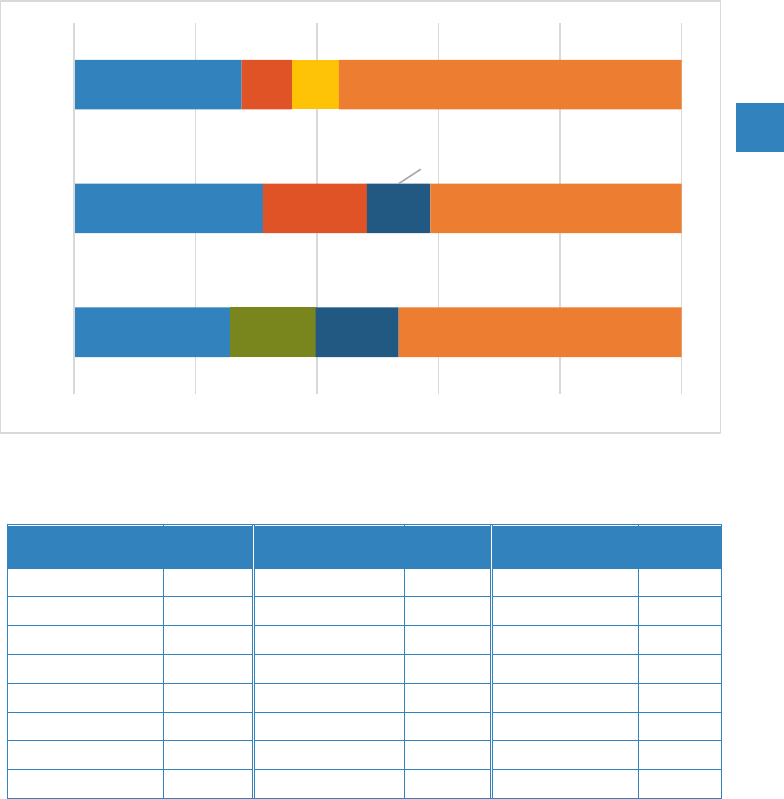
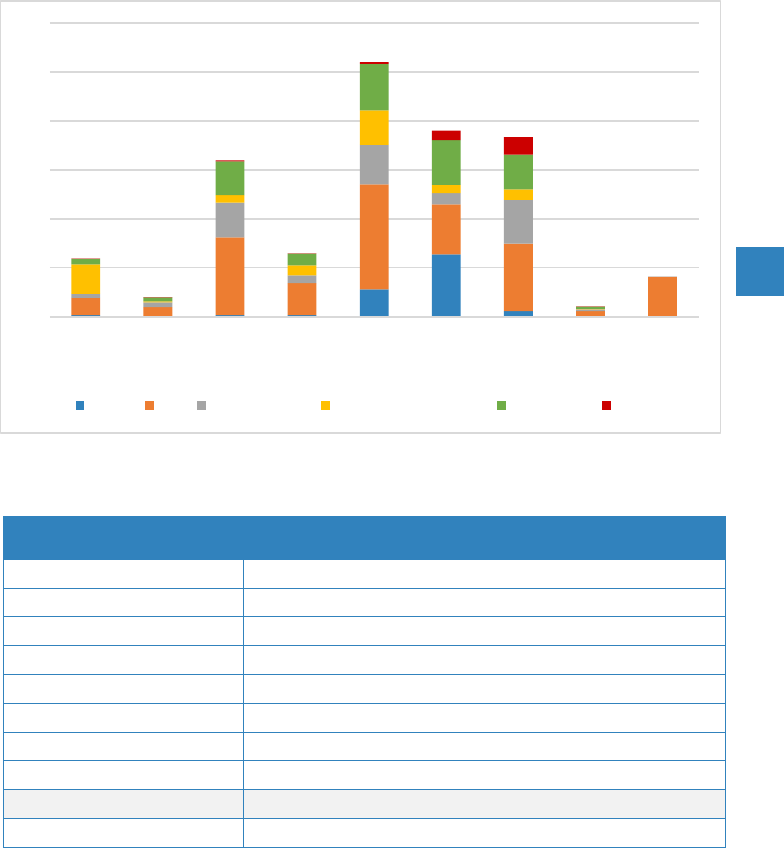
4. Total energy supply by region and source, 2016
Exajoules
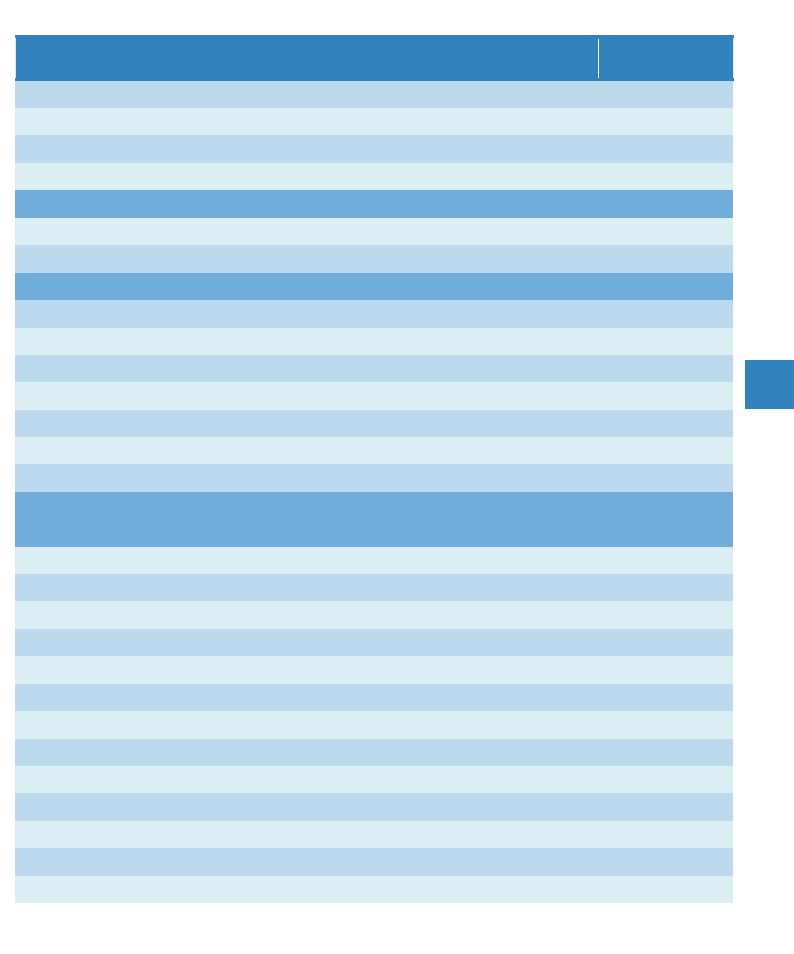
5. Total energy supply by region and source, 2016
Exajoules
Region
Coal
Oil
Natural gas
Biofuels
& waste
Nuclear
Electricity
and heat
TES
Africa
4.9
7.8
4.7
14.6
0.2
0.7
32.8
Northern America (excl. US)
0.7
4.0
4.0
0.5
1.1
1.3
11.5
United States
14.3
32.0
27.3
4.0
9.1
3.0
89.7
Latin America and the Caribbean
1.9
15.5
8.7
5.8
0.4
3.2
35.5
Asia (exc. China)
36.8
50.6
40.3
16.4
2.9
3.9
151.0
China
76.7
22.8
7.4
4.0
2.3
5.3
118.5
Europe
16.9
30.5
33.8
7.3
12.3
5.0
105.8
Oceania
1.9
2.3
1.7
0.3
-
0.5
6.7
International bunkers
-
16.3
0
+
-
-
-
16.3
World
154.3
181.7
127.8
53.0
28.2
22.9
567.9
0
20
40
60
80
100
120
140
160
Africa Northern
America
(excl. US)
United
States
Latin
America
& Carib.
Asia
(excl.
China)
China Europe Oceania Intl.
bunkers
Coal Oil Natural Gas Biofuels and waste Nuclear Electricity and heat
2019 Energy Statistics Pocketbook
United Nations Statistics Division
4
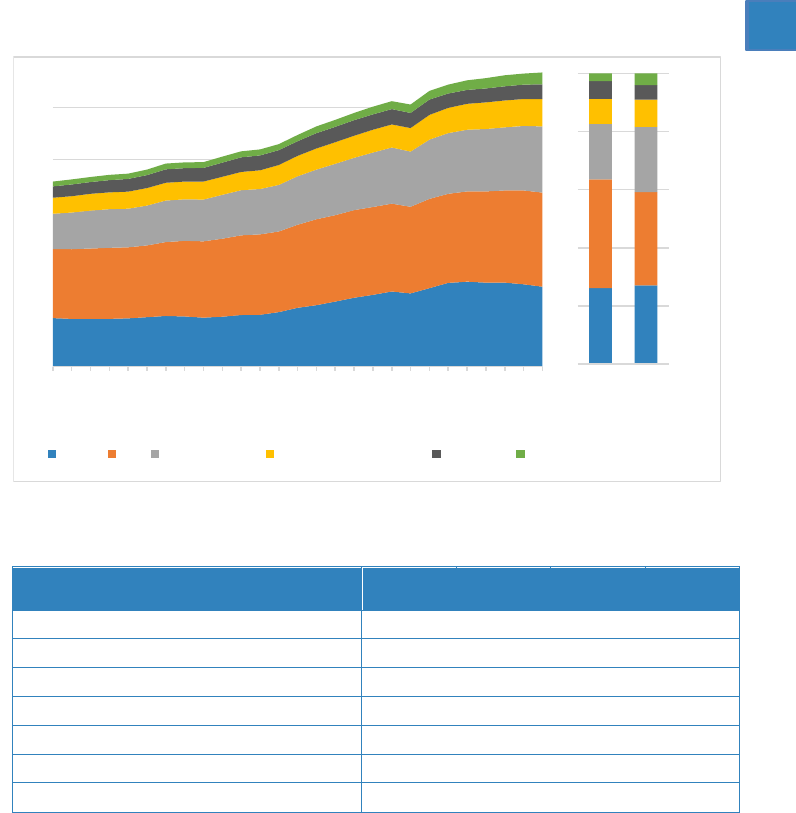
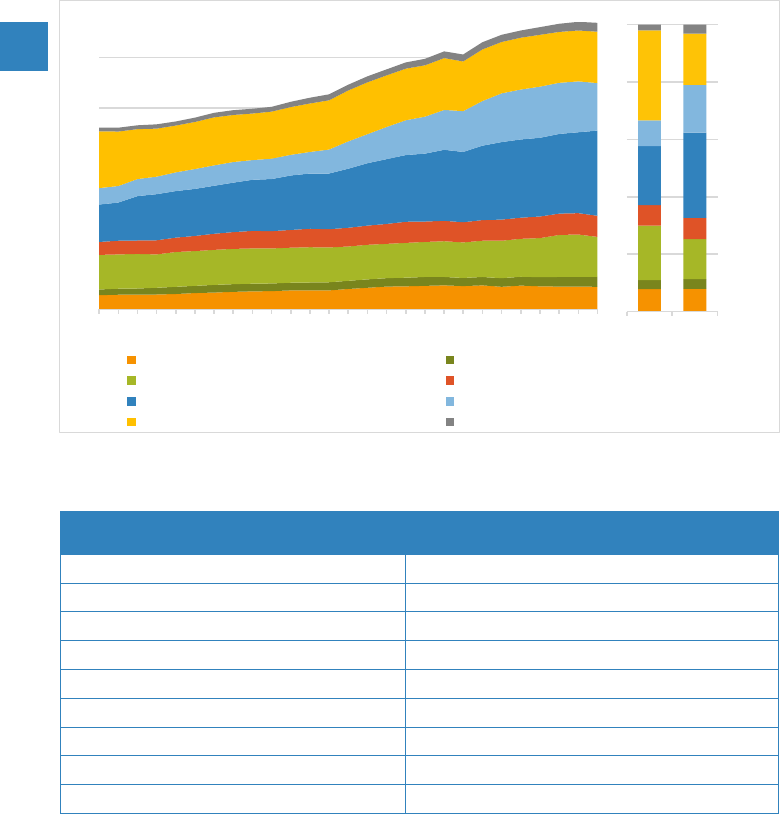
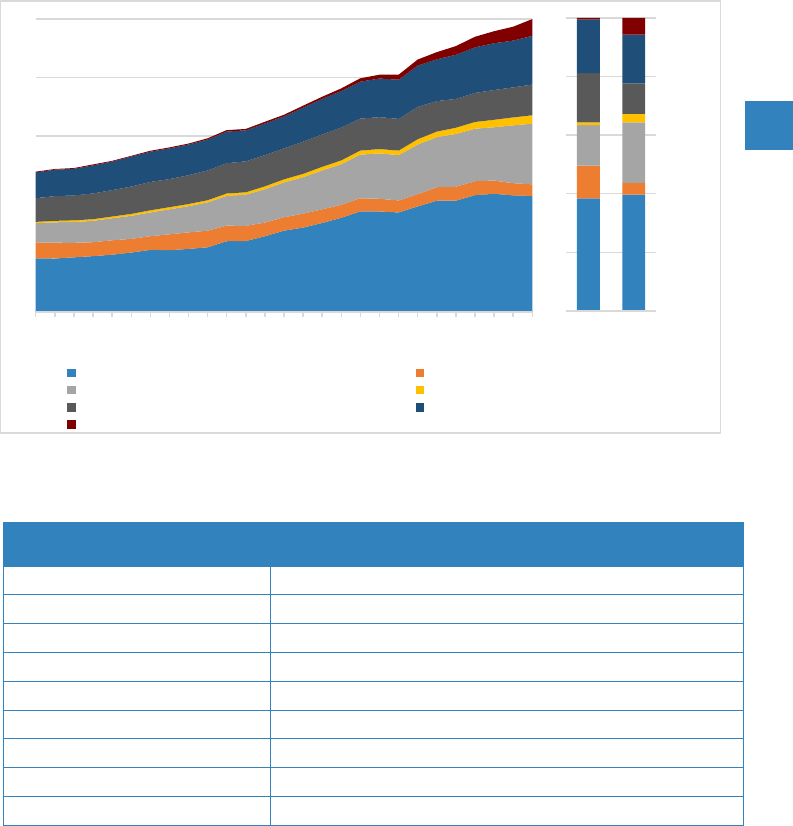
6. Total energy supply by region, 1990 – 2016
Exajoules
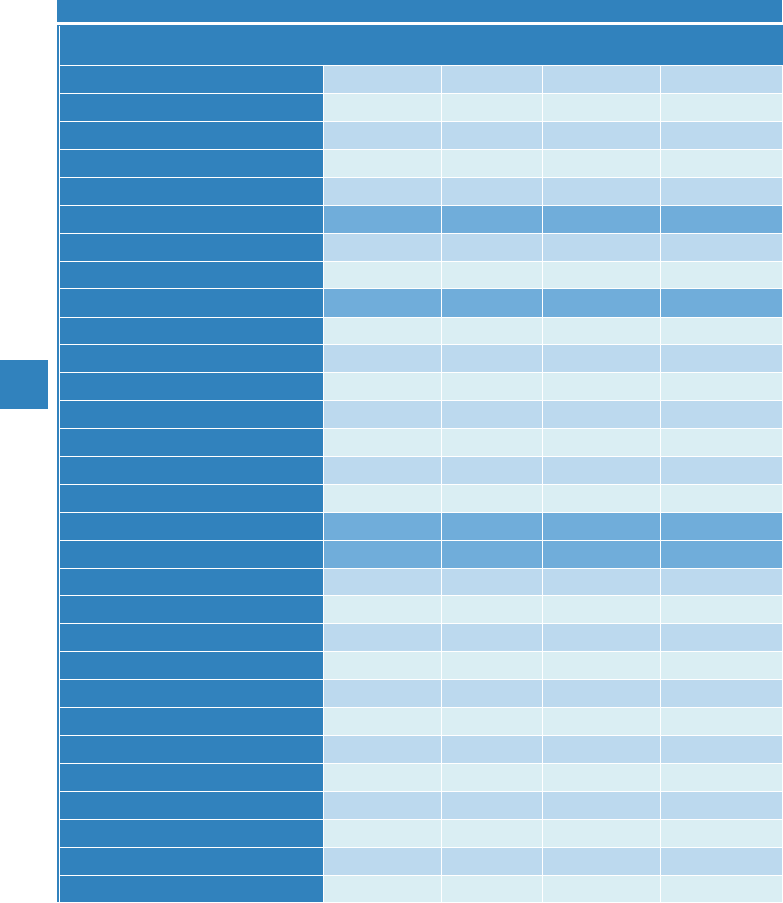
7. Total energy supply by region, 1990, 2000, 2010 and 2016
Exajoules
Region
1990
2000
2010
2016
Africa
15.8
21.1
28.5
32.8
Northern America (excl. US)
8.8
10.5
10.8
11.5
United States
79.5
94.5
92.1
89.7
Latin America and the Caribbean
19.6
25.7
33.1
35.5
Asia (excl. China)
63.3
97.8
133.2
151.0
China
30.4
42.5
101.6
118.5
Europe
126.5
106.7
111.7
105.8
Oceania
4.4
5.5
6.5
6.7
International bunkers
8.8
11.1
14.9
16.3
World
357.1
415.5
532.4
567.9
0
100
200
300
400
500
1990
1991
1992
1993
1994
1995
1996
1997
1998
1999
2000
2001
2002
2003
2004
2005
2006
2007
2008
2009
2010
2011
2012
2013
2014
2015
2016
Africa Northern America (excl. US)
United States Latin America and the Caribbean
Asia (excl. China) China
Europe Oceania
International bunkers
0%
20%
40%
60%
80%
100%
1990 2016
2019 Energy Statistics Pocketbook
United Nations Statistics Division
5
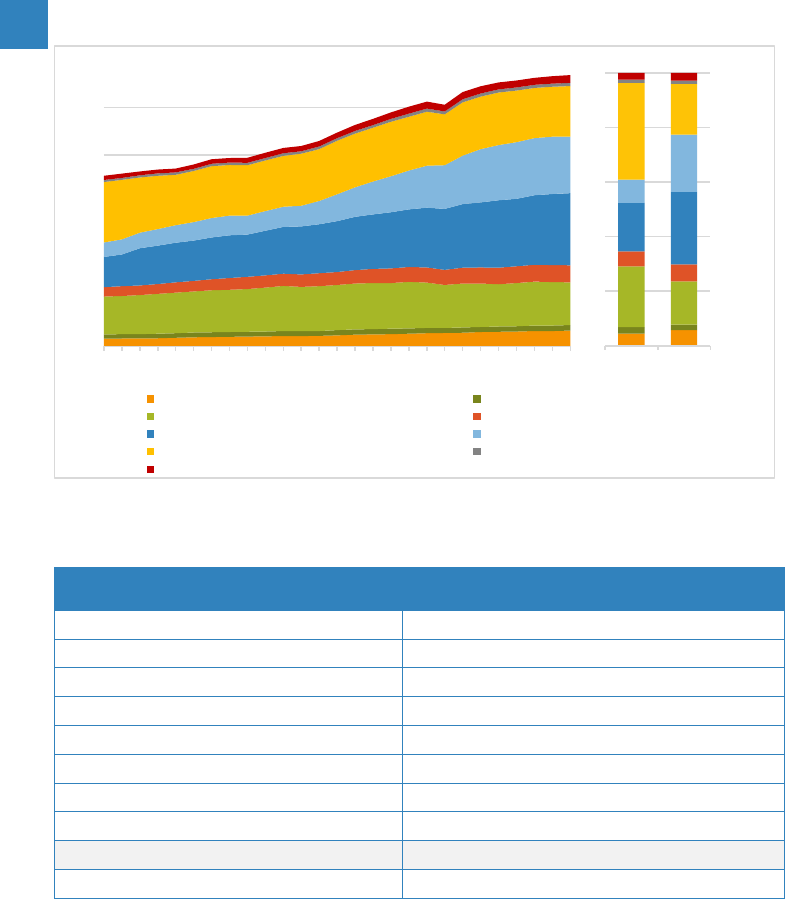
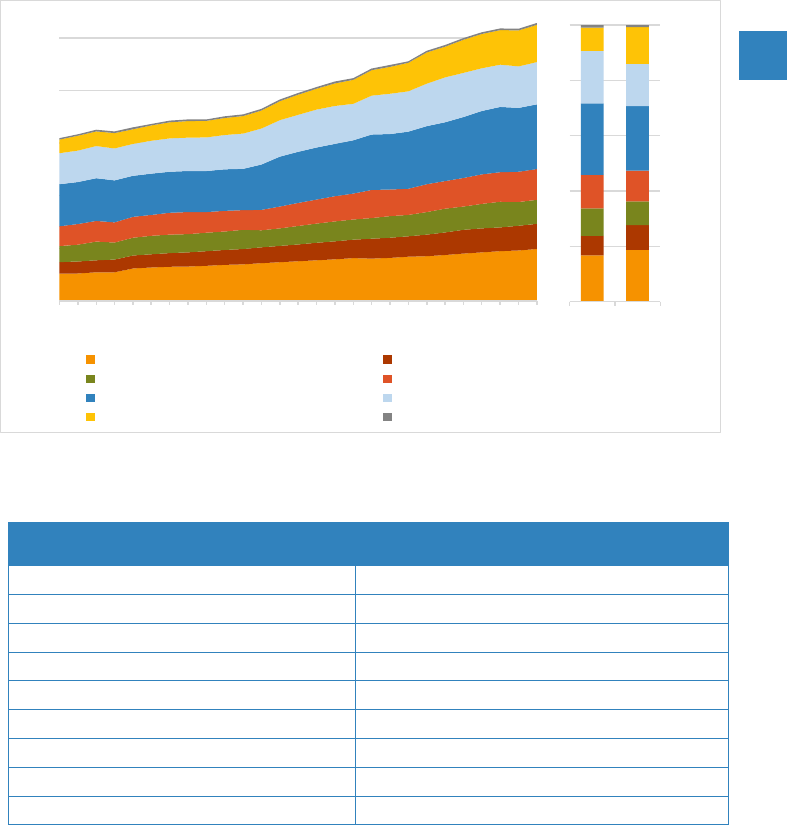
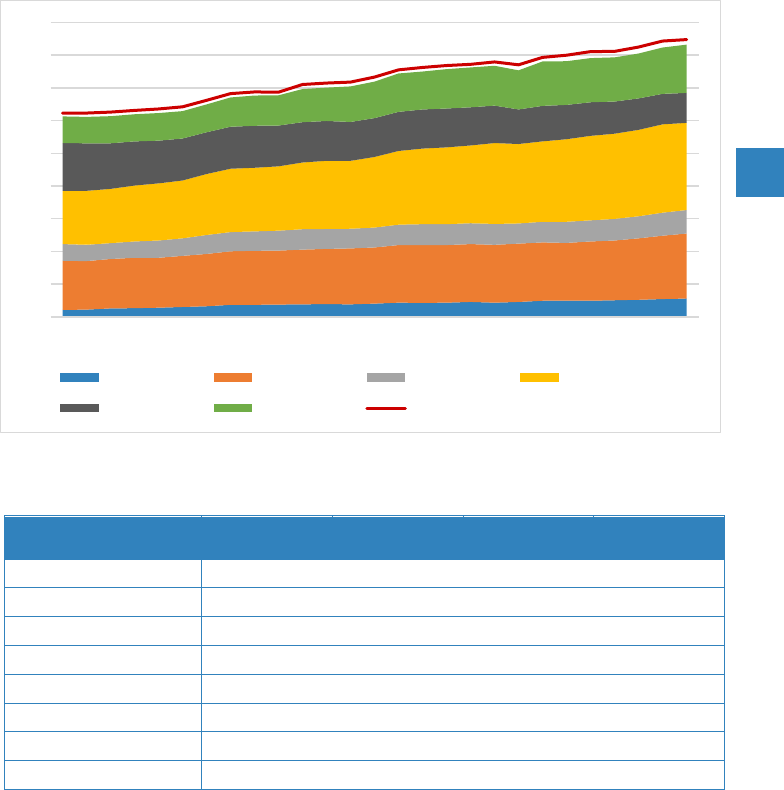
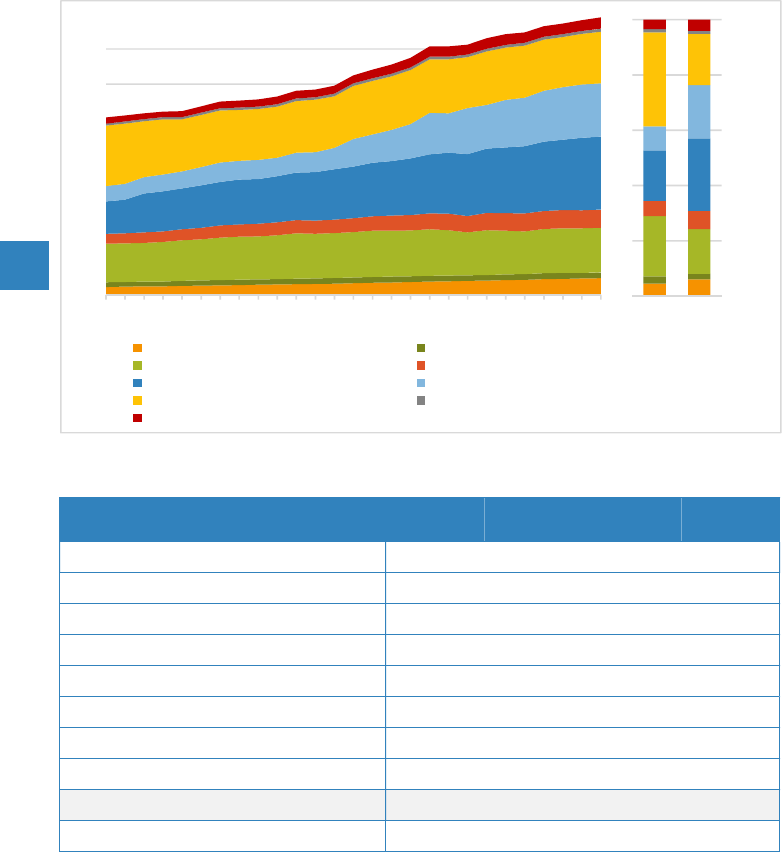
8. World total energy supply by source, 1990 – 2016
Exajoules
9. World total energy supply by source, 1990, 2000, 2010 and 2016
Exajoules
Source
1990
2000
2010
2016
Coal
93.5
99.4
151.5
154.3
Oil
133.3
153.9
172.1
181.7
Natural gas
68.2
87.1
114.6
127.8
Biofuels and waste
31.0
35.5
47.6
53.0
Nuclear
21.8
28.0
29.8
28.2
Electricity and heat
9.3
11.7
16.7
22.9
Total
357.1
415.5
532.4
567.9
0
100
200
300
400
500
1990
1991
1992
1993
1994
1995
1996
1997
1998
1999
2000
2001
2002
2003
2004
2005
2006
2007
2008
2009
2010
2011
2012
2013
Coal Oil Natural Gas Biofuels and waste Nuclear Electricity and Heat
0%
20%
40%
60%
80%
100%
1990 2016
2014
2015
2016
2019 Energy Statistics Pocketbook
United Nations Statistics Division
6
Primary energy production
(3) Energy self-sufficiency is calculated as the ratio between primary energy production and total energy supply expressed
in percentage.
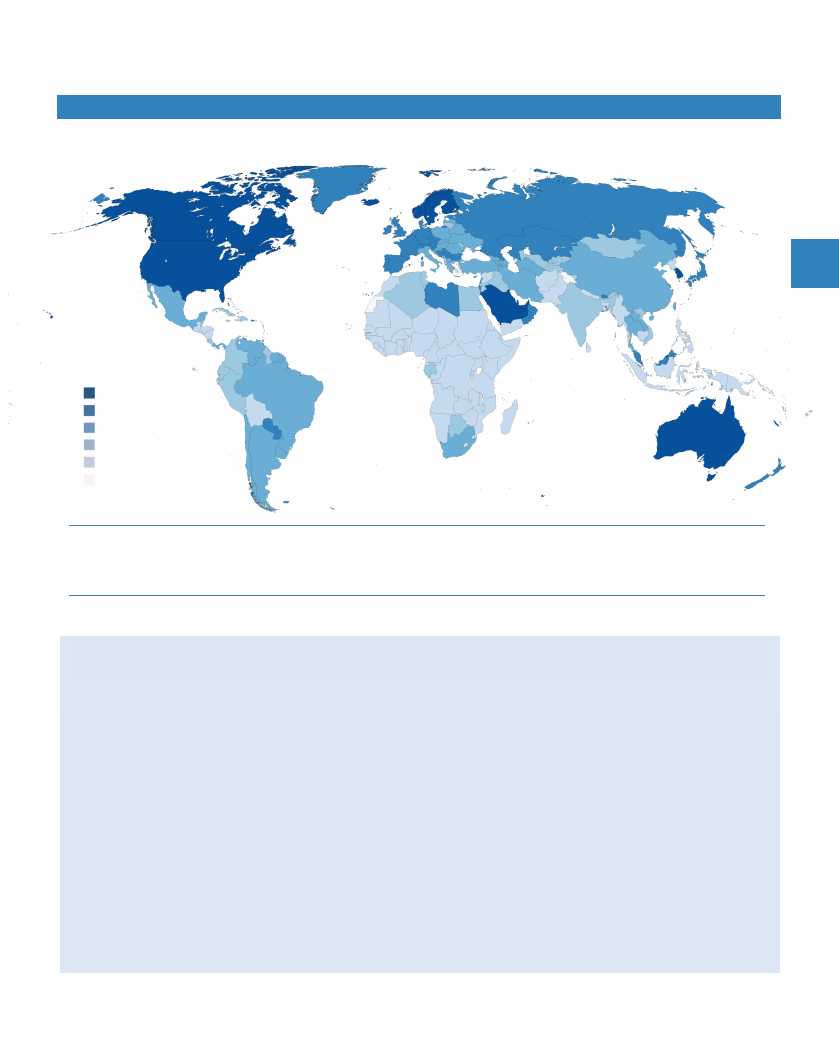
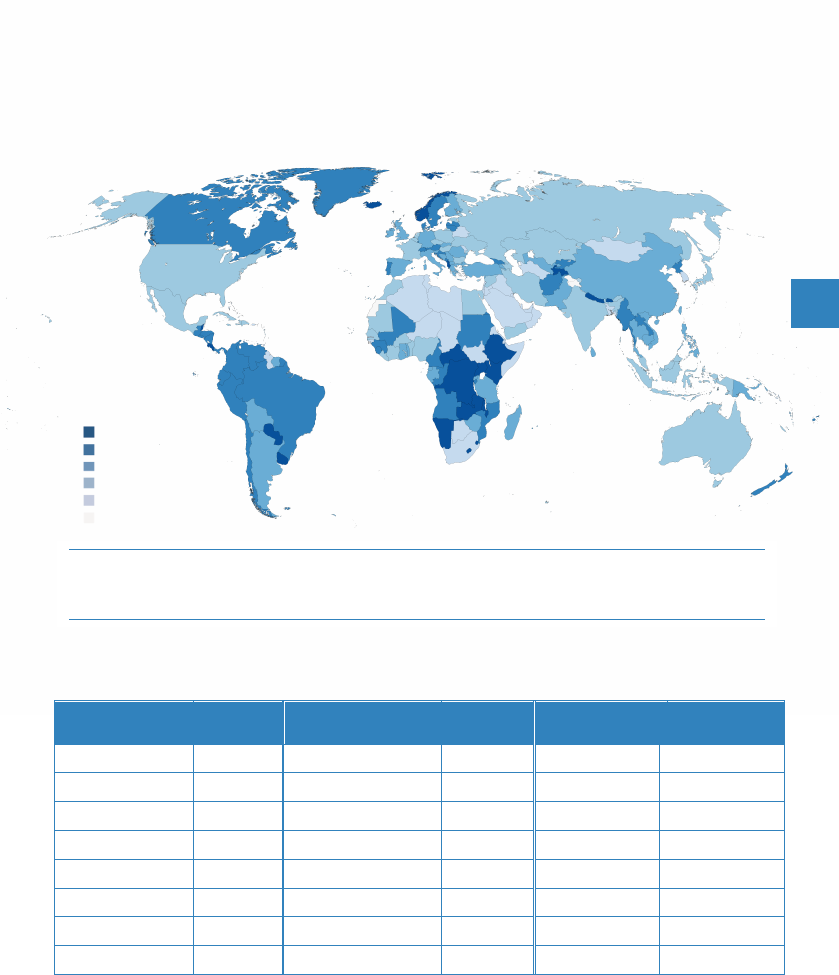
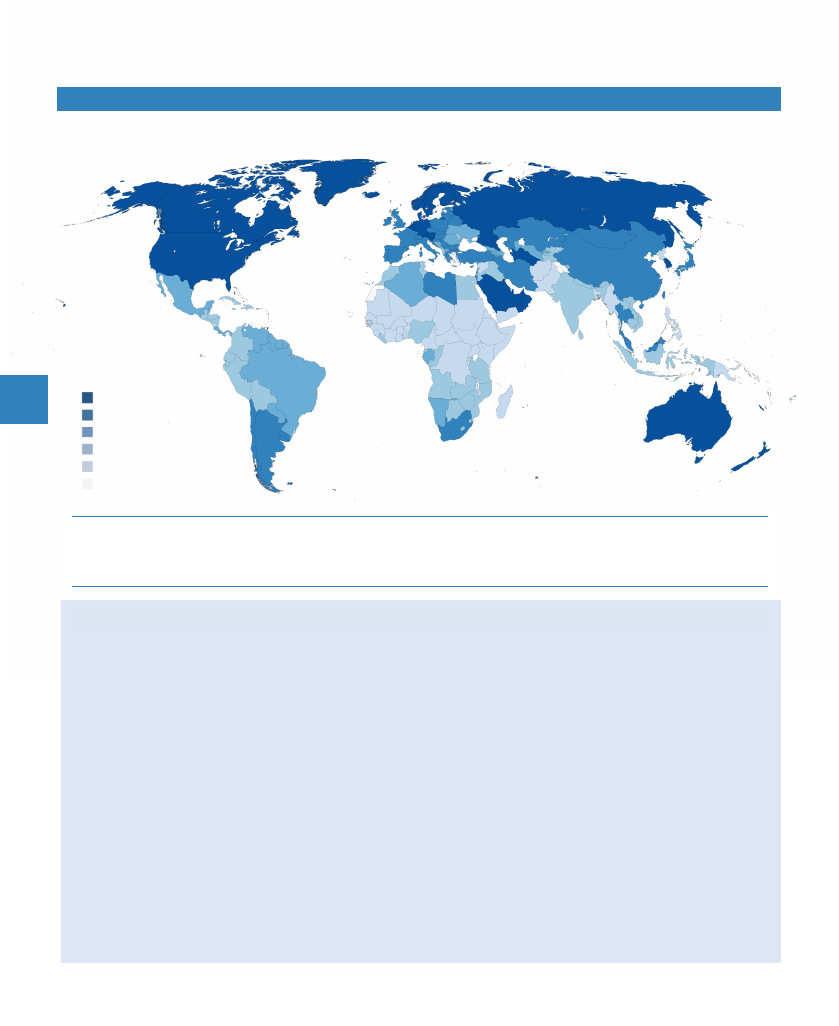
10. Energy self-sufficiency
3
, 2016
Source: United Nations Energy Database.
The designations employed and the presentation of material on this map do not imply the expression of any opinion whatsoever on the part of the Secretariat of the United Nations
concerning the legal status of any country, territory, city or area or of its authorities, or concerning the delimitation of its frontiers or boundaries. Dotted line represents approximately
the Line of Control in Jammu and Kashmir agreed upon by India and Pakistan. The final status of Jammu and Kashmir has not yet been agreed upon by the parties. Final boundary
between the Republic of Sudan and the Republic of South Sudan has not yet been determined. A dispute exists between the Governments of Argentina and the United Kingdom
of Great Britain and Northern Ireland concerning sovereignty over the Falkland Islands (Malvinas).
FACTS AND FIGURES
World primary energy production reached 569 EJ in 2016, showing a 58%
increase compared to 1990. Unlike TES, primary energy production decreased
(by 0.35%) from 2015 to 2016, mainly due to a 5.6% drop in coal production. Oil,
coal and natural gas, in this order, are the largest energy sources, together
representing 82% of total primary energy production.
A significant share of 2016 primary energy production occurred in a handful of
countries:
- China and the United States produced more than half of all primary coal (55%),
with China alone producing 46% of the world coal;
- The six biggest producers of oil (Saudi Arabia, Russian Federation, United
States, Iraq, Iran and Canada) produced more than half of all primary oil (53%);
- Five natural gas producers (United States, Russian Federation, Iran, Qatar and
Canada) produced more than half of all natural gas (53%).
Percentage
500
100-499.9
70-99.9
30-69.9
0-29.9
0
No data
Percentage
2019 Energy Statistics Pocketbook
United Nations Statistics Division
7
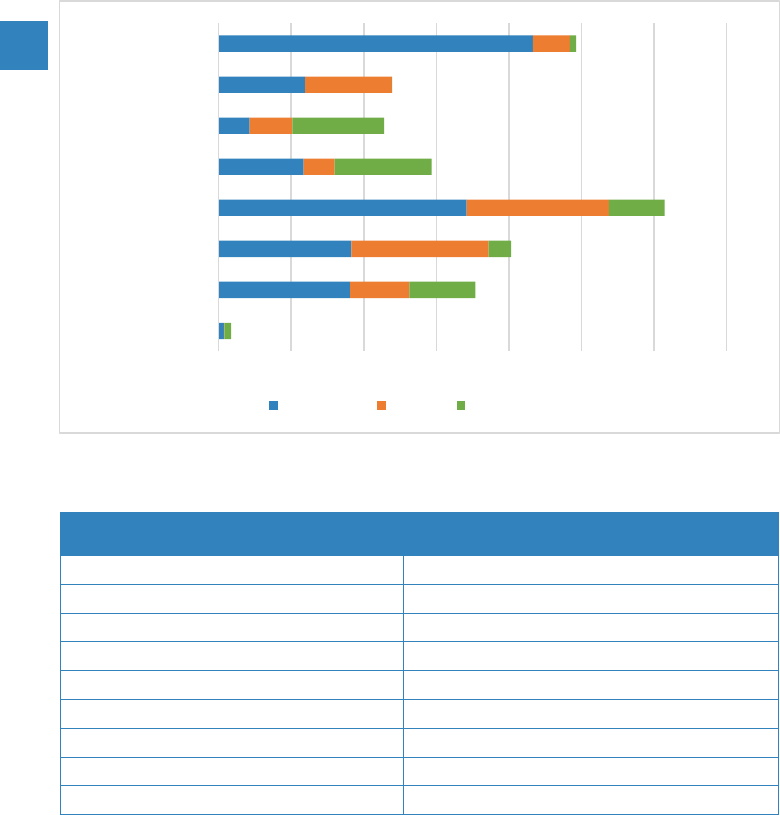
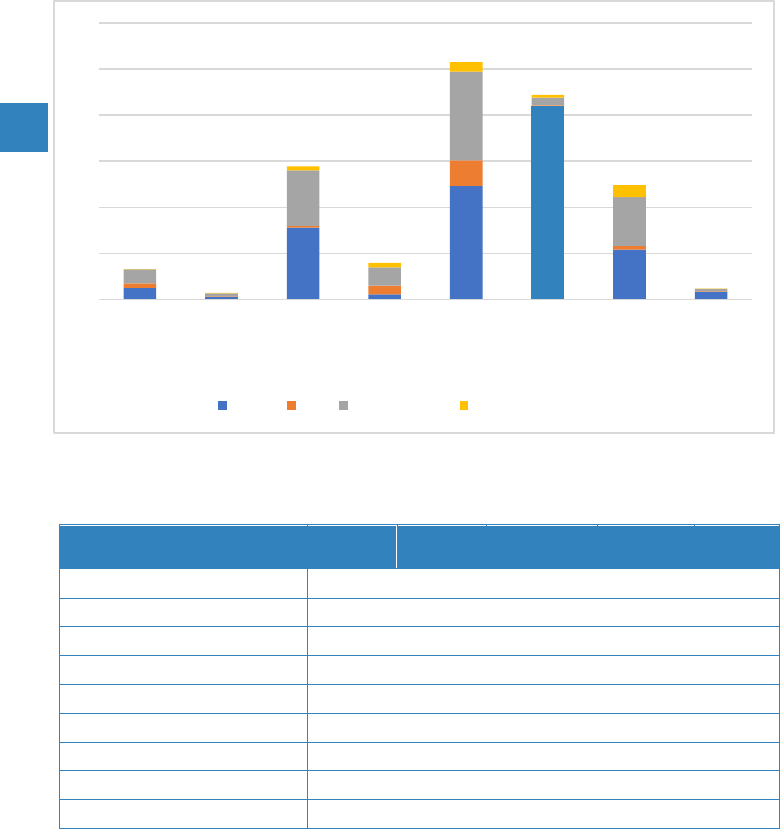
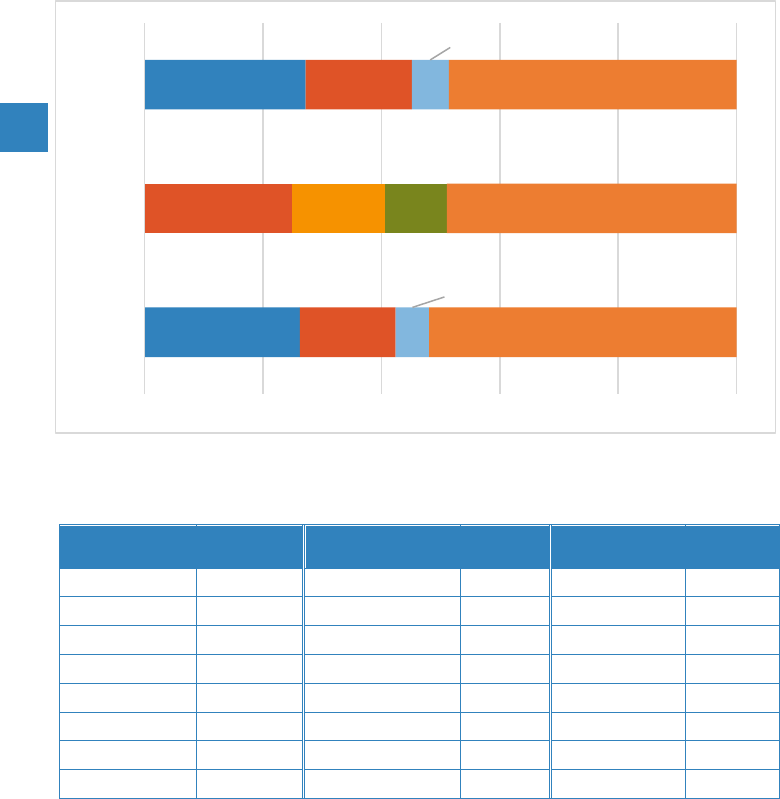
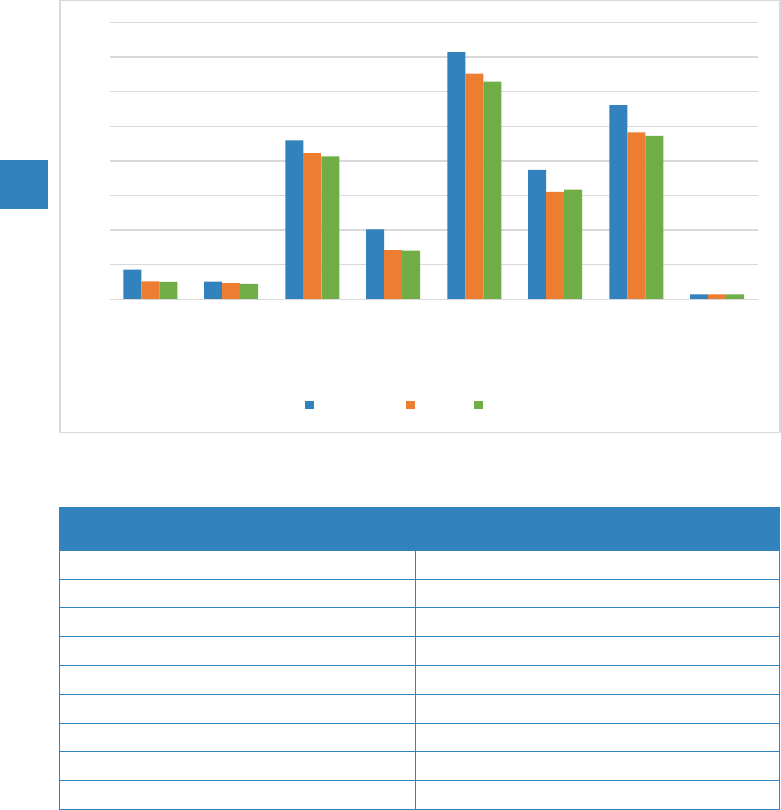
11. Primary energy production by region and source, 2016
Exajoules
12. Primary energy production by region and source, 2016
Exajoules
0
20
40
60
80
100
120
140
160
180
Africa Northern
America
(excl. US)
United
States
Latin
America
and the
Caribbean
Asia (excl.
China)
China Europe Oceania
Coal Oil Natural Gas Biofuels and waste Nuclear Electricity and heat
Source
Coal
Oil
Natural
gas
Biofuels
and waste
Nuclear
Electricity
& heat
Total
Africa
6.3
15.6
7.4
14.6
0.2
0.7
44.7
Northern America (excl. US)
1.3
9.0
6.1
0.5
1.1
1.5
19.5
United States
14.6
23.0
26.3
4.0
9.1
2.8
79.7
Latin America and the Caribbean
3.0
21.8
7.5
5.9
0.4
3.2
41.7
Asia (excl. China)
29.3
76.9
39.9
16.4
2.9
3.8
169.2
China
69.6
8.4
5.0
4.0
2.3
5.4
94.6
Europe
15.8
30.4
31.5
7.1
12.3
5.0
102.1
Oceania
12.3
0.8
3.5
0.3
-
0.5
17.5
World
152.1
185.9
127.1
52.8
28.2
22.9
569.0
2019 Energy Statistics Pocketbook
United Nations Statistics Division
8
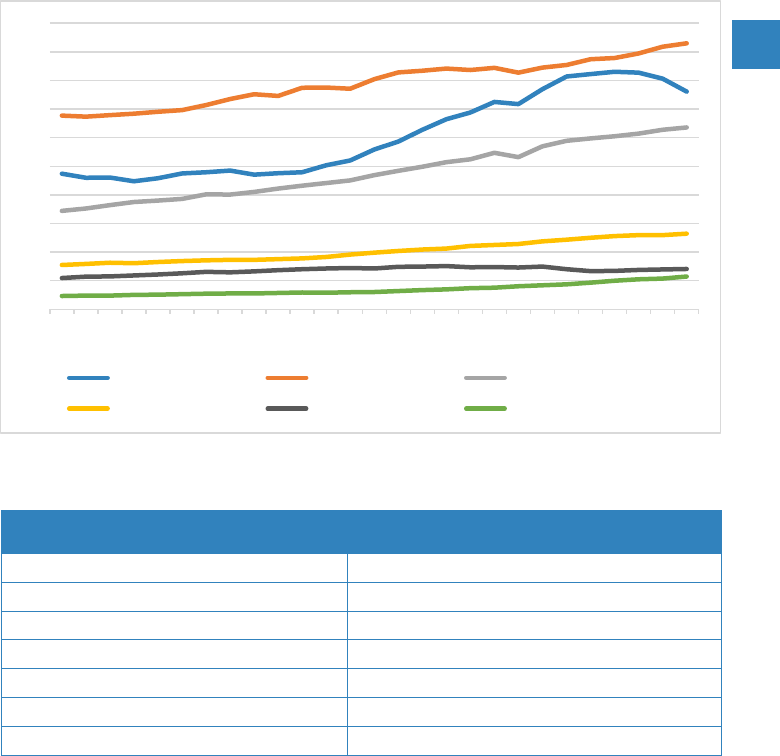
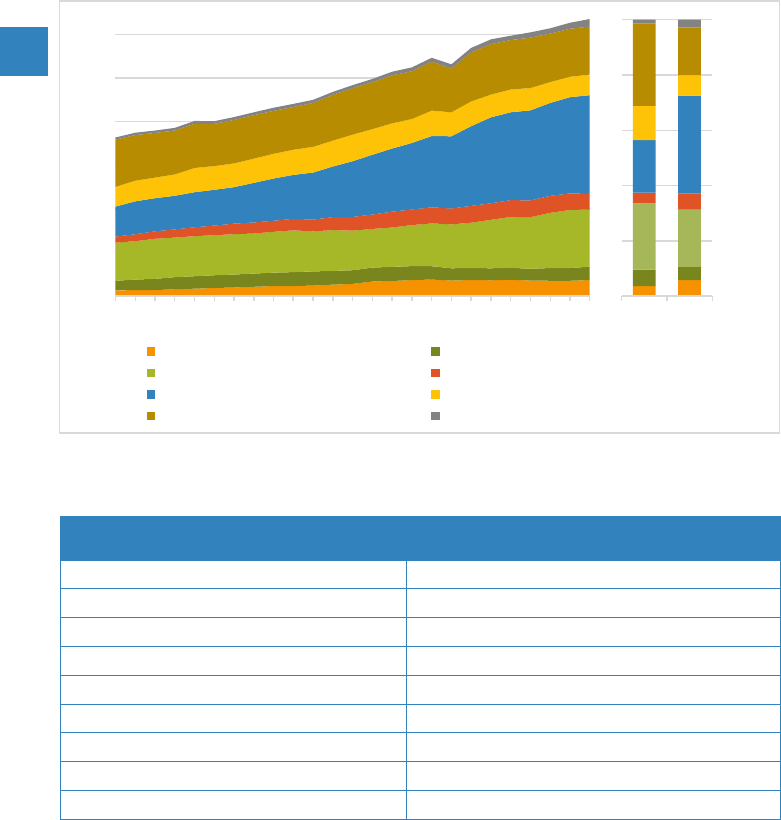
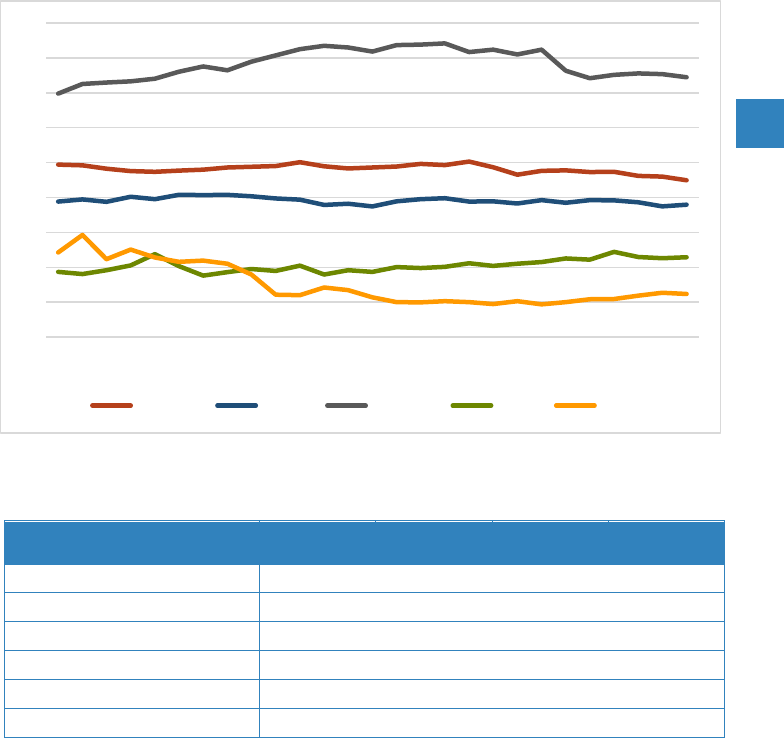
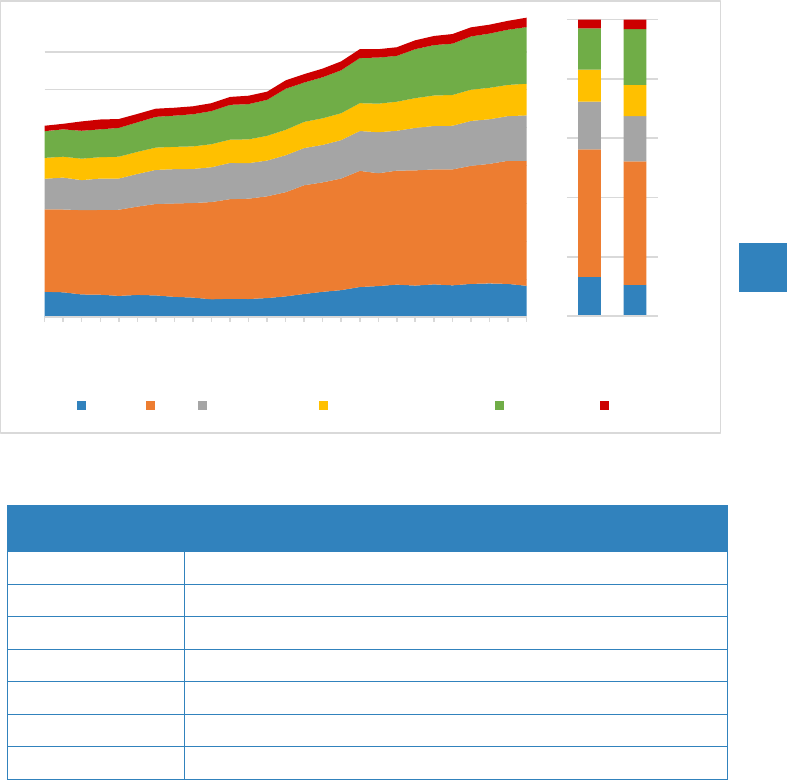
13. Total primary energy production by region, 1990 – 2016
Exajoules
14. Total primary energy production by region, 1990, 2000, 2010 and 2016
Exajoules
Region
1990
2000
2010
2016
Africa
28.0
37.3
47.7
44.7
Northern America (excl. US)
11.5
15.5
16.5
19.5
United States
68.6
69.3
71.9
79.7
Latin America and the Caribbean
25.7
35.4
41.3
41.7
Asia (excl. China)
74.2
108.5
147.6
169.2
China
32.7
40.8
88.6
94.6
Europe
112.8
94.7
102.5
102.1
Oceania
7.3
10.6
14.5
17.5
World
360.9
412.2
530.6
569.0
0
100
200
300
400
500
1990
1991
1992
1993
1994
1995
1996
1997
1998
1999
2000
2001
2002
2003
2004
2005
2006
2007
2008
2009
2010
2011
2012
2013
2014
2015
2016
Africa Northern America (excl. US)
United States Latin America and the Caribbean
Asia (excl. China) China
Europe Oceania
0%
20%
40%
60%
80%
100%
1990 2016
2019 Energy Statistics Pocketbook
United Nations Statistics Division
9
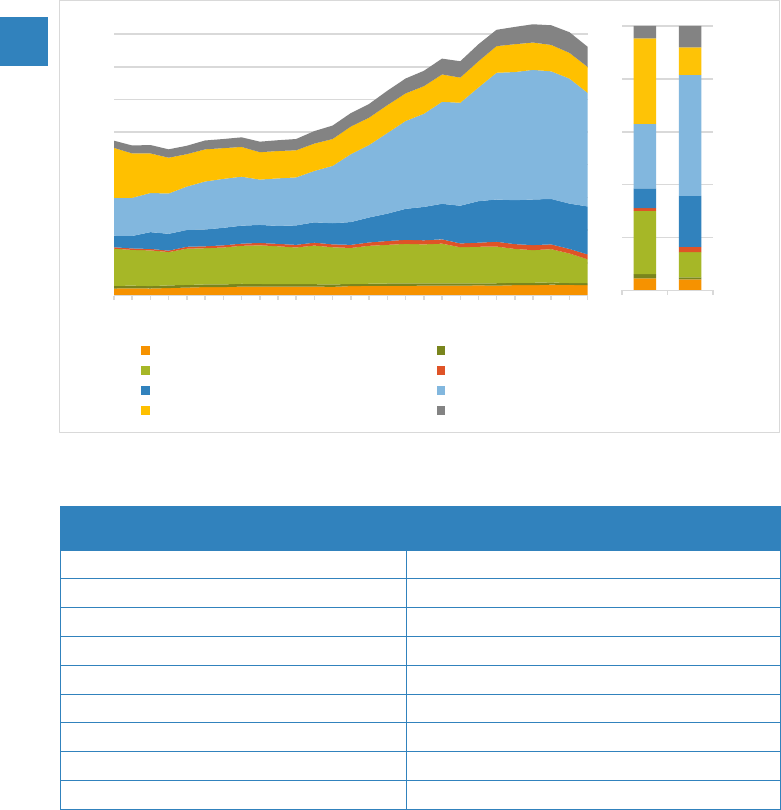
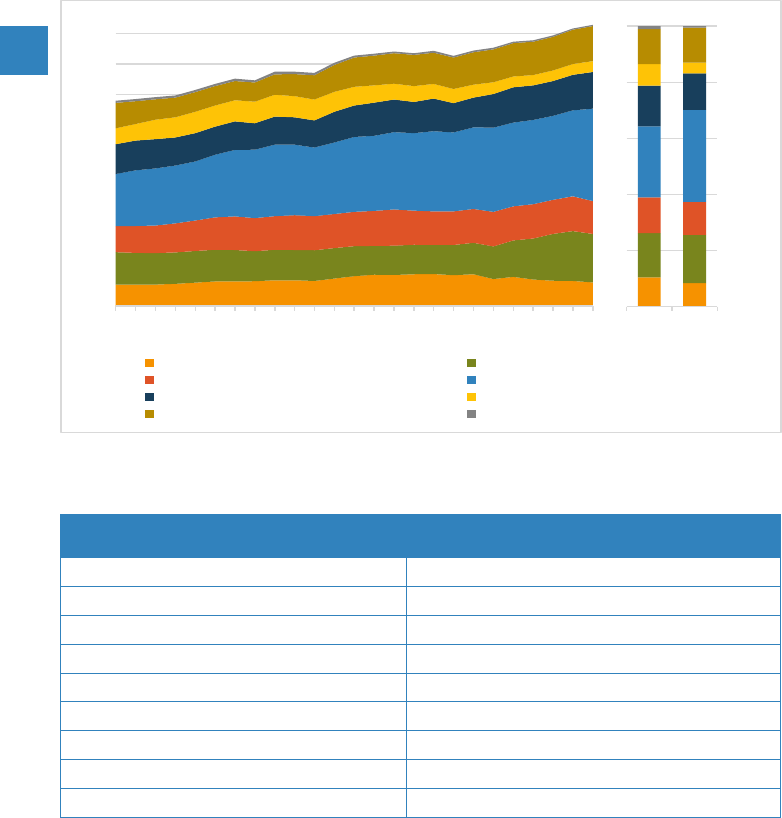
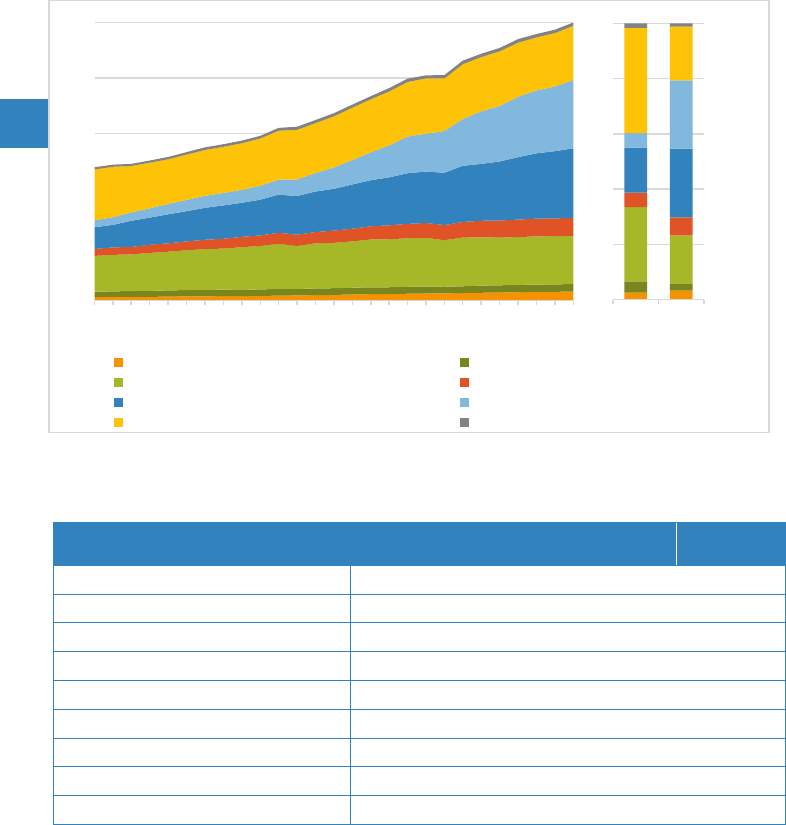
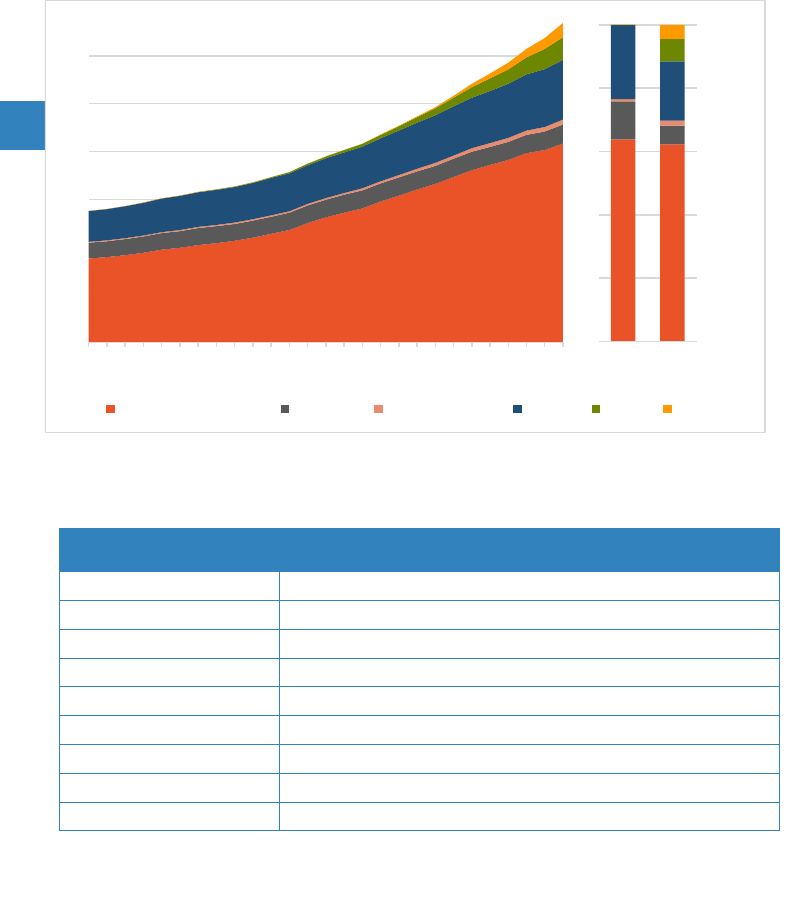
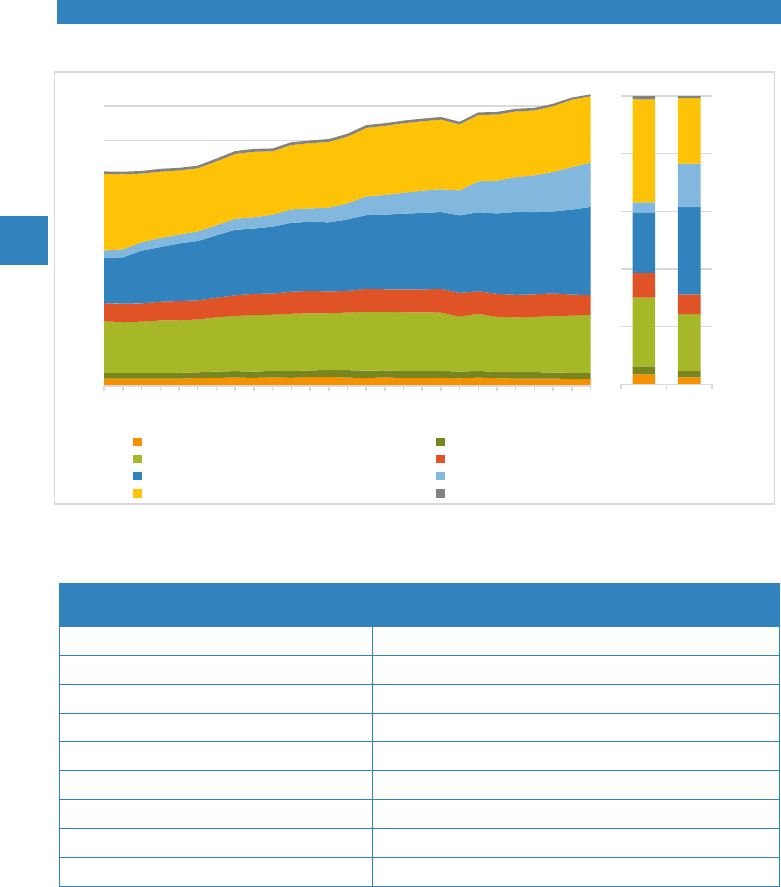
15. World primary energy production by source, 1990 – 2016
Exajoules
16. World primary energy production by source, 1990, 2000, 2010 and 2016
Percentage
Source
1990
2000
2010
2016
Coal
26.3%
23.2%
29.0%
26.7%
Oil
37.5%
37.6%
31.8%
32.7%
Natural gas
19.1%
21.0%
21.5%
22.3%
Biofuels and waste
8.6%
8.6%
9.0%
9.3%
Nuclear
6.0%
6.8%
5.6%
5.0%
Electricity and heat
2.6%
2.8%
3.2%
4.0%
Total
100.0%
100.0%
100.0%
100.0%
0
20
40
60
80
100
120
140
160
180
200
1990
1991
1992
1993
1994
1995
1996
1997
1998
1999
2000
2001
2002
2003
2004
2005
2006
2007
2008
2009
2010
2011
2012
2013
2014
2015
2016
Coal Oil Natural gas
Biofuels and waste Nuclear Electricity and heat
2019 Energy Statistics Pocketbook
United Nations Statistics Division
10
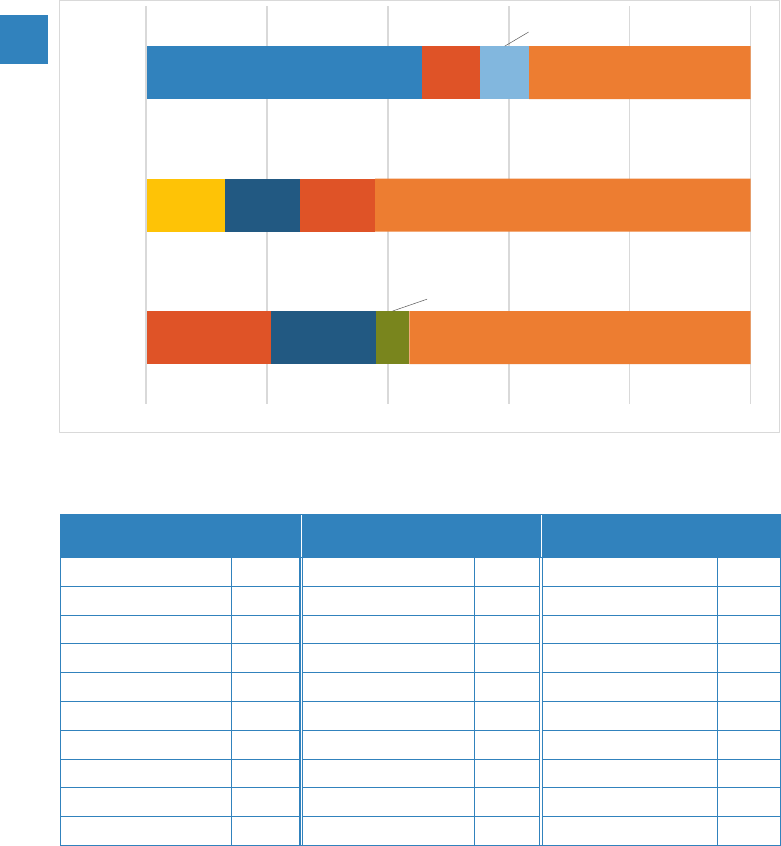
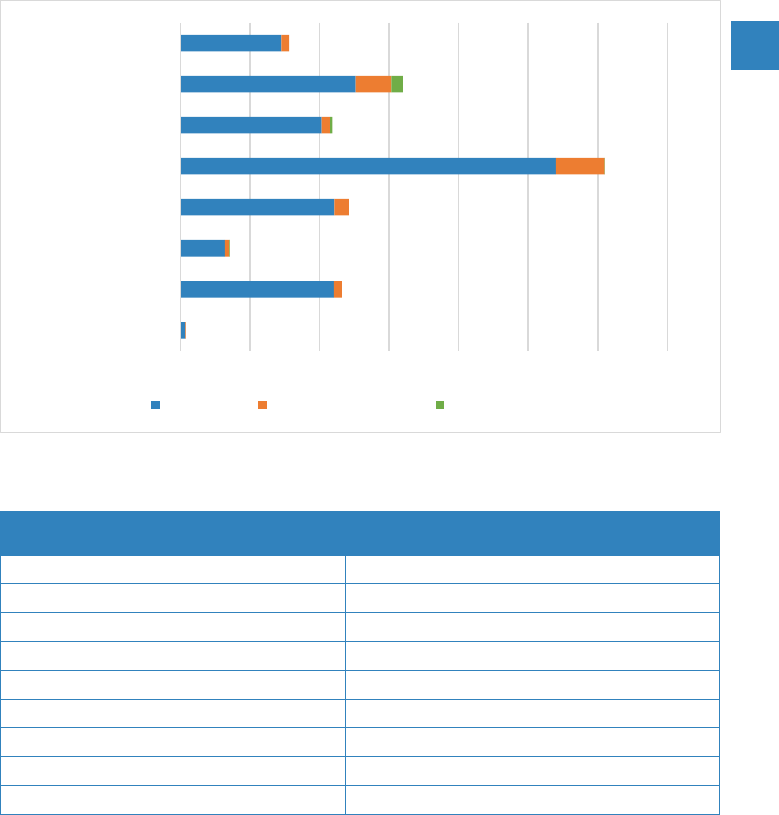
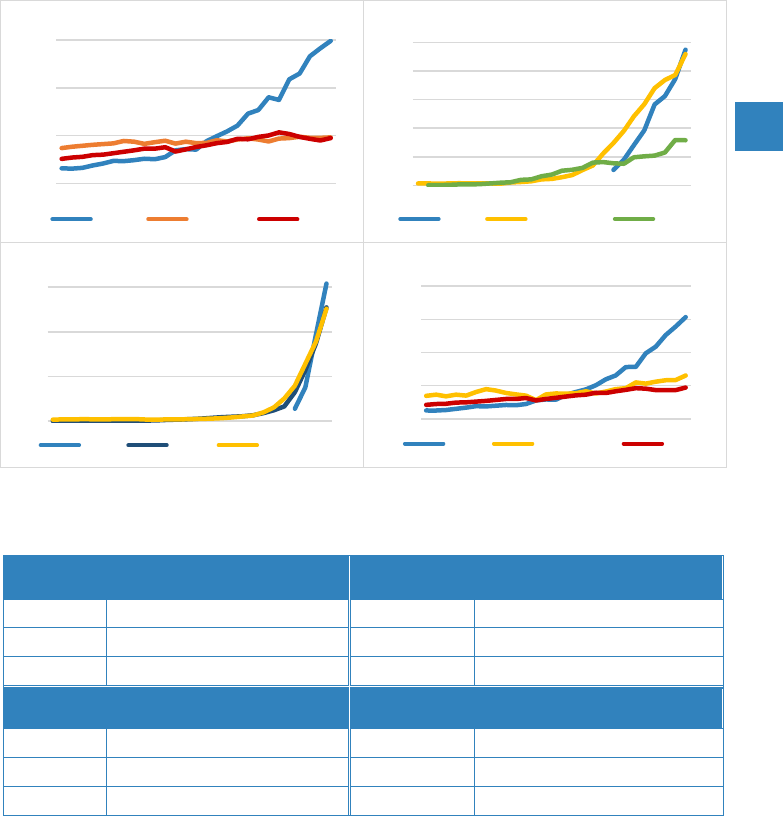
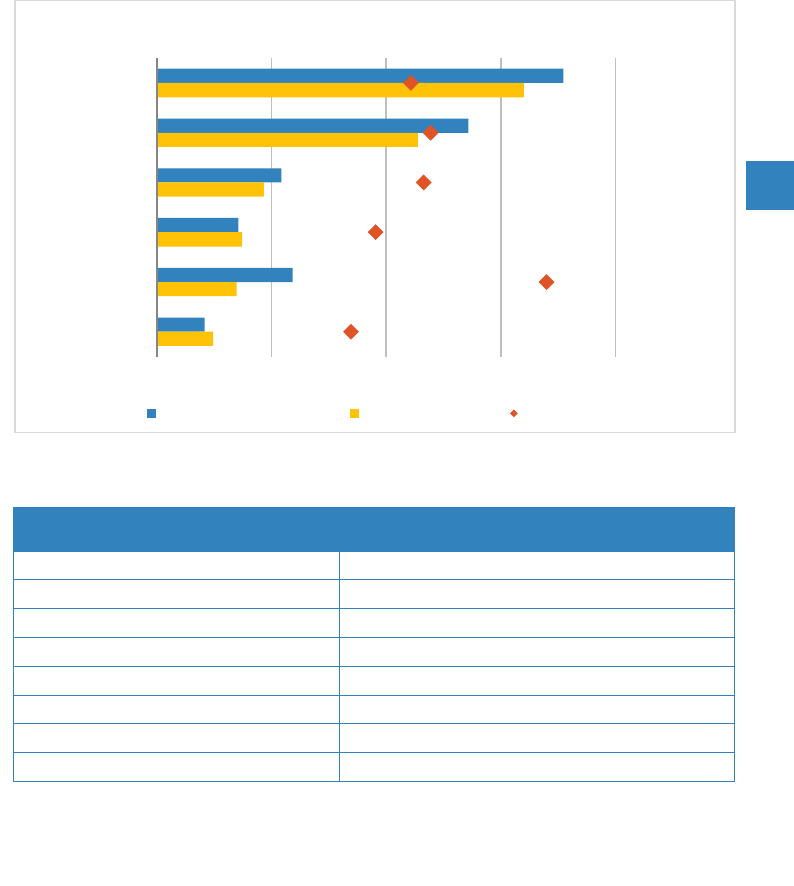
17. Primary production of coal, oil, and natural gas, major countries, 2016
Percentage
18. Primary production of coal, oil, and natural gas, major countries, 2016
Exajoules
Coal
Oil
Natural gas
China
69.6
Saudi Arabia
24.2
United States
26.3
United States
14.6
Russian Federation
23.2
Russian Federation
22.0
Australia
12.2
United States
23.0
Iran (Islamic Rep.)
7.1
Indonesia
11.8
Iraq
9.4
Qatar
6.3
India
11.4
Iran (Islamic Rep.)
9.1
Canada
6.1
Russian Federation
8.8
Canada
9.0
China
5.0
South Africa
6.1
UAE
8.4
Norway
4.3
Colombia
2.5
China
8.4
Saudi Arabia
3.9
Others
15.3
Others
71.2
Others
46.1
World
152.1
World
185.9
World
127.1
United
States
Saudi
Arabia
China
Russian
Fed.
Russian
Fed.
United
States
Iran (Islamic Rep.)
United
States
Australia
Other countries
(96)
Other countries
(98)
Other countries
(76)
0% 20% 40% 60% 80% 100%
Natural
gas
Oil
Coal

2019 Energy Statistics Pocketbook
United Nations Statistics Division
11
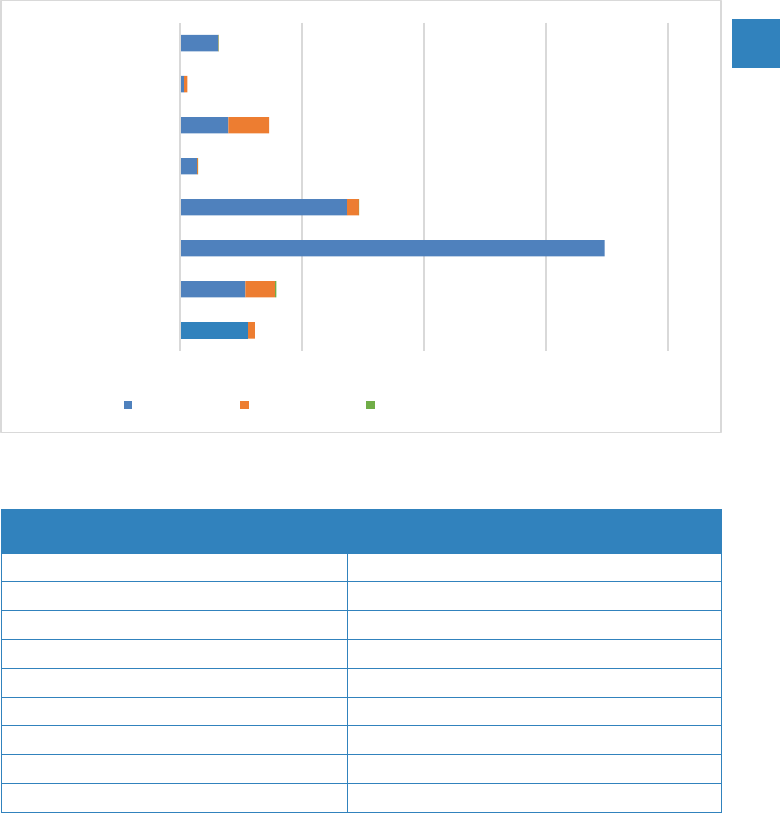
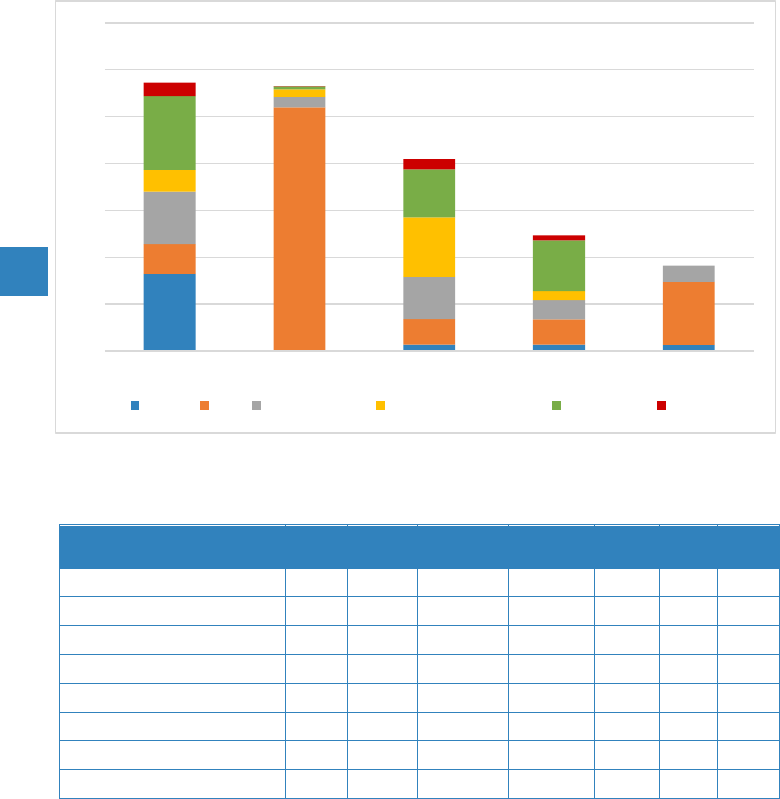
19. Primary production of biofuels and waste, nuclear, and electricity and heat, major
countries, 2016 - Percentage
20. Primary production of biofuels and waste, nuclear and electricity and heat, major
countries, 2016 – Exajoules
Biofuels and waste
Nuclear
Electricity and heat
India
8.1
United States
9.1
China
5.4
Nigeria
4.8
France
4.4
United States
2.8
United States
4.0
China
2.3
Canada
1.5
China
4.0
Russian Federation
2.1
Brazil
1.5
Brazil
3.5
Republic of Korea
1.7
Russian Federation
0.7
Indonesia
2.4
Canada
1.1
India
0.6
Ethiopia
1.3
Germany
0.9
Japan
0.6
Germany
1.3
Ukraine
0.9
Turkey
0.6
Others
23.4
Others
5.7
Others
9.2
World
52.8
World
28.2
World
22.9
China
United States
India
United
States
France
Nigeria
Canada
China
United States
Other countries
(194)
Other countries
(28)
Other countries
(205)
0% 20% 40% 60% 80% 100%
Electricity
and heat
Nuclear
Biofuels
and waste
2019 Energy Statistics Pocketbook
United Nations Statistics Division
12
21. Primary production of coal by region, 1990 – 2016
Exajoules
22. Primary production of coal by region, 1990, 2000, 2010 and 2016
Exajoules
Region
1990
2000
2010
2016
Africa
4.3
5.5
6.1
6.3
Northern America (excl. US)
1.6
1.4
1.4
1.3
United States
22.7
22.5
22.3
14.6
Latin America and the Caribbean
0.9
1.6
2.6
3.0
Asia (excl. China)
7.1
11.8
25.3
29.3
China
23.1
29.5
69.7
69.6
Europe
30.6
16.5
15.9
15.8
Oceania
4.5
7.0
10.6
12.3
World
94.8
95.8
153.9
152.1
0
20
40
60
80
100
120
140
160
1990
1991
1992
1993
1994
1995
1996
1997
1998
1999
2000
2001
2002
2003
2004
2005
2006
2007
2008
2009
2010
2011
2012
2013
2014
2015
2016
Africa Northern America (excl. US)
United States Latin America and the Caribbean
Asia (excl. China) China
Europe Oceania
0%
20%
40%
60%
80%
100%
1990 2016
2019 Energy Statistics Pocketbook
United Nations Statistics Division
13
23. Primary production of coal by region and type of fuel, 2016
Exajoules
24. Primary production of coal by region and type of fuel, 2016
Exajoules
0 20 40 60 80
Oceania
Europe
China
Asia
(excl. China)
Latin America
and the Caribbean
United States
Northern America
(excl. US)
Africa
Hard coal Brown coal Oil shale / Oil sands and Peat
Region
Hard
coal
Brown
coal
Oil shale/
peat
Total
Africa
6.3
0
+
0
+
6.3
Northern America (excl. US)
0.7
0.6
-
1.3
United States
8.0
6.6
-
14.6
Latin America and the Caribbean
2.8
0.2
0
+
3.0
Asia (excl. China)
27.4
1.9
0
+
29.3
China
69.6
-
-
69.6
Europe
10.7
4.9
0.2
15.8
Oceania
11.2
1.1
-
12.3
World
136.6
15.3
0.2
152.1
2019 Energy Statistics Pocketbook
United Nations Statistics Division
14
25. Primary production of oil by region, 1992 – 2016
Exajoules
26. Primary production of oil by region, 1992, 2000, 2010 and 2016
Exajoules
Region
1992
2000
2010
2016
Africa
14.2
17.1
21.0
15.6
Northern America
21.3
20.1
20.7
32.0
Latin America and the Caribbean
17.3
22.3
22.5
21.8
Asia (excl. Saudi Arabia)
34.4
47.2
54.0
61.0
Saudi Arabia
19.7
18.7
19.6
24.2
Europe (excl. Russian Federation)
10.5
14.3
8.6
7.1
Russian Federation
16.8
13.6
21.4
23.2
Oceania
1.5
1.6
1.2
0.8
World
135.8
154.8
168.9
185.9
0
20
40
60
80
100
120
140
160
180
1992
1993
1994
1995
1996
1997
1998
1999
2000
2001
2002
2003
2004
2005
2006
2007
2008
2009
2010
2011
2012
2013
2014
2015
2016
Africa Northern America
Latin America and the Caribbean Asia (excl. Saudi Arabia)
Saudi Arabia Europe (excl. Russian Federation)
Russian Federation Oceania
0%
20%
40%
60%
80%
100%
1992 2016
2019 Energy Statistics Pocketbook
United Nations Statistics Division
15
27. Primary production of oil by region and type of fuel, 2016
Exajoules
28. Primary production of oil by region and type of fuel, 2016
Exajoules
Region
Crude
oil
Natural
gas liquids
Other
primary
oil
Total
Africa
14.5
1.1
-
15.6
Northern America
25.2
5.1
1.6
32.0
Latin America and the Caribbean
20.3
1.2
0.3
21.8
Asia (excl. Saudi Arabia)
54.0
7.0
0.02
61.0
Saudi Arabia
22.1
2.1
-
24.2
Europe (excl. Russian Federation)
6.4
0.7
0.1
7.1
Russian Federation
22.1
1.2
-
23.2
Oceania
0.8
0.1
-
0.8
World
165.4
18.5
2.0
185.9
0 10 20 30 40 50 60 70
Oceania
Russian Federation
Europe
(excl. Russian Fed.)
Saudi Arabia
Asia
(excl. Saudi Arabia)
Latin America
and the Caribbean
Northern America
Africa
Crude oil Natural gas liquids Other primary oil
2019 Energy Statistics Pocketbook
United Nations Statistics Division
16
29. Production of natural gas by region, 1992 – 2016
Exajoules
30. Production of natural gas by region, 1992, 2000, 2010 and 2016
Exajoules
Region
1992
2000
2010
2016
Africa
2.6
4.5
7.3
7.4
Northern America (excl. United States)
4.3
6.2
5.5
6.1
United States
17.5
18.7
20.7
26.3
Latin America and the Caribbean
2.8
5.1
7.7
7.5
Asia
13.8
19.4
36.6
44.9
Europe (excl. Russian Federation)
9.0
11.4
11.3
9.4
Russian Federation
21.7
19.7
22.6
22.0
Oceania
1.0
1.4
2.0
3.5
World
72.7
86.4
113.8
127.1
0
20
40
60
80
100
120
1992
1993
1994
1995
1996
1997
1998
1999
2000
2001
2002
2003
2004
2005
2006
2007
2008
2009
2010
2011
2012
2013
2014
2015
2016
Africa Northern America (excl. US)
United States Latin America and the Caribbean
Asia Europe (excl. Russian Federation)
Russian Federation Oceania
0%
20%
40%
60%
80%
100%
1992 2016
2019 Energy Statistics Pocketbook
United Nations Statistics Division
17
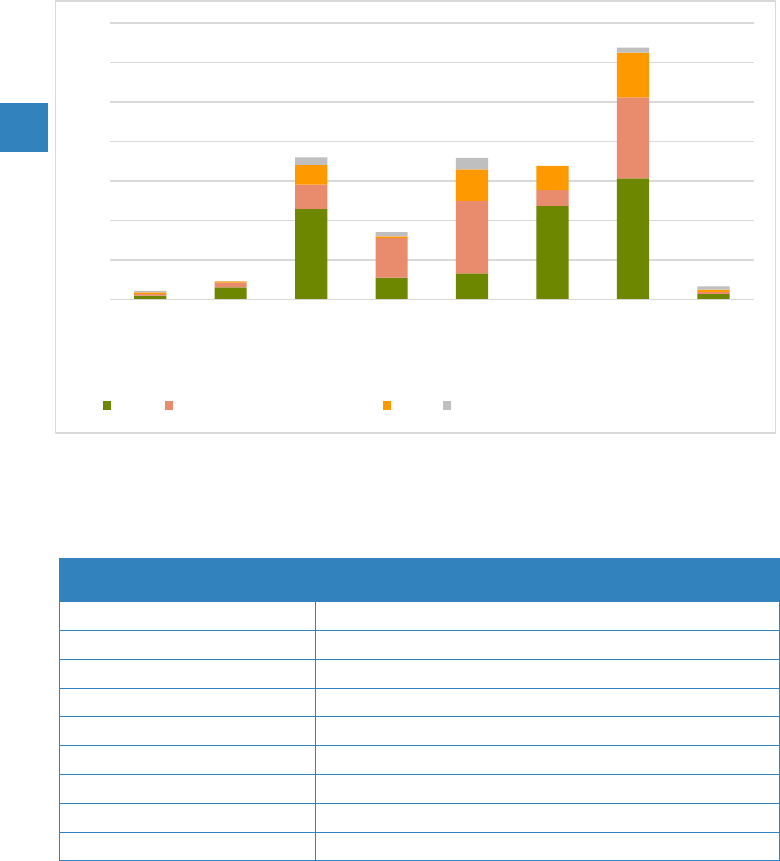
31. Primary production of biofuels and waste by region, 1990 – 2016
Exajoules
32. Primary production of biofuels and waste by region, 1990, 2000, 2010 and 2016
Exajoules
Region
1990
2000
2010
2016
Africa (excl. Nigeria)
5.2
6.9
8.5
9.9
Nigeria
2.2
2.9
4.1
4.8
Northern America
3.1
3.6
4.3
4.6
Latin America and the Caribbean
3.8
3.8
5.3
5.9
Asia (excl. India)
8.0
7.8
11.1
12.3
India
5.9
6.7
8.1
8.1
Europe
2.6
3.3
5.9
7.1
Oceania
0.3
0.3
0.3
0.3
World
30.9
35.5
47.5
52.8
0
10
20
30
40
50
1990
1991
1992
1993
1994
1995
1996
1997
1998
1999
2000
2001
2002
2003
2004
2005
2006
2007
2008
2009
2010
2011
2012
2013
2014
2015
2016
Africa (excl. Nigeria) Nigeria
Northern America Latin America and the Caribbean
Asia (excl. India) India
Europe Oceania
0%
20%
40%
60%
80%
100%
1990 2016
2019 Energy Statistics Pocketbook
United Nations Statistics Division
18
33. Primary production of biofuels and waste by region and type of fuel, 2016
Exajoules
34. Primary production of biofuels and waste by region and type of fuel, 2016
Exajoules
Region
Fuelwood
Waste
Other
biofuels
Total
Africa (excl. Nigeria)
8.7
1.0
0.2
9.9
Nigeria
2.4
2.4
0
+
4.8
Northern America
0.9
1.2
2.5
4.6
Latin America and the Caribbean
2.3
0.9
2.7
5.9
Asia (excl. India)
6.8
3.9
1.5
12.3
India
3.7
3.8
0.6
8.1
Europe
3.6
1.6
1.8
7.1
Oceania
0.1
0.01
0.2
0.3
World
28.5
14.8
9.5
52.8
0 2 4 6 8 10 12 14
Oceania
Europe
India
Asia
(excl. India)
Latin America
and the Caribbean
Northern America
Nigeria
Africa
(excl. Nigeria)
Fuelwood Waste Other biofuels
2019 Energy Statistics Pocketbook
United Nations Statistics Division
19
Electricity
35. Electricity generation per capita, 2016
Kilowatt hours per capita
FACTS AND FIGURES
World electricity generation more than doubled from 1990 to 2016, reaching
almost 25,000 TWh in 2016. The largest absolute growth from 1990 to 2016 was
observed for electricity generated from coal (around 5,300 TWh or +116%) and
natural gas (around 3,500 TWh or +213%) while the fastest growth was visible for
electricity generated from solar, wind and other sources
4
(+2,224% or 1,370 TWh).
More than 75% of electricity in 2016 was generated from non-renewable
sources, mainly from non-renewable thermal (65% or 16,186 TWh) and nuclear
sources (10% or 2,608 TWh)
5
. However, renewable electricity accounted for over
50% of global electricity capacity additions over the past six years, reaching
2,137 GW in 2016 (32% of total electricity capacity).
Source: United Nations Energy Database.
The designations employed and the presentation of material on this map do not imply the expression of any opinion whatsoever on the part of the Secretariat of the United Nations
concerning the legal status of any country, territory, city or area or of its authorities, or concerning the delimitation of its frontiers or boundaries. Dotted line represents approximately
the Line of Control in Jammu and Kashmir agreed upon by India and Pakistan. The final status of Jammu and Kashmir has not yet been agreed upon by the parties. Final boundary
between the Republic of Sudan and the Republic of South Sudan has not yet been determined. A dispute exists between the Governments of Argentina and the United Kingdom
of Great Britain and Northern Ireland concerning sovereignty over the Falkland Islands (Malvinas).
(4) “Solar, wind and other sources” refers to solar, wind, geothermal, chemical heat, tide, wave and marine and other
non-specified sources.
(5) Non-renewable sources also include chemical heat and other non-specified sources.
kWh per capita
10,000
5,000-9,999.9
2,500-4,999.9
1,000-2,499.9
<1,000
No data
2019 Energy Statistics Pocketbook
United Nations Statistics Division
20
36. Total electricity generation by region, 1990 – 2016
Petawatt hours
37. Total electricity generation by region, 2016
Terawatt hours
Region
1990
2000
2010
2016
Africa
312.3
436.8
676.9
814.3
Northern America (excl. US)
482.9
606.7
605.6
668.6
United States
3,218.6
4,052.7
4,378.4
4,322.0
Latin America and the Caribbean
624.3
1,005.7
1,407.2
1,627.5
Asia (excl. China)
1,947.4
3,408.6
5,046.9
6,243.4
China
621.2
1,355.6
4,207.2
6,142.5
Europe
4,570.9
4,386.5
4,916.6
4,858.1
Oceania
192.5
257.7
307.7
311.8
World
11,970.1
15,510.2
21,546.3
24,988.2
0
5
10
15
20
25
1990
1991
1992
1993
1994
1995
1996
1997
1998
1999
2000
2001
2002
2003
2004
2005
2006
2007
2008
2009
2010
2011
2012
2013
2014
2015
2016
Africa Northern America (excl. US)
United States of America Latin America and the Caribbean
Asia (excl. China) China
Europe Oceania
0%
20%
40%
60%
80%
100%
1990 2016
2019 Energy Statistics Pocketbook
United Nations Statistics Division
21
38. World electricity generation by source, 1990 – 2016
Petawatt hours
39. World electricity generation by source, 1990, 2000, 2010 and 2016
Terawatt hours
Source
1990
2000
2010
2016
Thermal
7,696.7
10,110.7
14,747.8
16,796.5
- Coal
4,597.5
6,039.6
9,009.2
9,914.2
- Oil
1,333.8
1,324.9
1,036.6
986.2
- Natural gas
1,652.0
2,539.5
4,245.1
5,169.8
- Biofuels and waste
113.3
206.6
457.0
726.3
Nuclear
2,019.8
2,589.0
2,756.3
2,608.1
Hydro
2,192.1
2,706.6
3,528.4
4,152.2
Solar, wind and other sources
61.6
103.9
513.8
1,431.3
Total
11,970.1
15,510.2
21,546.3
24,988.2
0
5
10
15
20
25
1990
1991
1992
1993
1994
1995
1996
1997
1998
1999
2000
2001
2002
2003
2004
2005
2006
2007
2008
2009
2010
2011
2012
2013
2014
2015
2016
Coal Oil
Natural gas Biofuels and waste
Nuclear Hydro
Solar, wind and other sources
0%
20%
40%
60%
80%
100%
1990 2016
2019 Energy Statistics Pocketbook
United Nations Statistics Division
22
40. Thermal electricity generation by region and source, 2016
Petawatt hours
41. Thermal electricity generation by region and source, 2016
Terawatt hours
Region
Coal
Oil
Natural gas
Biofuels
and waste
Total
Africa
255.7
99.8
299.7
3.5
658.7
Northern America (excl. US)
60.6
10.0
62.7
12.6
145.9
United States
1,558.7
37.3
1,209.0
80.9
2,886.0
Latin America and the Caribbean
116.4
185.0
396.3
99.8
797.4
Asia (excl. China)
2,467.8
548.3
1,927.3
208.0
5,151.4
China
4,203.9
12.0
163.6
57.5
4,437.1
Europe
1,082.8
80.9
1,056.9
259.3
2,480.0
Oceania
168.4
12.8
54.2
4.5
239.9
World
9,914.2
986.2
5,169.8
726.3
16,796.5
0.0
1.0
2.0
3.0
4.0
5.0
6.0
Africa Northern
America
(excl. US)
United
States
Latin
America
and the
Caribbean
Asia (excl.
China)
China Europe Oceania
Coal Oil Natural gas Biofuels and waste
2019 Energy Statistics Pocketbook
United Nations Statistics Division
23
42. Renewable electricity share in total electricity generation, 2016
Percentage
43. Renewable electricity generation by type, major countries, 2016
Terawatt hours
Country
Hydro
Country
Wind
Country
Total
renewables
China
1,193.4
China
237.1
China
1,531.4
Canada
387.2
United States
229.5
United States
651.9
Brazil
380.9
Germany
78.6
Brazil
470.7
United States
292.1
Spain
48.9
Canada
433.4
Russian Federation
186.6
United Kingdom
37.4
India
270.1
Norway
144.0
India
35.5
Germany
193.8
Others
1,568.0
Others
283.1
Others
2,567.4
World
4,152.2
World
950.1
World
6,118.7
Source: United Nations Energy Database.
The designations employed and the presentation of material on this map do not imply the expression of any opinion whatsoever on the part of the Secretariat of the United Nations
concerning the legal status of any country, territory, city or area or of its authorities, or concerning the delimitation of its frontiers or boundaries. Dotted line represents approximately
the Line of Control in Jammu and Kashmir agreed upon by India and Pakistan. The final status of Jammu and Kashmir has not yet been agreed upon by the parties. Final boundary
between the Republic of Sudan and the Republic of South Sudan has not yet been determined. A dispute exists between the Governments of Argentina and the United Kingdom
of Great Britain and Northern Ireland concerning sovereignty over the Falkland Islands (Malvinas).
Percentage
90
50-89.9
20-49.9
5-19.9
<5
No data
2019 Energy Statistics Pocketbook
United Nations Statistics Division
24
44. Electricity from non-hydro renewable sources by region and type, 2016
Terawatt hours
45. Electricity from non-hydro renewable sources by region and type, 2016
Terawatt hours
Region
Wind
Thermal
(ren.).
Solar
Geothermal
and tide
Total
Africa
10.3
3.5
4.2
4.5
22.6
Northern America (excl. US)
30.8
12.4
3.0
0.02
46.2
United States
229.5
61.4
50.3
18.6
359.8
Latin America and the Caribbean
55.7
99.7
5.0
10.1
170.5
Asia (excl. China)
65.9
184.1
79.2
29.6
358.8
China
237.1
39.4
61.6
-
338.0
Europe
306.3
205.2
113.0
12.7
637.1
Oceania
14.6
4.5
6.4
7.8
33.3
World
950.1
610.3
322.8
83.3
1,966.5
0
100
200
300
400
500
600
700
Africa Northern
America
(excl. US)
United
States
Latin
America
and the
Caribbean
Asia (excl.
China)
China Europe Oceania
Wind Thermal from renewables Solar Geothermal and tide, wave, marine
2019 Energy Statistics Pocketbook
United Nations Statistics Division
25
46. Renewable electricity by type, major countries in 2016, 1990 – 2016
Terawatt hours
47. Renewable electricity by type, major countries in 2016, 1990 and 2016, and share
in total electricity generation, 2016
Gigawatt hours and percentage
Hydro
1990
2016
% 2016
Wind
1990
2016
% 2016
China
126,720
1,193,374
19%
China
0
237,071
4%
Canada
296,848
387,208
58%
United States
3,066
229,471
5%
Brazil
206,708
380,911
66%
Germany
215
1991
78,598
12%
Solar
1990
2016
% 2016
Total
renewables
1990
2016
% 2016
China
0
61,586
1%
China
126,720
1,531,408
25%
Japan
67
50,952
5%
United States
346,434
651,937
15%
United States
666
50,334
1%
Brazil
210,246
470,722
81%
0
400
800
1200
1990 1995 2000 2005 2010 2016
Hydro
China Canada Brazil
0
50
100
150
200
250
1990 1995 2000 2005 2010 2016
Wind
China United States Germany
0
20
40
60
1990 1995 2000 2005 2010 2016
Solar
China Japan United States
0
500
1000
1500
2000
1990 1995 2000 2005 2010 2016
Total renewables
China United States Brazil
2019 Energy Statistics Pocketbook
United Nations Statistics Division
26
48. World electricity capacity by type
6
, 1990 – 2016
Terawatt
49. World electricity capacity by type
6
, 1990, 2000, 2010 and 2016
Gigawatt
Type
1990
2000
2010
2016
Non-renewable of which
2,088.9
2,632.4
3,856.0
4,578.1
- Thermal (non-ren.)
1,758.5
2,273.9
3,466.5
4,162.8
- Nuclear
330.4
358.3
381.8
399.9
Renewable of which
672.0
839.6
1,324.0
2,136.8
- Thermal (ren.)
19.0
29.0
66.9
103.7
- Hydro
644.2
783.8
1,026.5
1,248.3
- Wind
2.4
17.2
180.5
474.6
- Solar
0.4
1.2
39.9
297.8
Total
2,760.9
3,472.1
5,180.0
6,714.9
0.0
1.0
2.0
3.0
4.0
5.0
6.0
1990
1991
1992
1993
1994
1995
1996
1997
1998
1999
2000
2001
2002
2003
2004
2005
2006
2007
2008
2009
2010
2011
2012
2013
2014
2015
2016
Thermal (non-ren.) Nuclear Thermal (ren.) Hydro Wind Solar
0%
20%
40%
60%
80%
100%
1990 2016
(6) Non-renewables sources refer to thermal from non-renewable fuels, nuclear and other non-specified capacities.
Renewable sources refer to thermal from renewable fuels, hydro, wind, solar, geothermal and tide, wave and marine
capacities. Sources not shown in tables 49 and 51 have negligible values for capacity (less than 28 GW in 2016) and are not
included in chart 48.
2019 Energy Statistics Pocketbook
United Nations Statistics Division
27
50. World electricity capacity by type
6
, 1990 – 2016
Index number (1990=100)
51. World electricity capacity by type
6
, 1990, 2000, 2010 and 2016, and share in 2016
Index numbers (1990=100) and percentage
Type
1990
2000
2010
2016
% 2016
Non-renewable of which
100
126
185
219
68.2%
- Thermal (non-ren.)
100
129
197
237
62.0%
- Nuclear
100
108
116
121
6.0%
Renewable of which
100
125
197
318
31.8%
- Thermal (ren.)
100
153
352
546
1.5%
- Hydro
100
122
159
194
18.6%
- Wind
100
728
7,664
20,152
7.1%
- Solar
100
342
11,333
84,604
4.4%
Total
100
126
188
243
100.0%
0
50
100
150
200
250
300
350
1990
1991
1992
1993
1994
1995
1996
1997
1998
1999
2000
2001
2002
2003
2004
2005
2006
2007
2008
2009
2010
2011
2012
2013
2014
2015
2016
Renewable sources Non-renewable sources
2019 Energy Statistics Pocketbook
United Nations Statistics Division
28
52. Total electricity capacity by region, 1990 – 2016
Terawatt
53. Total electricity capacity by region, 1990, 2000, 2010 and 2016
Gigawatt
Region
1990
2000
2010
2016
Africa
74.7
101.4
141.2
193.1
Northern America
838.0
923.0
1,173.8
1,231.3
Latin America and the Caribbean
162.4
231.2
324.2
414.7
Asia
611.8
1,119.4
2,221.9
3,389.4
Europe
1,026.9
1,040.4
1,245.5
1,408.2
Oceania
47.1
56.7
73.4
78.2
World
2,760.9
3,472.1
5,180.0
6,714.9
0.0
0.5
1.0
1.5
2.0
2.5
3.0
3.5
1990
1991
1992
1993
1994
1995
1996
1997
1998
1999
2000
2001
2002
2003
2004
2005
2006
2007
2008
2009
2010
2011
2012
2013
2014
2015
2016
Africa Northern America
Latin America and the Caribbean Asia
Europe Oceania
2019 Energy Statistics Pocketbook
United Nations Statistics Division
29
54. Electricity capacity by type (hydro, wind and solar), major countries, 2016
Percentage
55. Electricity capacity by type (hydro, wind and solar), major countries, 2016
Gigawatt
Country
Hydro
Country
Wind
Country
Solar
China
344.4
China
147.5
China
76.3
United States
102.7
United States
81.3
Japan
42.0
Brazil
96.9
Germany
49.6
Germany
40.7
Canada
80.3
India
35.5
United States
34.7
Russian Federation
51.0
Spain
23.0
Italy
19.3
Japan
50.1
United Kingdom
16.2
India
12.5
Others
523.0
Others
121.5
Others
72.2
World
1,248.3
World
474.6
World
297.8
China
China
China
Japan
US
US
Germany
Germany
Brazil
Other countries
(145)
Other countries
(113)
Other countries
(159)
0% 20% 40% 60% 80% 100%
Solar
Wind
Hydro
2019 Energy Statistics Pocketbook
United Nations Statistics Division
30
56. Electricity capacity by type (thermal, nuclear, total) major countries, 2016
Percentage
57. Electricity capacity by type (thermal, nuclear, total) major countries, 2016
Gigawatt
Country
Thermal
Country
Nuclear
Country
Total
China
1,160.3
United States
99.6
China
1,762.1
United States
764.8
France
63.1
United States
1,086.8
India
267.1
Japan
41.5
India
377.1
Japan
198.2
China
33.6
Japan
335.6
Russian Federation
187.6
Russian Federation
27.2
Russian Federation
266.5
Germany
95.7
Republic of Korea
23.1
Germany
208.5
Others
1,592.8
Others
111.8
Others
2,678.1
World
4,266.5
World
399.9
World
6,714.9
China
US
China
US
France
US
India
Japan
India
Other countries
(227)
Other countries
(28)
Other countries
(226)
0% 20% 40% 60% 80% 100%
Total
Nuclear
Thermal
2019 Energy Statistics Pocketbook
United Nations Statistics Division
31
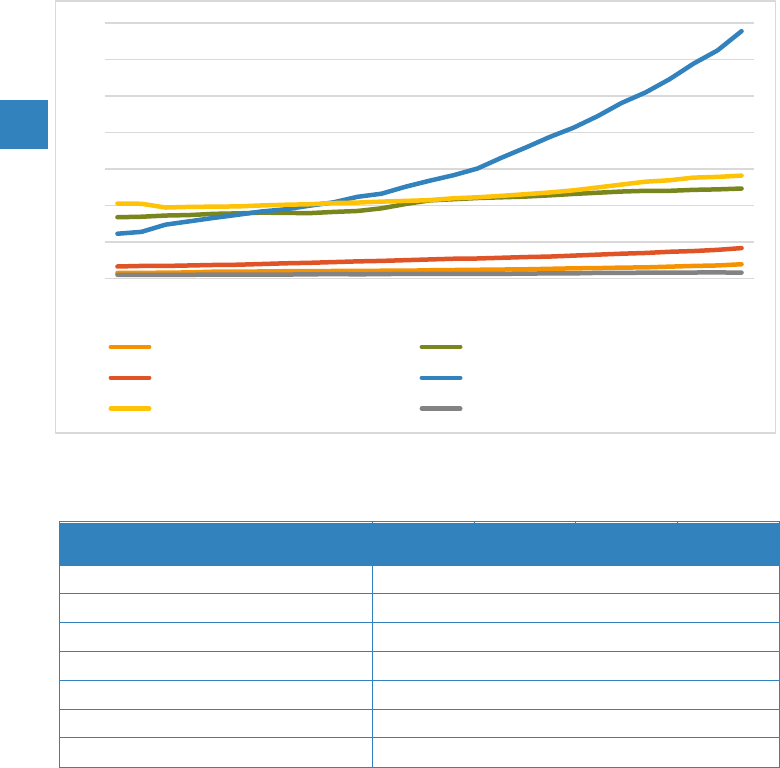
58. Utilization of electricity capacity by type, 1990 – 2016
Percentage
59. Utilization of electricity capacity by type, 1990, 2000, 2010 and 2016
Percentage
Type
1990
2000
2010
2016
Thermal
49%
50%
48%
45%
Hydro
39%
39%
39%
38%
Nuclear
70%
82%
82%
74%
Wind
19%
20%
22%
23%
Solar
24%
12%
9%
12%
Total
49%
51%
47%
42%
0
10
20
30
40
50
60
70
80
90
1990
1991
1992
1993
1994
1995
1996
1997
1998
1999
2000
2001
2002
2003
2004
2005
2006
2007
2008
2009
2010
2011
2012
2013
2014
2015
2016
Thermal Hydro Nuclear Wind Solar
2019 Energy Statistics Pocketbook
United Nations Statistics Division
32
Refinery output
60. Total refinery output by region, 1990 – 2016
Billion metric tons
61. Total refinery output by region, 1990, 2000, 2010 and 2016
Million metric tons
Region
1990
2000
2010
2016
Africa
106.3
118.5
119.1
101.7
Northern America (excl. US)
84.2
93.7
96.1
88.7
United States
730.6
817.9
815.8
827.0
Latin America and the Caribbean
261.8
315.2
321.9
280.8
Asia (excl. China)
645.9
983.8
1,127.6
1,258.4
China
106.0
191.8
440.5
633.8
Europe
1,094.3
919.8
947.5
944.8
Oceania
35.5
41.8
36.8
28.3
World
3,064.4
3,482.4
3,905.3
4,163.5
0.0
0.5
1.0
1.5
2.0
2.5
3.0
3.5
4.0
1990
1991
1992
1993
1994
1995
1996
1997
1998
1999
2000
2001
2002
2003
2004
2005
2006
2007
2008
2009
2010
2011
2012
2013
2014
2015
2016
Africa Northern America (excl. US)
United States Latin America and the Caribbean
Asia (excl. China) China
Europe Oceania
0%
20%
40%
60%
80%
100%
1990 2016
2019 Energy Statistics Pocketbook
United Nations Statistics Division
33
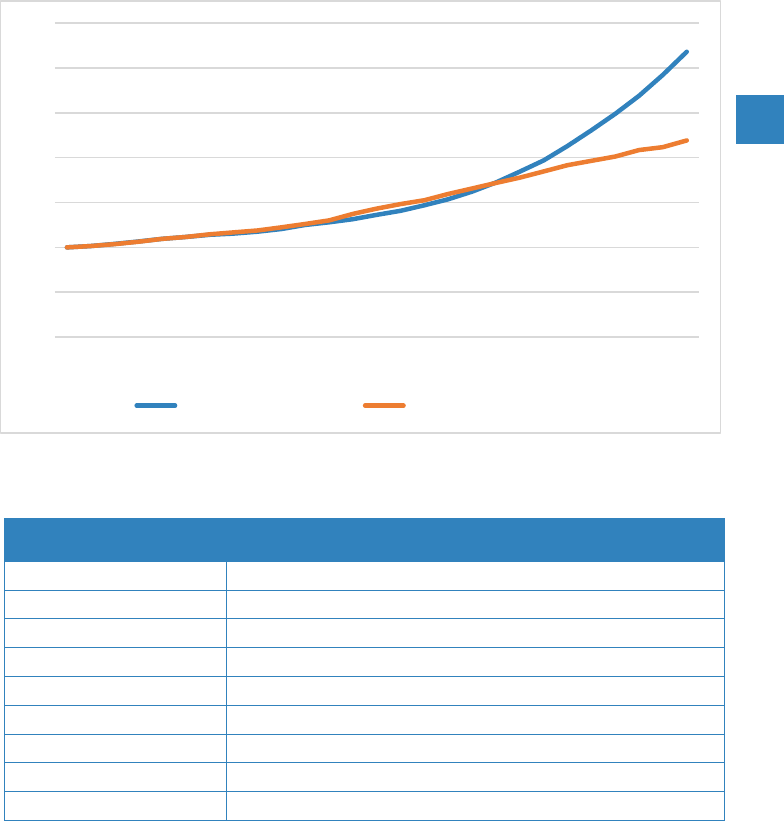
62. World total refinery input and refinery output by type of fuel, 1990 – 2016
Billion metric tons
63. World total refinery input and refinery output by type, 1990, 2000, 2010 and 2016
Million metric tons
Refinery input
and output
1990
2000
2010
2016
Total refinery input
3,115.7
3,555.3
3,969.5
4,240.9
Total refinery output
3,064.4
3,482.4
3,905.3
4,163.5
- Naphtha
104.7
192.3
244.3
280.3
- Gasolines
749.0
834.3
893.9
993.8
- Kerosenes
258.1
311.4
316.3
359.0
- Gas/diesel oil
813.2
1,022.8
1,230.6
1,333.9
- Fuel oil
732.1
615.0
540.7
457.7
- Other
407.4
506.7
679.5
738.7
0.0
0.5
1.0
1.5
2.0
2.5
3.0
3.5
4.0
4.5
1990
1991
1992
1993
1994
1995
1996
1997
1998
1999
2000
2001
2002
2003
2004
2005
2006
2007
2008
2009
2010
2011
2012
2013
2014
2015
2016
Naphtha Gasolines Kerosenes Gas/diesel oil
Fuel oil Other Refinery input
2019 Energy Statistics Pocketbook
United Nations Statistics Division
34
64. Total refinery capacity, input and output by region, 2016
Billion metric tons
65. Total refinery capacity, input and output by region, 2016
Million metric tons
Region
Capacity
Input
Output
Africa
171.6
104.0
101.7
Northern America (excl. US)
102.6
92.8
88.7
United States
917.8
842.8
827.0
Latin America and the Caribbean
402.9
283.7
280.8
Asia (excl. China)
1,428.6
1,303.4
1,258.4
China
748.1
621.5
633.8
Europe
1,122.3
964.1
944.8
Oceania
29.3
28.6
28.3
World
4,923.1
4,240.9
4,163.5
0.0
0.2
0.4
0.6
0.8
1.0
1.2
1.4
1.6
Africa Northern
America
(excl. US)
United
States
Latin
America
and the
Caribbean
Asia (excl.
China)
China Europe Oceania
Capacity Input Output
2019 Energy Statistics Pocketbook
United Nations Statistics Division
35
66. Total refinery output and total oil supply, countries with the largest total oil supply, 2016
Exajoules and ratio between total refinery output and total oil supply
67. Total refinery output and total oil supply
7
, countries with the largest total oil supply, 2016
Exajoules and ratio between total refinery output and total oil supply
Country
Refinery
output
Oil
supply
Output/
oil supply
United States
35.5
32.0
1.11
China
27.2
22.8
1.19
India
10.9
9.3
1.16
Japan
7.1
7.5
0.95
Russian Federation
11.9
7.0
1.70
Brazil
4.2
4.9
0.85
Others
82.4
82.0
1.01
World
179.0
181.7
-
1.11
1.19
1.16
0.95
1.70
0.85
0.0 10.0 20.0 30.0 40.0
United
States
China
India
Japan
Russian
Federation
Brazil
Refinery output Oil supply Output/oil supply
(7) World oil energy supply includes international aviation and marine bunkers; conversely, bunkers are excluded from oil
energy supply calculated for countries. For further explanations, please refer to the General notes.
2019 Energy Statistics Pocketbook
United Nations Statistics Division
36
Total final consumption
68. Total final consumption per capita, 2016
Gigajoules per capita
Source: United Nations Energy Database.
The designations employed and the presentation of material on this map do not imply the expression of any opinion whatsoever on the part of the Secretariat of the United Nations
concerning the legal status of any country, territory, city or area or of its authorities, or concerning the delimitation of its frontiers or boundaries. Dotted line represents approximately
the Line of Control in Jammu and Kashmir agreed upon by India and Pakistan. The final status of Jammu and Kashmir has not yet been agreed upon by the parties. Final boundary
between the Republic of Sudan and the Republic of South Sudan has not yet been determined. A dispute exists between the Governments of Argentina and the United Kingdom
of Great Britain and Northern Ireland concerning sovereignty over the Falkland Islands (Malvinas).
FACTS AND FIGURES
World total final consumption
8
(TFC) exceeded 395 EJ in 2016, showing an
increase of 56% compared to 1990. Energy use in the industry and transport
sectors dominated TFC in 2016, accounting in total for almost 60% of TFC. Annual
energy use in industry decreased for the first time since the crisis in 2009 (almost
2% compared to 2015), whereas transport was the fastest growing consuming
sector over the same period. Year-to-year, households and transport
consumption increased the most in 2016, respectively by 2.9% and by 2.6%
compared to 2015.
In 2016, more than 79% of coal TFC (or 33 EJ) occurred in the industry sector,
while 63% of oil TFC (almost 104 EJ) was used for transportation. Most of natural
gas TFC happened in industry (more than 37% or 22 EJ) and households (almost
30% or 18 EJ). The largest share of electricity end use was accounted for by the
industry sector (42% of all electricity).
(8) Fuels used for electricity generation are not accounted here, but indirectly as electricity TFC. World TFC includes
international aviation and marine bunkers. For further explanations, please refer to the General notes.
Gigajoules per capita
100
50-99.9
30-
49.9
15-29.9
<15
No
data
2019 Energy Statistics Pocketbook
United Nations Statistics Division
37
69. Total final consumption by region and source, 2016
Exajoules
70. Total final consumption by region and source, 2016
Exajoules
Region
Coal
Oil
Natural
gas
Biofuels
and waste
Elec
-tricity
Heat
Total
Africa
0.7
6.9
1.6
12.1
2.3
0.02
23.7
Northern America (excl. US)
0.1
3.9
1.9
0.4
1.7
0.03
8.0
United States
0.7
31.7
14.1
3.2
13.7
0.4
63.8
Latin America and the Caribbean
0.8
13.0
3.1
4.1
4.8
0.01
25.8
Asia (excl. China)
11.2
42.9
16.1
14.1
18.9
0.9
104.0
China
25.5
20.4
4.6
3.3
18.4
3.8
75.9
Europe
2.3
27.5
17.9
4.3
14.1
7.2
73.4
Oceania
0.1
2.2
0.7
0.3
0.9
0.02
4.2
International bunkers
-
16.3
0
+
-
-
-
16.3
World
41.5
164.8
60.1
41.7
74.8
12.3
395.1
0
20
40
60
80
100
120
Africa Northern
America
(excl. US)
United
States
Latin
America
& Carib.
Asia
(excl.
China)
China Europe Oceania Intl.
bunkers
Coal Oil Natural Gas Biofuels and waste Electricity Heat
2019 Energy Statistics Pocketbook
United Nations Statistics Division
38
71. Total final consumption by region, 1990 – 2016
Exajoules
72. Total final consumption by region, 1990, 2000, 2010 and 2016
Exajoules
Region 1990 2000 2010 2016
Africa 11.2 15.0 20.2 23.7
Northern America (excl. US) 6.8 8.0 8.0 8.0
United States 55.0 64.6 63.7 63.8
Latin America and the Caribbean 14.0 18.9 24.7 25.8
Asia (excl. China) 46.1 67.7 91.3 104.0
China 22.0 28.2 62.2 75.9
Europe 85.8 73.5 76.3 73.4
Oceania 2.9 3.6 3.9 4.2
International bunkers 8.8 11.1 14.9 16.3
World 252.7 290.6 365.3 395.1
0
50
100
150
200
250
300
350
1990
1991
1992
1993
1994
1995
1996
1997
1998
1999
2000
2001
2002
2003
2004
2005
2006
2007
2008
2009
2010
2011
2012
2013
2014
2015
2016
Africa Northern America (excl. US)
United States Latin America and the Caribbean
Asia (excl. China) China
Europe Oceania
International bunkers
0%
20%
40%
60%
80%
100%
1990 2016
2019 Energy Statistics Pocketbook
United Nations Statistics Division
39
73. World total final consumption by source, 1990 – 2016
Exajoules
74. World total final consumption by source, 1990, 2000, 2010 and 2016
Exajoules
Source
1990
2000
2010
2016
Coal
33.3
24.4
41.7
41.5
Oil
108.7
131.1
152.1
164.8
Natural gas
40.7
48.0
55.9
60.1
Biofuels and waste
27.4
30.8
39.3
41.7
Electricity
35.3
45.8
64.4
74.8
Heat
7.2
10.5
11.9
12.3
Total
252.7
290.6
365.3
395.1
0
50
100
150
200
250
300
350
1990
1991
1992
1993
1994
1995
1996
1997
1998
1999
2000
2001
2002
2003
2004
2005
2006
2007
2008
2009
2010
2011
2012
2013
2014
2015
2016
Coal Oil Natural gas Biofuels and waste Electricity Heat
0%
20%
40%
60%
80%
100%
1990 2016
2019 Energy Statistics Pocketbook
United Nations Statistics Division
40
75. World total final consumption by sector and source, 2016
Exajoules
76. World total final consumption by sector and source, 2016
Exajoules
Sector
Coal
Oil
Natural
gas
Biofuels
and waste
Elec-
tricity
Heat
Total
Total final consumption
41.5
164.8
60.1
41.7
74.8
12.3
395.1
-
Total energy consumption
38.7
138.0
53.1
41.7
74.8
12.3
358.7
- Industry
32.9
12.7
22.5
9.2
31.4
5.7
114.4
- Transport
0.1
103.9
4.5
3.2
1.3
0.03
112.9
-of which Intl. bunkers
-
16.3
0
+
-
-
-
16.3
- Households
2.8
10.8
18.0
25.4
20.5
4.4
81.9
- Other
2.9
10.7
8.2
3.9
21.6
2.2
49.4
- Non-energy use
2.8
26.8
6.9
-
-
-
36.5
0
20
40
60
80
100
120
140
Industry Transport Households Other Non-energy use
Coal Oil Natural Gas Biofuels and waste Electricity Heat
2019 Energy Statistics Pocketbook
United Nations Statistics Division
41
77. Renewable energy share in total final energy consumption (TFEC), 2016
Percentage
78. Final consumption (total and per capita) and renewable energy share in TFEC,
major countries, 2016
Exajoules, gigajoules per capita and percentage
Country
TFC
Country
TFC per
capita
Country
% REN
in TFEC
China
75.9
Trinidad and Tobago
394.6
Dem. Rep. Congo
97.0%
United States
63.8
Iceland
378.1
Somalia
94.7%
India
26.7
Qatar
291.5
Ethiopia
89.6%
Russian Fed.
19.8
Luxembourg
262.3
Burundi
89.2%
Japan
12.3
United Arab Emirates
253.8
Uganda
88.6%
Brazil
9.8
S. Maarten (Dutch part)
245.8
Zambia
87.9%
Germany
9.4
Gibraltar
237.0
Guinea-Bissau
86.4%
Canada
8.0
Falkland Isl. (Malvinas)
230.4
U. Rep. Tanzania
86.2%
Others
153.2
Others
50.3
Others
16.7%
World
395.1
World
52.9
World
16.8%
Source: United Nations Energy Database.
The designations employed and the presentation of material on this map do not imply the expression of any opinion whatsoever on the part of the Secretariat of the United Nations
concerning the legal status of any country, territory, city or area or of its authorities, or concerning the delimitation of its frontiers or boundaries. Dotted line represents approximately
the Line of Control in Jammu and Kashmir agreed upon by India and Pakistan. The final status of Jammu and Kashmir has not yet been agreed upon by the parties. Final boundary
between the Republic of Sudan and the Republic of South Sudan has not yet been determined. A dispute exists between the Governments of Argentina and the United Kingdom
of Great Britain and Northern Ireland concerning sovereignty over the Falkland Islands (Malvinas).
Percentage
80
40-79.9
20-39.9
5-19.9
<5
No
data
2019 Energy Statistics Pocketbook
United Nations Statistics Division
42
Energy balance, 2016 (Exajoules)
World
Primary
coal
Coal
products
Primary
oil
Oil
products
Primary production
152.1
-
185.9
-
Imports
31.7
0.8
96.7
58.7
Exports
-34.3
-0.8
-97.1
-61.1
Stock changes
4.4
0.5
-0.9
-0.4
Total energy supply
153.9
0.4
184.6
-2.8
Statistical difference
-1.2
-0.3
-0.2
-2.4
Transfers
-
-
-1.7
5.4
Transformation
-119.5
11.2
-181.7
168.5
Electricity plants
-83.9
-1.8
-1.6
-7.4
- CHP and heat plants
-13.0
-0.9
-0.04
-1.2
- Coke ovens
-19.9
21.4
-
-0.1
- Oil refineries
-
-
-171.2
170.8
- Other transformation
-2.6
-7.5
-8.8
6.4
- Energy industries own use
-4.8
-1.1
-0.5
-9.1
Losses
-0.1
-0.1
-0.4
-0.02
Final consumption
30.8
10.7
0.5
164.3
- Final energy consumption
28.9
9.8
0.3
137.8
- Industry
23.3
9.6
0.3
12.4
- Iron and steel
3.8
8.0
0
+
0.3
- Chemical and petrochem.
2.3
0.4
0.1
2.4
- Non-ferrous metals
0.1
0.02
0
+
0.2
- Non-metallic minerals
1.5
0.1
0
+
1.4
- Other industries
15.6
1.1
0.1
8.2
- Transport
9
0.1
0
+
0
+
103.9
- of which Road
-
-
-
77.9
- of which Aviation
-
-
-
13.0
- Households
2.7
0.2
-
10.8
- Commerce, public services
0.4
0.02
-
2.8
- Other energy use
2.4
0.04
0
+
7.9
- Non-energy use
1.9
0.9
0.3
26.5
(9) Including international bunkers.
2019 Energy Statistics Pocketbook
United Nations Statistics Division
43
d---
Natural
gas
Biofuels
and waste
Nuclear
Electricity
Heat
Total
of which:
renewables
10
127.1
52.8
28.2
19.2
3.7
569.0
73.9
37.8
1.0
-
2.6
0
+
229.2
0.9
-37.9
-0.8
-
-2.6
0
-
-234.7
-0.8
0.8
0
-
-
-
-
4.4
0
-
127.8
53.0
28.2
19.2
3.7
567.9
74.1
1.2
0
-
-
0.4
0.03
-2.5
19.6
-
-0.1
-
-
-
3.6
-0.1
-52.9
-10.8
-28.2
70.4
11.1
-131.8
-12.3
-36.4
-5.0
-27.9
62.9
-3.6
-104.7
-6.9
-15.0
-2.5
-0.3
7.5
14.7
-10.8
-2.1
0
-
0
-
-
-
-
1.3
-
-0.02
-
-
-
-
-0.4
-
-1.5
-3.2
-
-
-
-17.2
-3.2
-12.4
-0.5
-
-7.4
-1.5
-37.4
-0.5
-1.1
-0.01
-
-7.0
-0.9
-9.7
-0.01
60.1
41.7
-
74.8
12.3
395.1
41.6
53.1
41.7
-
74.8
12.3
358.7
41.6
22.5
9.2
-
31.4
5.7
114.4
8.9
2.3
0.2
-
4.1
0.6
19.2
0.2
4.9
0.1
-
4.2
2.2
16.6
0.1
0.5
0.01
-
1.7
0.02
2.6
0.01
1.9
0.2
-
0.9
0.1
6.1
0.1
12.8
8.7
-
20.6
2.8
69.9
8.6
4.5
3.2
-
1.3
0.03
112.9
3.2
1.7
3.2
-
0.1
-
82.8
3.2
-
-
-
-
-
13.0
-
18.0
25.4
-
20.5
4.4
81.9
25.6
7.3
1.1
-
15.3
1.6
28.5
1.2
0.9
2.8
-
6.2
0.6
20.9
2.8
6.9
-
-
-
-
36.5
-
(10) See General notes.
2019 Energy Statistics Pocketbook
United Nations Statistics Division
44
Energy balance, 2016 (Petajoules)
Africa
Primary
coal
Coal
products
Primary
oil
Oil
products
Primary production
6,313.2
-
15,631.3
-
Imports
330.3
10.7
1,619.8
5,118.0
Exports
-1,879.2
-7.4
-12,134.6
-1,728.3
International bunkers
-
-
-
-546.5
Stock changes
94.4
-2.2
-108.4
-16.2
Total energy supply
4,858.6
1.1
5,008.1
2,827.0
Statistical difference
-44.1
0+
-5.3
62.0
Transfers
-
-
-194.7
237.0
Transformation
-3,777.9
121.4
-4,750.6
4,075.0
- Electricity plants
-3,230.8
-
-67.1
-829.3
- CHP and heat plants
-1.1
-
-
-
- Coke ovens
-98.6
91.0
-
-
- Oil refineries
-
-
-4,382.3
4,340.6
- Other transformation
-447.3
30.4
-301.2
563.7
Energy industries own use
-501.1
-0.7
-33.9
-124.6
Losses
-
-
-34.3
-7.5
Final consumption
623.7
121.8
-
6,944.9
- Final energy consumption
567.6
121.8
-
6,550.1
- Industry
375.1
120.2
-
765.8
Iron and steel
58.1
65.5
-
0.1
Chemical and petrochem.
0.1
37.4
-
3.4
Non-ferrous metals
43.1
-
-
3.3
Non-metallic minerals
84.1
5.0
-
83.1
Other industries
189.7
12.4
-
675.9
- Transport
0.1
-
-
4,776.7
of which Road
-
-
-
4,608.3
- Households
118.0
0.1
-
610.7
- Commerce, public services
58.5
1.4
-
77.1
- Other energy use
15.9
0.1
-
319.8
- Non-energy use
56.1
-
-
394.8

2019 Energy Statistics Pocketbook
United Nations Statistics Division
45
d---
Natural
gas
Biofuels
and waste
Nuclear
Electricity
Heat
Total
of which:
renewables
10
7,357.4
14,629.6
162.3
467.6
182.9
44,744.2
15,273.3
641.1
4.5
-
151.7
-
7,876.1
4.5
-3,342.2
-14.4
-
-134.8
-
-19,241.0
-14.4
-
-
-
-
-
-546.5
-
18.0
-
-
-
-
-14.3
-
4,674.2
14,619.8
162.3
484.5
182.9
32,818.5
15,263.4
-195.8
-2.7
-
67.2
0-
-118.7
485.2
-
-
-
-
-
42.3
-
-2,638.2
-2,569.7
-162.3
2,450.4
-163.3
-7,415.1
-2,721.4
-2,481.8
-41.9
-162.3
2,446.8
-174.9
-4,541.2
-193.6
-1.5
-21.5
-
3.6
11.6
-9.0
-21.5
-
-
-
-
-
-7.6
-
-
-
-
-
-
-41.8
-
-154.9
-2,506.3
-
-
-
-2,815.5
-2,506.2
-575.3
-0.01
-
-197.5
0+
-1,433.2
-0.01
-21.1
-1.3
-
-371.4
-
-435.6
-1.3
1,635.4
12,051.4
-
2,298.8
19.6
23,695.7
12,055.5
1,280.4
12,051.4
-
2,298.8
19.6
22,889.8
12,055.5
815.4
874.6
-
916.4
11.5
3,879.1
871.5
73.2
-
-
20.4
-
217.4
-
61.8
0.4
-
51.8
-
154.9
0.1
5.8
-
-
124.3
-
176.6
-
102.9
5.7
-
36.4
-
317.2
3.0
571.7
868.5
-
683.5
11.5
3,013.1
868.4
50.2
1.4
-
20.0
-
4,848.4
1.4
11.9
1.4
-
0.1
-
4,621.8
1.4
366.2
10,299.0
-
800.0
3.0
12,196.9
10,301.0
6.5
369.8
-
389.7
0.1
903.1
369.9
42.1
506.6
-
172.7
5.1
1,062.3
511.7
355.0
-
-
-
-
805.9
-
(10) See General notes.

2019 Energy Statistics Pocketbook
United Nations Statistics Division
46
Energy balance, 2016 (Petajoules)
Northern America
Primary
coal
Coal
products
Primary
oil
Oil
products
Primary production
15,846.6
-
31,984.8
-
Imports
376.1
32.9
18,636.6
4,973.3
Exports
-2,209.0
-27.4
-8,562.0
-9,133.6
International bunkers
-
-
-
-1,771.0
Stock changes
1,003.1
17.1
-197.4
15.0
Total energy supply
15,016.8
22.5
41,862.1
-5,916.3
Statistical difference
-141.3
2.9
-72.6
-1,621.6
Transfers
-
-
-831.3
1,028.4
Transformation
-14,548.9
268.6
-40,984.1
40,901.9
- Electricity plants
-13,615.3
-3.8
-
-329.2
- CHP and heat plants
-331.4
-21.5
-
-89.7
- Coke ovens
-475.3
450.8
-
-
- Oil refineries
-
-
-38,076.5
37,905.6
- Other transformation
-126.9
-157.0
-2,907.6
3,415.2
Energy industries own use
-1.4
-48.9
-
-2,153.6
Losses
-
-
-
-0.1
Final consumption
607.8
239.4
119.3
35,481.9
- Final energy consumption
606.5
238.5
0+
29,921.0
- Industry
584.0
238.5
0+
1,096.3
Iron and steel
18.1
206.4
-
7.6
Chemical and petrochem.
111.5
-
-
130.2
Non-ferrous metals
6.9
-
-
21.4
Non-metallic minerals
208.9
1.9
-
77.5
Other industries
238.6
30.2
0+
859.7
- Transport
-
-
-
26,616.6
of which Road
-
-
-
23,138.0
- Households
0.3
-
-
677.6
- Commerce, public services
22.2
-
-
716.8
- Other energy use
-
-
-
813.7
- Non-energy use
1.3
0.9
119.3
5,560.9

2019 Energy Statistics Pocketbook
United Nations Statistics Division
47
d---
Natural
gas
Biofuels
and waste
Nuclear
Electricity
Heat
Total
of which:
renewables
10
32,378.6
4,561.2
10,163.5
3,481.5
805.1
99,221.3
8,641.0
3,623.4
161.8
-
284.1
-
28,088.0
161.8
-5,084.6
-156.1
-
-298.0
-
-25,470.8
-156.1
-
-
-
-
-
-1,771.0
-
384.9
-11.2
-
-
-
1,211.5
-11.2
31,302.2
4,555.6
10,163.5
3,467.5
805.1
101,279.0
8,635.5
417.1
0.04
-
48.8
-
-1,366.7
3,561.8
-
-
-
-
-
197.1
-
-11,254.3
-981.6
-10,163.5
14,403.7
-174.4
-22,532.5
-1,438.8
-9,179.2
-754.7
-10,163.5
13,217.6
-709.0
-21,537.1
-1,245.4
-1,813.3
-72.7
-
1,186.2
534.5
-607.9
-39.2
-
-
-
-
-
-24.5
-
-
-
-
-
-
-170.9
-
-261.7
-154.2
-
-
-
-192.2
-154.2
-3,646.4
-5.2
-
-1,322.4
-169.5
-7,347.2
-5.2
-
-
-
-1,079.8
-61.2
-1,141.1
-
15,984.4
3,568.9
-
15,420.3
399.9
71,822.0
3,629.7
15,071.4
3,568.9
-
15,420.3
399.9
65,226.6
3,629.7
5,742.9
1,256.0
-
3,476.8
242.1
12,636.6
1,230.2
383.3
0.1
-
176.3
8.1
799.9
0.1
1,996.9
10.0
-
525.8
145.4
2,919.9
1.8
184.2
0.04
-
426.9
4.3
643.7
0.04
400.9
6.7
-
157.6
0.2
853.5
0.6
2,777.6
1,239.1
-
2,190.3
84.2
7,419.6
1,227.7
879.9
1,435.8
-
63.1
-
28,995.4
1,435.8
42.9
1,423.0
-
16.6
-
24,620.5
1,423.0
4,831.2
674.3
-
5,667.8
22.6
11,873.8
696.5
3,520.6
30.8
-
5,314.7
132.6
9,737.7
93.5
96.9
171.9
-
898.0
2.6
1,983.0
173.7
913.1
-
-
-
-
6,595.5
-
(10) See General notes.

2019 Energy Statistics Pocketbook
United Nations Statistics Division
48
Energy balance, 2016 (Petajoules)
Latin America and the
Caribbean
Primary
coal
Coal
products
Primary
oil
Oil
products
Primary production
2,958.2
-
21,845.5
-
Imports
1,231.7
72.5
1,968.8
5,896.9
Exports
-2,304.8
-41.3
-10,815.1
-2,425.8
International bunkers
-
-
-
-1,153.9
Stock changes
30.2
-0.1
109.0
53.9
Total energy supply
1,915.3
31.1
13,108.3
2,371.2
Statistical difference
5.5
2.3
-36.7
-388.7
Transfers
-
-
-282.9
303.1
Transformation
-1,546.7
428.8
-12,842.3
10,742.8
- Electricity plants
-1,113.2
-21.8
-24.6
-1,699.0
- CHP and heat plants
-3.7
-
-
-27.2
- Coke ovens
-429.8
492.1
-
-70.1
- Oil refineries
-
-
-11,890.1
11,626.5
- Other transformation
-
-41.5
-927.6
912.7
Energy industries own use
-
-31.9
-18.9
-775.9
Losses
-1.2
-3.1
-0.1
-9.9
Final consumption
362.0
422.5
0.8
13,020.0
- Final energy consumption
361.8
419.9
0.8
12,005.6
- Industry
359.0
416.4
0.6
1,669.0
Iron and steel
120.2
401.4
-
18.5
Chemical and petrochem.
14.4
0.1
-
209.8
Non-ferrous metals
0.1
-
-
-
Non-metallic minerals
55.7
-
-
142.2
Other industries
168.6
15.0
0.6
1,298.6
- Transport
-
-
0.2
8,530.0
of which Road
-
-
-
8,122.4
- Households
2.8
2.3
-
855.4
- Commerce, public services
-
0.1
-
188.0
- Other energy use
0.05
1.1
-
763.2
- Non-energy use
0.1
2.6
-
1,014.3

2019 Energy Statistics Pocketbook
United Nations Statistics Division
49
d---
Natural
gas
Biofuels
and waste
Nuclear
Electricity
Heat
Total
of which:
renewables
10
7,478.3
5,873.0
374.9
2,824.2
381.1
41,735.3
9,077.3
2,517.7
32.9
-
205.9
-
11,926.5
32.9
-1,320.4
-102.0
-
-201.9
-
-17,211.2
-102.0
0
-
-
-
-
-
-1,153.9
-
8.6
-0.5
-
-
-
201.2
-0.5
8,684.3
5,803.5
374.9
2,828.2
381.1
35,497.9
9,007.7
266.9
-18.3
-
-30.5
0
+
-199.6
2,843.3
-
-121.1
-
-
-
-100.9
-121.1
-3,602.1
-1,158.4
-374.9
3,033.2
-367.7
-5,687.5
-1,487.8
-3,384.2
-807.3
-374.9
2,934.1
-367.7
-4,858.8
-1,136.7
-227.6
-195.3
-
99.1
-
-354.7
-195.3
-
-
-
-
-
-7.8
-
-
-
-
-
-
-263.6
-
9.7
-155.9
-
-
-
-202.6
-155.9
-1,649.6
-443.7
-
-275.4
-
-3,195.4
-443.7
-69.1
-5.4
-
-843.0
-
-931.7
-5.4
3,096.5
4,093.2
-
4,773.6
13.3
25,781.9
4,106.5
2,602.3
4,093.2
-
4,773.6
13.3
24,270.6
4,106.5
1,665.9
1,871.6
-
2,006.1
0.5
7,989.1
1,872.2
333.7
136.7
-
172.9
0
+
1,183.3
136.7
284.9
5.8
-
122.0
-
636.9
5.8
21.1
-
-
22.6
-
43.9
-
133.4
0.6
-
51.6
-
383.5
0.6
892.8
1,728.5
-
1,637.0
0.5
5,741.5
1,729.1
280.0
665.9
-
19.5
-
9,495.7
665.9
212.0
665.9
-
1.7
-
9,002.0
665.9
530.5
1,387.3
-
1,382.4
6.8
4,167.5
1,394.1
92.6
25.9
-
1,047.2
4.6
1,358.4
30.4
33.3
142.4
-
318.4
1.4
1,259.9
143.8
494.2
-
-
-
-
1,511.3
-
(10) See General notes.

2019 Energy Statistics Pocketbook
United Nations Statistics Division
50
Energy balance, 2016 (Petajoules)
Asia
Primary
coal
Coal
products
Primary
oil
Oil
products
Primary production
98,897.1
-
85,215.9
-
Imports
23,355.6
283.0
48,778.9
23,653.3
Exports
-11,697.8
-332.2
-49,418.0
-25,597.7
International bunkers
-
-
-
-8,079.9
Stock changes
2,624.5
439.9
-760.1
-380.8
Total energy supply
113,179.3
390.8
83,816.7
-10,405.1
Statistical difference
-1,063.5
-329.0
-96.7
-321.9
Transfers
-
-
-239.3
3,447.0
Transformation
-82,071.8
8,776.4
-82,891.4
73,612.2
- Electricity plants
-58,558.9
-1,542.4
-1,534.1
-4,133.7
- CHP and heat plants
-6,848.9
-507.6
-
-354.4
- Coke ovens
-15,438.1
17,305.6
-
-20.6
- Oil refineries
-
-
-77,087.8
77,247.4
- Other transformation
-1,225.8
-6,479.3
-4,269.5
873.6
Energy industries own use
-4,216.7
-673.8
-437.3
-3,985.1
Losses
-111.0
-5.2
-54.4
-1.7
Final consumption
27,843.3
8,817.3
291.1
62,989.2
- Final energy consumption
26,061.6
7,998.3
250.1
49,223.3
- Industry
21,316.0
7,835.5
250.1
6,721.6
Iron and steel
3,485.4
6,449.8
0.01
223.6
Chemical and petrochem.
2,053.9
367.3
118.4
1,280.2
Non-ferrous metals
36.0
9.4
0
+
146.1
Non-metallic minerals
908.8
13.5
0.1
759.3
Other industries
14,831.8
995.5
131.6
4,312.5
- Transport
82.6
0.9
-
29,798.3
of which Road
-
-
-
25,401.8
- Households
2,114.3
112.0
-
6,832.3
- Commerce, public services
204.6
15.6
-
967.6
- Other energy use
2,344.2
34.3
-
4,903.6
- Non-energy use
1,781.7
819.0
41.0
13,765.9

2019 Energy Statistics Pocketbook
United Nations Statistics Division
51
d---
Natural
gas
Biofuels
and waste
Nuclear
Electricity
Heat
Total
of which:
renewables
10
44,916.9
20,352.1
5,172.3
7,981.3
1,218.4
263,754.0
28,915.9
14,269.1
42.5
-
378.6
-
110,760.9
41.9
-11,584.3
-19.1
-
-336.0
-
-98,985.0
-19.1
-
-
-
-
-
-8,079.9
-
83.0
3.9
-
-
-
2,010.4
4.1
47,684.7
20,379.5
5,172.3
8,023.8
1,218.4
269,460.4
28,942.9
929.5
22.2
-
316.5
13.0
-529.9
8,110.1
-
-
-
-
-
3,207.7
-
-20,680.1
-3,008.7
-5,172.3
36,556.5
4,091.6
-70,787.6
-3,518.0
-18,432.7
-2,440.8
-5,172.3
35,610.9
-1,715.5
-57,919.5
-3,025.2
-1,336.4
-170.3
-
945.7
5,807.1
-2,464.9
-100.1
-
-4.8
-
-
-
1,842.0
-
-22.2
-
-
-
-
137.5
-
-888.8
-392.7
-
-
-
-12,382.6
-392.7
-4,634.4
-12.1
-
-3,604.9
-584.2
-18,148.4
-12.1
-693.6
-
-
-3,391.8
-86.6
-4,344.1
-
20,747.1
17,336.6
-
37,267.2
4,626.2
179,917.9
17,302.8
17,843.1
17,336.6
-
37,267.2
4,626.2
160,606.4
17,302.8
8,830.7
3,850.2
-
19,294.4
2,780.1
70,878.8
3,726.2
604.1
27.9
-
2,951.2
236.0
13,978.0
26.1
1,483.3
47.5
-
2,546.3
1,201.0
9,097.9
28.4
57.6
6.1
-
255.6
0.4
511.2
4.6
221.1
63.4
-
317.1
0.2
2,283.4
13.4
6,464.7
3,705.3
-
13,224.2
1,342.6
45,008.3
3,653.7
1,769.4
472.6
-
630.6
26.4
32,780.8
472.6
1,304.6
472.3
-
104.2
-
27,283.0
472.3
5,206.0
10,802.8
-
8,414.0
1,246.8
34,728.0
10,914.9
1,534.8
402.9
-
4,387.0
133.2
7,645.6
387.6
502.1
1,808.2
-
4,541.1
439.7
14,573.2
1,801.5
2,904.0
-
-
-
-
19,311.5
-
(10) See General notes.

2019 Energy Statistics Pocketbook
United Nations Statistics Division
52
Energy balance, 2016 (Petajoules)
Europe
Primary
coal
Coal
products
Primary
oil
Oil
products
Primary production
15,819.9
-
30,363.1
-
Imports
6,379.7
377.3
24,741.6
17,583.6
Exports
-5,698.5
-418.4
-15,623.3
-22,128.4
International bunkers
-
-
-
-4,510.9
Stock changes
461.6
-4.2
89.3
-26.3
Total energy supply
16,962.8
-45.3
39,570.7
-9,082.1
Statistical difference
6.1
33.4
-9.9
-111.2
Transfers
-
-
-123.7
239.2
Transformation
-15,655.3
1,559.1
-39,031.1
38,029.8
- Electricity plants
-5,656.9
-213.1
-
-320.3
- CHP and heat plants
-5,820.8
-382.8
-35.4
-702.2
- Coke ovens
-3,373.1
2,926.6
-
-15.1
- Oil refineries
-
-
-38,639.7
38,506.6
- Other transformation
-804.5
-771.7
-356.0
560.8
Energy industries own use
-76.8
-319.6
-12.7
-1,917.3
Losses
-2.6
-76.5
-298.1
-2.2
Final consumption
1,222.0
1,084.3
115.0
27,378.6
- Final energy consumption
1,186.4
1,021.1
2.0
21,770.6
- Industry
605.8
967.2
1.2
1,942.7
Iron and steel
133.3
823.8
-
38.4
Chemical and petrochem.
122.8
33.3
1.0
754.2
Non-ferrous metals
14.9
3.0
-
15.8
Non-metallic minerals
208.1
76.2
0.04
295.2
Other industries
126.7
30.8
0.1
839.1
- Transport
1.0
0.01
-
16,218.8
of which Road
-
-
-
15,249.1
- Households
429.4
48.8
-
1,839.9
- Commerce, public services
100.0
3.8
-
810.1
- Other energy use
50.3
1.3
0.8
959.2
- Non-energy use
35.5
63.2
113.0
5,608.0

2019 Energy Statistics Pocketbook
United Nations Statistics Division
53
d---
Natural
gas
Biofuels
and waste
Nuclear
Electricity
Heat
Total
of which:
renewables
10
31,483.5
7,074.2
12,321.3
4,232.7
769.1
102,063.8
11,149.4
16,507.6
723.7
-
1,610.4
0.2
67,924.3
707.5
-14,558.0
-476.4
-
-1,652.5
-0.2
-60,555.7
-475.1
-2.0
-
-
-
-
-4,512.9
-
352.9
6.0
-
-
-
879.2
6.6
33,784.0
7,327.5
12,321.3
4,190.6
769.1
105,798.7
11,388.5
-134.6
-3.7
-
35.6
13.3
-171.0
4,338.1
-
-
-
-
-
115.4
-
-14,202.7
-2,987.5
-12,321.3
13,105.6
8,011.8
-23,491.6
-2,808.7
-2,504.2
-930.2
-12,006.4
7,878.5
-365.4
-14,118.1
-1,049.1
-11,536.1
-2,026.8
-314.9
5,227.1
8,377.3
-7,214.6
-1,729.2
-1.1
-
-
-
-
-462.7
-
-
-
-
-
-
-133.1
-
-161.3
-30.4
-
-
-
-1,563.1
-30.4
-1,467.7
-39.0
-
-1,857.1
-767.5
-6,457.7
-27.8
-334.5
-1.0
-
-1,280.4
-785.8
-2,781.1
-1.0
17,913.6
4,303.7
-
14,123.2
7,214.3
73,354.7
4,212.9
15,758.9
4,303.7
-
14,123.2
7,214.3
65,380.3
4,212.9
5,054.8
1,208.2
-
5,388.9
2,661.2
17,829.8
1,011.3
921.7
19.3
-
751.5
331.7
3,019.8
0.8
1,001.5
49.5
-
888.5
852.5
3,703.3
19.1
152.6
0.6
-
694.2
17.1
898.1
0.1
947.5
164.2
-
330.7
105.1
2,127.2
50.7
2,031.5
974.5
-
2,723.9
1,354.8
8,081.4
940.5
1,460.2
597.7
-
572.3
-
18,850.0
597.7
83.5
595.7
-
7.1
-
15,935.4
595.7
6,896.9
2,130.5
-
3,957.8
3,110.7
18,413.8
2,221.4
2,099.5
264.4
-
3,903.6
1,293.7
8,475.2
273.2
247.5
103.0
-
300.5
148.7
1,811.4
109.4
2,154.7
-
-
-
-
7,974.4
-
(10) See General notes.

2019 Energy Statistics Pocketbook
United Nations Statistics Division
54
Energy balance, 2016 (Petajoules)
Oceania
Primary
coal
Coal
products
Primary
oil
Oil
products
Primary production
12,295.3
-
831.9
-
Imports
38.6
6.0
925.5
1,443.6
Exports
-10,541.1
-19.2
-564.4
-119.0
International bunkers
-
-
-
-259.2
Stock changes
155.7
-0.4
4.0
-5.5
Total energy supply
1,948.5
-13.6
1,197.0
1,059.9
Statistical difference
-10.9
-
-5.2
-23.2
Transfers
-
-
0.3
139.5
Transformation
-1,854.2
72.9
-1,199.5
1,121.8
- Electricity plants
-1,717.3
-0.5
-
-114.1
- CHP and heat plants
-21.7
-7.2
-
-1.0
- Coke ovens
-113.5
112.3
-
-
- Oil refineries
-
-
-1,123.9
1,150.9
- Other transformation
-1.6
-31.6
-75.6
85.9
Energy industries own use
-2.4
-39.3
-2.4
-179.7
Losses
-
-0.3
-
-
Final consumption
102.8
19.7
0.6
2,164.6
- Final energy consumption
96.5
19.7
0.6
1,991.0
- Industry
93.5
19.6
0.6
203.6
Iron and steel
1.0
13.4
-
0.7
Chemical and petrochem.
5.9
0.5
-
4.1
Non-ferrous metals
35.8
3.8
-
17.0
Non-metallic minerals
19.5
0.1
-
12.1
Other industries
31.2
1.8
0.6
169.6
- Transport
-
-
-
1,604.2
of which Road
-
-
-
1,364.9
- Households
0.3
0.02
-
22.1
- Commerce, public services
1.5
0.04
-
40.8
- Other energy use
1.1
0
+
-
120.4
- Non-energy use
6.3
-
-
173.6
2019 Energy Statistics Pocketbook
United Nations Statistics Division
55
d---
Natural
gas
Biofuels
and waste
Nuclear
Electricity
Heat
Total
of which:
renewables
10
3,463.9
343.5
-
229.5
305.5
17,469.6
874.6
214.6
0.01
-
-
-
2,628.3
0.01
-2,025.6
-0.1
-
-
-
-13,269.3
-0.1
-
-
-
-
-
-259.2
-
-0.9
-
-
-
-
152.9
-
1,652.1
343.5
-
229.5
305.5
6,722.3
874.5
-38.1
0.03
-
1.0
-
-76.4
257.7
-
-
-
-
-
139.8
-
-559.0
-46.1
-
892.1
-282.5
-1,854.4
-300.3
-454.2
-14.7
-
836.0
-281.5
-1,746.3
-266.8
-99.7
-30.7
-
56.1
-1.0
-105.2
-32.8
-
-
-
-
-
-1.3
-
-
-
-
-
-
26.9
-
-5.0
-0.7
-
-
-
-28.6
-0.7
-458.4
-
-
-116.6
-
-798.8
-
-0.6
-
-
-62.7
-
-63.5
-
672.3
297.5
-
941.2
23.0
4,221.7
316.6
588.5
297.5
-
941.2
23.0
3,958.0
316.6
358.1
176.3
-
348.5
4.5
1,204.7
176.9
14.9
-
-
16.8
-
46.9
-
94.0
4.2
-
15.9
-
124.6
0.5
116.2
1.9
-
149.4
-
324.3
1.9
50.8
2.5
-
17.3
-
102.3
2.5
82.2
167.7
-
149.1
4.5
606.7
172.0
11.9
6.9
-
22.8
-
1,645.8
6.9
3.9
6.9
-
-
-
1,375.6
6.9
154.9
68.3
-
266.9
15.1
527.7
83.4
59.8
2.6
-
284.2
2.8
391.8
5.4
3.7
43.4
-
18.7
0.6
187.9
44.0
83.8
-
-
-
-
263.7
-
(10) See General notes.
2019 Energy Statistics Pocketbook
United Nations Statistics Division
56
Energy indicators, 2016
Region
Total energy
supply
Energy use
(TES)
per capita
Energy intensity
Self-sufficiency
Renewable
energy
share in TFEC
Electricity
consumption
per capita
PJ
GJ
MJ/
INTL $
%
%
kWh
WORLD
567,900
76.1
5.1
100.2
16.8
2,783.5
Africa
32,819
26.8
5.9
136.3
54.6
521.2
Northern Africa
8,648
37.7
3.9
135.5
11.9
1,254.2
Sub-Saharan Africa
24,170
24.3
7.1
136.6
68.6
352.4
Americas
136,777
137.1
4.9
103.1
15.1
5,622.7
Latin America and the Caribbean
35,498
55.5
3.9
117.6
27.4
2,075.0
Northern America
101,279
282.4
5.4
98.0
10.4
11,945.1
Asia
269,460
60.4
5.1
97.9
15.4
2,319.7
Central Asia
6,394
91.6
8.6
192.6
5.2
2,126.8
Eastern Asia
153,969
93.8
5.7
65.3
10.1
4,196.3
South-eastern Asia
26,912
41.9
3.9
120.2
31.6
1,350.0
Southern Asia
53,985
29.2
4.7
82.4
26.2
801.8
Western Asia
28,201
107.3
4.4
262.8
4.1
3,677.5
Europe
105,799
142.7
4.5
96.5
14.0
5,291.1
Eastern Europe
45,269
154.6
7.1
146.4
6.6
4,159.6
Northern Europe
14,348
138.4
3.3
120.9
25.4
6,995.9
Southern Europe
15,105
99.3
3.3
30.1
18.6
4,637.4
Western Europe
31,077
161.2
3.7
44.6
15.3
6,610.1
Oceania
6,722
167.6
5.2
259.9
14.0
6,517.0
Australia and New Zealand
6,400
222.3
5.1
266.9
12.8
8,695.4
Melanesia
293
28.9
7.2
131.9
38.8
792.8
Micronesia
10
18.8
8.0
9.9
6.8
4,043.8
Polynesia
20
29.0
11.2
10.6
13.7
1,442.2

2019 Energy Statistics Pocketbook
United Nations Statistics Division
57
Country or area
Total energy
supply
Energy use (TES)
per capita
Energy intensity
Self-sufficiency
Renewable
energy
share in TFEC
Electricity
consumption
per capita
PJ
GJ
MJ/
INTL $
%
%
kWh
Afghanistan
143
4.1
2.3
48.8
20.7
126.0
Albania
92
31.5
2.8
88.8
38.6
1,741.2
Algeria
2,211
54.5
3.9
284.1
0.1
1,287.7
American Samoa
11
0.01
0.1
-
-
1.0
2,697.9
Andorra
9
116.1
-
6.2
19.3
6,357.1
Angola
655
22.7
3.8
626.0
54.6
310.2
Anguilla
2
149.3
-
0.1
0.1
6,163.6
Antigua and Barbuda
8
78.9
3.8
0
0
2,505.9
Argentina
3,621
82.6
4.4
87.8
10.2
3,009.2
Armenia
131
44.7
5.5
33.9
17.9
1,821.7
Aruba
12
13
119.6
3.3
4.1
6.7
7,525.1
Australia
5,451
225.9
5.1
299.5
9.4
8,781.1
Austria
1,396
160.2
3.6
37.1
34.6
7,099.5
Azerbaijan
598
61.5
3.8
406.0
1.9
1,811.5
Bahamas
26
65.9
2.4
1.2
1.4
5,022.6
Bahrain
557
391.0
9.0
168.7
0.2
19,472.8
Bangladesh
1,864
11.4
3.4
85.7
43.7
324.9
Barbados
17
59.0
3.5
15.4
2.8
3,326.0
Belarus
1,060
111.8
6.7
15.7
7.5
3,098.7
Belgium
2,358
207.6
4.9
27.0
9.7
7,206.0
Belize
14
37.4
4.7
58.9
30.3
1,592.9
Benin
186
17.1
8.5
56.2
50.3
105.7

2019 Energy Statistics Pocketbook
United Nations Statistics Division
58
Country or area
Total energy
supply
Energy use (TES)
per capita
Energy intensity
Self-sufficiency
Renewable
energy
share in TFEC
Electricity
consumption
per capita
PJ
GJ
MJ/
INTL $
%
%
kWh
Bermuda
12
9
146.6
2.7
6.7
2.1
9,499.6
Bhutan
66
82.5
10.0
119.6
84.8
2,518.2
Bolivia (Plurinational State of)
373
34.3
5.1
246.5
18.2
753.2
Bonaire, Sint Eustatius and Saba
5
213.6
-
2.4
2.6
4,024.9
Bosnia and Herzegovina
282
80.1
7.1
70.5
23.0
3,152.9
Botswana
92
40.8
2.6
55.1
7.3
1,546.0
Brazil
12,194
58.7
4.2
99.9
41.2
2,367.4
British Virgin Islands
3
97.5
-
0.7
1.0
5,903.3
Brunei Darussalam
124
292.6
4.1
510.9
0.3
7,625.3
Bulgaria
757
106.1
6.0
62.5
18.0
4,052.2
Burkina Faso
176
9.4
5.7
72.7
72.3
73.0
Burundi
63
6.0
8.3
89.3
89.2
20.5
Cabo Verde
9
17.3
2.8
19.3
25.2
584.7
Cambodia
317
20.1
5.8
60.2
62.7
384.0
Cameroon
388
16.5
4.9
128.8
78.6
274.1
Canada
11,527
317.6
7.4
169.6
21.4
13,080.2
Cayman Islands
12
8
128.5
2.5
0
0.01
10,318.4
Central African Republic
23
5.0
7.8
81.7
76.3
35.3
Chad
84
5.8
3.1
410.7
85.3
15.1
Chile
1,577
88.0
3.9
33.3
29.6
3,918.0
China
118,484
84.4
6.0
79.8
11.6
3,635.0
China, Hong Kong SAR
590
80.8
1.5
0
0.03
6,028.9

2019 Energy Statistics Pocketbook
United Nations Statistics Division
59
Country or area
Total energy
supply
Energy use (TES)
per capita
Energy intensity
Self-sufficiency
Renewable
energy
share in TFEC
Electricity
consumption
per capita
PJ
GJ
MJ/
INTL $
%
%
kWh
China, Macao SAR
41
67.7
0.7
3.1
4.5
8,291.9
Colombia
1,750
36.0
2.7
299.6
30.8
1,236.3
Comoros
6
7.1
5.0
49.9
41.9
50.3
Congo
112
21.9
4.2
552.2
63.4
157.0
Cook Islands
1
51.2
-
1.5
1.9
1,910.4
Costa Rica
214
44.1
2.9
50.9
37.1
2,014.5
Côte d'Ivoire
522
22.0
6.4
107.6
62.6
279.2
Croatia
353
83.7
3.9
52.4
32.4
3,631.4
Cuba
435
37.9
1.7
44.3
11.4
1,418.9
Curaçao
80
502.6
-
1.0
2.6
4,141.3
Cyprus
91
77.7
3.4
5.9
9.8
3,759.4
Czechia
1,742
164.2
5.3
65.6
14.9
5,282.3
Democratic People’s Rep. of Korea
374
14.7
3.4
238.6
22.8
498.5
Democratic Rep. of the Congo
1,240
15.7
19.6
101.3
97.0
88.9
Denmark
687
120.2
2.6
90.9
31.7
5,454.3
Djibouti
12
11
11.6
3.5
32.5
28.5
323.7
Dominica
3
36.7
3.6
7.4
10.7
1,947.8
Dominican Republic
341
32.0
2.3
5.2
7.0
1,464.1
Ecuador
630
38.4
3.7
209.8
15.9
1,433.7
Egypt
3,752
39.2
3.8
82.8
9.4
1,695.9
El Salvador
183
28.8
4.0
46.3
23.1
901.9
Equatorial Guinea
44
35.8
1.5
1,854.8
12.7
588.6

2019 Energy Statistics Pocketbook
United Nations Statistics Division
60
Country or area
Total energy
supply
Energy use (TES)
per capita
Energy intensity
Self-sufficiency
Renewable
energy
share in TFEC
Electricity
consumption
per capita
PJ
GJ
MJ/
INTL $
%
%
kWh
Eritrea
12
39
7.8
4.6
78.0
80.0
68.2
Estonia
234
178.0
6.3
83.8
27.5
5,561.4
Eswatini
43
32.3
4.2
76.4
59.8
939.7
Ethiopia
1,498
14.6
9.1
90.2
89.6
86.0
Falkland Islands (Malvinas)
1
257.5
-
14.2
5.6
6,096.2
Faroe Islands
9
187.2
-
6.2
6.3
5,933.4
Fiji
33
36.9
4.4
17.1
24.4
936.7
Finland
1,414
257.0
6.5
52.2
41.4
14,688.0
France
10,164
157.0
4.0
53.7
15.3
6,831.0
French Guiana
14
50.2
-
24.1
30.2
3,028.5
French Polynesia
12
41.7
-
7.9
11.1
2,078.5
Gabon
113
57.0
3.4
493.4
60.9
1,018.3
Gambia
14
7.0
4.5
48.1
51.3
114.5
Georgia
204
51.9
5.9
29.5
29.1
2,671.4
Germany
12,942
158.0
3.5
37.3
14.7
6,316.0
Ghana
335
11.9
3.0
100.4
38.7
404.8
Gibraltar
10
284.6
-
0
0.01
7,004.2
Greece
965
86.3
3.7
29.1
16.0
4,771.5
Greenland
9
156.2
-
17.4
15.7
7,271.9
Grenada
4
38.3
2.9
7.9
11.2
1,761.5
Guadeloupe
33
74.4
-
16.6
7.6
3,458.0
Guam
11
0.2
1.2
-
-
3.0
9,662.6

2019 Energy Statistics Pocketbook
United Nations Statistics Division
61
Country or area
Total energy
supply
Energy use (TES)
per capita
Energy intensity
Self-sufficiency
Renewable
energy
share in TFEC
Electricity
consumption
per capita
PJ
GJ
MJ/
INTL $
%
%
kWh
Guatemala
531
32.0
4.3
66.6
62.6
597.4
Guernsey
11
1
17.0
-
0
0
5,833.5
Guinea
156
12.6
6.7
74.5
75.1
113.3
Guinea-Bissau
31
17.0
11.3
83.7
86.4
20.7
Guyana
37
48.1
6.6
17.9
21.6
1,068.7
Haiti
181
16.7
10.1
77.6
75.9
38.4
Honduras
244
26.8
6.1
49.7
55.4
774.6
Hungary
1,076
110.3
4.3
44.5
15.5
3,805.7
Iceland
331
995.6
21.6
91.2
77.9
52,043.2
India
36,886
27.9
4.6
63.2
30.4
805.2
Indonesia
10,021
38.4
3.6
188.5
38.5
826.4
Iran (Islamic Republic of)
10,405
129.6
7.0
157.7
1.9
3,001.5
Iraq
2,309
62.1
3.8
418.7
0.9
1,041.1
Ireland
584
123.6
1.9
30.1
8.9
5,411.3
Isle of Man
11
1
8.5
-
75.1
4.3
4,323.1
Israel
953
116.4
3.4
36.3
3.9
6,861.6
Italy
6,334
106.5
3.0
22.2
16.3
4,810.2
Jamaica
117
40.6
5.0
7.3
10.3
1,084.2
Japan
17,845
139.7
3.7
8.3
6.1
7,572.3
Jersey
11
3
29.0
-
26.9
14.1
6,110.5
Jordan
362
38.3
4.6
2.7
2.1
1,777.1
Kazakhstan
3,335
185.4
8.0
202.0
1.9
3,663.5

2019 Energy Statistics Pocketbook
United Nations Statistics Division
62
Country or area
Total energy
supply
Energy use (TES)
per capita
Energy intensity
Self-sufficiency
Renewable
energy
share in TFEC
Electricity
consumption
per capita
PJ
GJ
MJ/
INTL $
%
%
kWh
Kenya
938
19.4
6.6
78.4
66.0
172.2
Kiribati
1
12.6
6.5
38.0
45.4
214.2
Kosovo
113
62.3
6.6
74.6
26.5
2,131.4
Kuwait
1,510
372.5
5.4
482.5
0.2
11,279.5
Kyrgyzstan
162
27.2
8.0
47.3
21.8
1,705.9
Lao People's Democratic Republic
244
36.1
5.9
109.6
51.9
689.5
Latvia
179
90.6
3.8
57.4
39.5
3,289.5
Lebanon
317
52.9
4.0
2.3
3.5
2,824.5
Lesotho
61
27.5
10.1
51.3
51.0
347.1
Liberia
97
21.0
27.9
81.2
82.9
59.6
Libya
623
98.9
6.9
202.7
2.1
2,221.4
Liechtenstein
11
3
79.2
-
32.2
62.9
10,582.5
Lithuania
299
102.6
3.7
25.9
32.0
3,352.5
Luxembourg
156
270.9
2.8
4.3
17.5
11,058.7
Madagascar
185
7.4
5.3
72.8
68.1
47.3
Malawi
82
4.5
4.2
82.6
78.5
87.2
Malaysia
3,527
113.1
4.4
107.4
5.6
4,618.0
Maldives
21
48.5
3.4
0.8
1.1
1,386.3
Mali
95
5.3
2.7
59.9
59.4
82.7
Malta
25
59.1
1.6
3.0
8.7
4,923.6
Marshall Islands
2
41.8
11.2
8.9
11.8
1,435.9
Martinique
31
80.8
-
5.7
6.2
3,754.6

2019 Energy Statistics Pocketbook
United Nations Statistics Division
63
Country or area
Total energy
supply
Energy use (TES)
per capita
Energy intensity
Self-sufficiency
Renewable
energy
share in TFEC
Electricity
consumption
per capita
PJ
GJ
MJ/
INTL $
%
%
kWh
Mauritania
52
12.2
3.4
56.4
34.6
218.9
Mauritius
67
53.1
2.7
15.9
10.1
2,027.2
Mayotte
5
21.1
-
5.9
9.9
1,224.4
Mexico
7,795
61.1
3.6
96.6
9.6
2,119.9
Micronesia (Federates States of)
2
20.6
6.3
1.5
1.6
439.0
Mongolia
294
97.1
8.5
326.3
2.4
1,798.8
Montenegro
41
64.8
4.2
68.5
43.9
4,249.0
Montserrat
0.4
81.1
-
0
0
3,493.8
Morocco
831
23.2
3.2
10.8
12.7
867.3
Mozambique
556
19.3
17.1
134.0
79.1
394.9
Myanmar
836
15.8
3.0
140.5
65.9
292.7
Namibia
83
33.3
3.4
24.1
27.9
1,576.4
Nauru
1
61.4
4.1
0.1
0.2
2,035.8
Nepal
536
18.5
8.1
78.7
80.0
169.9
Netherlands
3,060
180.2
3.8
62.9
6.4
6,218.0
New Caledonia
67
247.4
-
1.9
3.7
11,147.3
New Zealand
949
203.6
5.7
79.9
32.8
8,251.7
Nicaragua
165
26.9
5.2
54.6
48.4
543.1
Niger
96
4.6
5.1
109.4
77.0
47.2
Nigeria
6,270
33.7
6.2
159.5
82.5
136.1
Niue
0.1
61.3
-
16.9
22.1
1,884.2
North Macedonia
116
55.8
4.3
43.8
26.4
2,975.8

2019 Energy Statistics Pocketbook
United Nations Statistics Division
64
Country or area
Total energy
supply
Energy use (TES)
per capita
Energy intensity
Self-sufficiency
Renewable
energy
share in TFEC
Electricity
consumption
per capita
PJ
GJ
MJ/
INTL $
%
%
kWh
Northern Mariana Islands
11
-
-
-
-
-
5,466.8
Norway
1,136
216.3
3.4
767.2
58.8
21,627.3
Oman
1,069
241.7
6.1
316.0
0.1
6,861.2
Other Asia
4,579
194.4
-
9.9
2.9
10,037.4
Pakistan
3,597
18.6
3.8
67.8
25.6
494.4
Palau
3
144.3
10.4
0
0.02
3,297.2
Panama
169
42.0
2.0
23.3
21.7
2,171.6
Papua New Guinea
184
22.7
6.0
204.4
50.3
493.7
Paraguay
265
39.4
4.4
129.8
59.2
1,637.4
Peru
1,012
31.8
2.6
96.2
25.0
1,428.5
Philippines
2,126
20.6
2.8
52.0
27.0
717.7
Poland
4,185
109.5
4.2
66.7
11.4
3,475.2
Portugal
916
88.3
3.3
27.7
31.1
4,469.2
Puerto Rico
11
61
16.5
0.5
2.3
1.9
4,719.9
Qatar
1,763
686.0
5.8
539.9
0.1
14,450.1
Republic of Korea
11,762
231.6
6.6
18.0
2.7
10,184.1
Republic of Moldova
104
25.7
5.9
32.0
30.4
892.2
Réunion
60
69.1
-
14.8
18.0
3,113.5
Romania
1,334
67.4
3.1
78.4
24.7
2,187.1
Russian Federation
30,461
211.6
8.5
187.9
3.5
5,172.7
Rwanda
99
8.3
4.6
86.9
86.0
47.0
Saint Helena
0.2
37.2
-
10.6
14.2
2,337.1

2019 Energy Statistics Pocketbook
United Nations Statistics Division
65
Country or area
Total energy
supply
Energy use (TES)
per capita
Energy intensity
Self-sufficiency
Renewable
energy
share in TFEC
Electricity
consumption
per capita
PJ
GJ
MJ/
INTL $
%
%
kWh
Saint Kitts and Nevis
3
63.0
2.6
1.2
1.8
3,192.2
Saint Lucia
6
34.2
2.7
1.5
2.1
1,956.2
Saint Pierre and Miquelon
1
173.6
-
0.5
0.7
7,105.5
Saint Vincent and the Grenadines
3
30.4
2.9
4.8
6.3
1,313.4
Samoa
5
24.2
4.1
23.1
27.3
688.3
Sao Tome and Principe
3
13.8
4.6
38.3
39.2
343.2
Saudi Arabia
8,609
266.7
5.3
326.8
0.01
9,129.8
Senegal
180
11.7
4.9
36.6
37.5
242.3
Serbia
633
90.4
6.5
70.4
21.5
3,902.4
Seychelles
8
89.8
3.5
1.1
1.7
3,883.1
Sierra Leone
67
9.1
6.7
80.3
77.6
15.1
Singapore
910
161.9
2.0
3.0
1.5
8,648.6
Sint Maarten (Dutch part)
12
12
302.4
9.3
0
0.05
8,655.2
Slovakia
687
126.3
4.3
38.8
13.2
4,589.6
Slovenia
278
133.6
4.5
52.0
20.7
6,268.5
Solomon Islands
6
9.5
4.4
57.2
65.7
149.5
Somalia
145
10.1
-
93.8
94.7
22.0
South Africa
6,276
112.0
9.1
109.3
15.3
3,442.2
South Sudan
32
2.6
1.7
795.9
28.6
32.9
Spain
4,939
106.6
3.2
28.2
17.3
5,016.8
Sri Lanka
467
22.5
1.9
36.2
42.8
611.3
State of Palestine
77
16.0
3.6
12.4
10.1
1,104.0

2019 Energy Statistics Pocketbook
United Nations Statistics Division
66
Country or area
Total energy
supply
Energy use (TES)
per capita
Energy intensity
Self-sufficiency
Renewable
energy
share in TFEC
Electricity
consumption
per capita
PJ
GJ
MJ/
INTL $
%
%
kWh
Sudan
772
19.5
4.4
94.3
61.7
316.2
Suriname
29
52.2
3.8
134.7
19.5
3,180.9
Sweden
2,046
208.0
4.4
70.7
50.7
12,960.2
Switzerland
998
118.8
2.1
48.4
25.9
6,930.7
Syrian Arab Republic
418
22.7
11.9
42.4
1.1
712.6
Tajikistan
166
19.0
6.9
81.8
61.8
1,479.3
Thailand
5,794
84.1
5.4
56.7
25.1
2,820.8
Timor-Leste
8
6.1
0.8
1,556.3
19.2
262.2
Togo
150
19.7
14.2
77.9
68.2
155.8
Tonga
2
16.9
3.2
2.0
2.0
498.0
Trinidad and Tobago
768
562.4
19.0
183.3
0.1
7,393.6
Tunisia
460
40.3
3.7
54.7
12.4
1,365.3
Turkey
5,661
71.2
3.0
26.3
13.5
2,872.5
Turkmenistan
1,158
204.5
13.1
279.0
0.1
2,202.7
Turks and Caicos Islands
3
85.9
-
0.4
0.5
6,601.7
Tuvalu
0.1
13.2
3.8
7.4
11.8
729.9
Uganda
680
16.4
9.7
90.8
88.6
64.0
Ukraine
3,864
86.9
11.8
68.8
5.5
2,642.7
United Arab Emirates
3,428
369.8
5.5
307.6
0.1
12,290.6
United Kingdom
7,425
112.9
2.9
66.9
9.3
4,619.4
United Republic of Tanzania
1,108
19.9
8.0
89.5
86.2
99.4
United States
89,733
278.5
5.2
88.8
9.1
11,818.6

2019 Energy Statistics Pocketbook
United Nations Statistics Division
67
Country or area
Total energy
supply
Energy use (TES)
per capita
Energy intensity
Self-sufficiency
Renewable
energy
share in TFEC
Electricity
consumption
per capita
PJ
GJ
MJ/
INTL $
%
%
kWh
United States Virgin Islands
11
0.1
1.0
-
-
3.8
6,184.2
Uruguay
215
62.5
3.1
58.7
59.3
3,227.3
Uzbekistan
1,574
50.0
8.2
135.6
3.2
1,493.8
Vanuatu
3
11.4
4.0
29.5
33.7
241.5
Venezuela (Bolivarian Republic)
12
2,300
72.9
5.7
293.5
14.3
2,543.0
Viet Nam
3,006
31.8
5.4
95.8
37.4
1,689.7
Wallis and Futuna Islands
0.4
29.8
-
0
0
1,378.3
Yemen
144
5.2
3.5
45.4
4.4
146.2
Zambia
468
28.2
7.7
89.2
87.9
654.4
Zimbabwe
466
28.9
15.4
81.5
82.8
450.9
(11) Energy statistics for this country are partially covered by another country (see country notes at:
https://unstats.un.org/unsd/energy/yearbook/2016/06cn.pdf). Indicators, therefore, should be interpreted with caution.
(12) Energy intensity for this country is estimated based on the latest available GDP value.

2019 Energy Statistics Pocketbook
United Nations Statistics Division
68
General notes
Please note that all UN data are subject to the Terms and Conditions available at:
http://data.un.org/Host.aspx?Content=UNdataUse.
Data sources
Data used in this publication derive from the Energy Statistics database maintained
by the United Nations Statistics Division. For more information please refer to
https://unstats.un.org/unsd/energy/edbase.htm.
Population data used to calculate the per capita indicators are from the United
Nations Population Division and are available at: https://esa.un.org/unpd/wpp.
GDP data used to calculate energy intensity are primarily from the World Bank (GDP,
PPP, constant 2011 international $) and are available at:
https://data.worldbank.org/indicator/NY.GDP.MKTP.PP.KD. For some countries such
data were not available from the World Bank, but estimates were available from the CHELEM
database (http://www.cepii.fr/%5C/anglaisgraph/bdd/chelem/gpd/gdppresent.htm). For
these countries, namely Cuba, the Democratic People’s Republic of Korea and the Syrian
Arab Republic, the estimates from the CHELEM database were used.
Geographical notes
The assignment of countries and areas follows the United Nations publication
"Standard Country or Area Codes for Statistical Use" originally published as Series M,
No. 49 and now commonly referred to as the M49 standard. For more information
please refer to https://unstats.un.org/unsd/methodology/m49.
For a detailed description of the geographical coverage of the data please refer
to https://unstats.un.org/unsd/energy/yearbook/2016/06cn.pdf.
The designations employed and the presentation of material on the maps do not
imply the expression of any opinion whatsoever on the part of the Secretariat of the
United Nations concerning the legal status of any country, territory, city or area or
of its authorities, or concerning the delimitation of its frontiers or boundaries. Dotted
line represents approximately the Line of Control in Jammu and Kashmir agreed
upon by India and Pakistan. The final status of Jammu and Kashmir has not yet been
agreed upon by the parties. Final boundary between the Republic of Sudan and
the Republic of South Sudan has not yet been determined. A dispute exists between
the Governments of Argentina and the United Kingdom of Great Britain and
Northern Ireland concerning sovereignty over the Falkland Islands (Malvinas).
The expression Other countries (x) is used to represent all the countries that are not
shown separately in a chart and indicates that x countries have positive values.

69
2019 Energy Statistics Pocketbook
Products and flows
All the definitions of products and flows are based on the International
Recommendations for Energy Statistics (IRES) available at:
https://unstats.un.org/unsd/energy/ires. Particularly for products, the definitions
come from the Standard International Energy Product Classification (SIEC)
contained in IRES. A more concise version of these definitions can be found
in the Energy Balances publication under the chapter "Concepts and
Definitions". The Energy Balances publication is available at:
https://unstats.un.org/unsd/energy/balance.
Please note that in the present publication the product coal includes peat unless
otherwise specified; data for natural gas are expressed on an NCV basis; energy
sources (i.e. coal, oil, biofuels and waste, and electricity and heat) generally refer
to both primary and secondary products, with the exception of the chapter on
primary energy production.
Chapter: Total energy supply
International aviation and marine bunkers are recorded separately due to their
importance, e.g. for the estimation of greenhouse gas emissions. At the world level,
bunkers are classified as part of transport final consumption and they are included
in the world total energy supply; however, at the country and regional levels,
bunkers are not accounted for as final consumption because they pertain to more
than one country or region and are therefore subtracted from total energy supply.
Being excluded from regional TES, international bunkers are shown as a separate
category in charts 4 and 6 and in tables 5 and 7 to provide a complete overview
of the world total energy supply.
Total energy supply per capita is calculated by dividing total energy supply by
population.
Energy intensity is calculated by dividing total energy supply by GDP, PPP (constant
2011 international $). It corresponds to SDG indicator 7.3.1.
Chapter: Primary energy production
Energy self-sufficiency is calculated as the ratio between primary energy
production and total energy supply expressed in percentage.
At the global level, primary energy production and TES are expected to follow the
same trend, given that what is produced will be available for use. However, stock
changes and statistical imbalances between imports and exports may explain
differences in short-term movements, as it happened in 2016 when global TES
United Nations Statistics Division

70
2019 Energy Statistics Pocketbook
increased by 0.38% compared to 2015, while world primary energy production
declined by 0.35%.
The categories other primary oil (chart 27 and table 28) refer to additives and
oxygenates, and other hydrocarbons.
The category waste (chart 33 and table 34) refers to other vegetable material and
residues (vegetal waste), animal waste, industrial waste and municipal waste.
The category other biofuels (chart 33 and table 34) refers to biogasoline, biodiesel,
biogases, bio jet kerosene, bagasse, black liquor and other liquid biofuels as
defined in SIEC (for definitions, see section “Products and flows” above).
Chapter: Electricity
Electricity generation per capita is calculated by dividing electricity production by
population.
Electricity capacity is the abbreviated form for the Net Maximum Electrical
Capacity, which in turn is defined as the maximum active power that can be
supplied continuously, with all plants running, at the point of outlet (i.e., after taking
the power supplies for the station auxiliaries and allowing for the losses in those
transformers considered integral to the station). For annual data, it is considered as
measured at the end of the reference year.
Utilization of electricity capacity is calculated by dividing electricity production by
electricity capacity and then by the total number of hours in a year. It shows a
percentage of theoretical maximal utilization; since the capacity is measured on a
net basis and the production on a gross basis, there is a small upwards bias in this
utilization indicator.
The category solar, wind and other sources (Facts and figures box, chart 38 and
table 39) refers to solar, wind, geothermal, chemical heat, tide, wave and marine
and other non-specified sources.
Both the category total renewables (table 43 and 47 and chart 46) and the
category renewable sources (tables 49 and 51 and chart 50) refer to hydro, wind,
solar, geothermal, tide, wave, marine as well as thermal from combustible
renewables.
The category non-renewable sources (tables 49 and 51 and chart 50) refers to
thermal from non-renewable fuels, nuclear and other non-specified net installed
capacities.
United Nations Statistics Division

71
2019 Energy Statistics Pocketbook
Chapter: Refinery output
Refinery output refers to total refinery output as reported. Note that this number is
different from the one found in the energy balance, column Oil products and row
Oil refineries. This is due to the principles of constructing balances, where what
appears in the transformation block is the net output (output minus input). Since
refinery feedstocks are not considered primary oil, they enter as input in the same
cell as the output of all oil products and end up causing this difference.
Refinery input refers to the amount of oil (conventional crude oil, natural gas liquids,
feedstocks, other hydrocarbons, and additives and oxygenates) that has entered
the refinery process.
Refinery capacity is the theoretical maximum capacity of crude oil refineries
available for operation at the end of the reference year.
The category others (chart 62 and table 63) refers to refinery gas, ethane, LPG,
white spirit and SBP industrial spirits, lubricants, paraffin waxes, petroleum coke,
bitumen, refinery feedstocks, and other oil products not elsewhere classified. The
category gasolines refers to aviation gasoline, motor gasoline and gasoline-type jet
fuel; the category kerosenes refers to kerosene-type jet fuel and other kerosene.
Fuel quantities used in international aviation and marine bunkers are included in the
world oil supply (chart 66 and table 67); conversely, bunkers are excluded from the
oil supply for the shown countries.
The different approach adopted in treating international bunkers at the world level
as opposed to the country level determines a divergence between the world oil
supply and the sum of the country values in table 67.
Chapter: Total final consumption
Total final consumption per capita is calculated by dividing total final consumption
by population.
Total final consumption refers to the consumption of energy products by end users,
which is the last stage of energy flows captured in energy statistics. As such, TFC
excludes energy products that are transformed into secondary energy products.
For example, fuels used for electricity generation are not accounted directly in TFC,
but accounted for indirectly as final electricity consumption. For coal specifically,
more than half of TES is used as input for electricity generation worldwide.
International aviation and marine bunkers are classified as part of final consumption
at the world level but not at the country and regional levels. Not being included in
the total final consumption at the regional level, international bunkers are shown as
United Nations Statistics Division

72
2019 Energy Statistics Pocketbook
a separate category in charts 69 and 71 and in tables 70 and 72 to provide a
complete overview of world final energy consumption.
The different approach adopted in treating international bunkers at the world level
as opposed to the country level determines a divergence between the world TFC
and the sum of the country values in table 78.
The category other (chart 75 and table 76) refers to agriculture, forestry and fishing,
commerce and public services, and to other non-specified consumers. The
categories industry, transport, households and other do not include non-energy use
in these sectors.
Renewable energy share in total final energy consumption (map 77 and table 78)
refers to renewables directly consumed as energy products, as well as final
consumption of electricity and heat attributed to renewable sources, including
combustible renewables. It corresponds to SDG indicator 7.2.1.
Chapter: Energy balances
In the regional balances, the category total energy supply excludes international
aviation and marine bunkers, whereas in the world balance international bunkers
are treated as consumption for transportation purposes.
Country energy balances for 2015 and 2016 are available in the Energy Balances
publication (https://unstats.un.org/unsd/energy/balance).
Note that the figure found in the column Oil products and row Oil refineries does
not correspond to the total refinery output. This is due to the principles of
constructing balances, where what appears in the transformation block is the net
output (output minus input). Since refinery feedstocks are not considered primary
oil, they enter as input in the same cell as the output of all oil products and end up
causing this difference. For the total refinery output, the reader should refer to the
respective chapter.
The category of which: renewables follows the convention used in the Energy Balances
publication available at: https://unstats.un.org/unsd/energy/balance and therefore
includes only directly identifiable renewable energy. As a result, no part of imports and
exports of heat or electricity, nor their consumption, losses or own use, is considered
as renewable, which may lead to differences with values presented in other
chapters.
Chapter: Energy indicators
The category total energy supply excludes international aviation and marine
bunkers at the country and regional levels, as defined by the international
methodology set forth in IRES.
United Nations Statistics Division

United Nations Statistics Division
73
2019 Energy Statistics Pocketbook
Energy statistics for American Samoa, Guam, Guernsey, Isle of Man, Jersey,
Liechtenstein, Northern Mariana Islands, Puerto Rico, United States Virgin Islands are
partially covered by another country (see country notes at:
https://unstats.un.org/unsd/energy/yearbook/2016/06cn.pdf). Indicators for these
areas, therefore, should be interpreted with caution.
Energy use (TES) per capita is calculated by dividing total energy supply by
population.
Energy intensity is calculated by dividing total energy supply by GDP, PPP (constant
2011 international $). It corresponds to SDG indicator 7.3.1.
Self-sufficiency is calculated as the ratio between primary energy production and
total energy supply expressed in percentage.
Renewable energy share in total final energy consumption refers to renewables
directly consumed as energy products, as well as final consumption of electricity
and heat attributed to renewable sources, including combustible renewables. It
corresponds to SDG indicator 7.2.1.
Electricity consumption per capita is calculated by dividing electricity consumption
by population.
