Working Toward a Hep Free NYC
Hepatitis A, B and C
in New York City:
2021 Annual Report
New York City Department of Health and Mental Hygiene
2
About This Report: This report was developed by the New York City Department of Health and Mental
Hygiene and provides surveillance data and summaries of viral hepatitis program activities from
January 1, 2021, through December 31, 2021. This report is required pursuant to Local Law 43 of
2015. For additional details about the use of denominators and definitions in this report, please see
Appendix 1. For more information, email [email protected].
Prepared By: The New York City Department of Health and Mental Hygiene’s Viral Hepatitis Program
(Sarah Ahmed, MPH, CHES; Angelica Bocour, MPH; Alexis Brenes, BA; Marie P. Bresnahan, MPH;
Samantha Carpen, MPH; Diana Diaz Muñoz, MPH; Shaili Gandhi, MPH; Laura Graf, MPH; Yanting
(Kelly) Huang, MPH; Christina Hwang, MPH; Nirah Johnson, LCSW; Nadine Kela-Murphy, MPH;
Adeeba Khan, MPH; Umaima Khatun, MPH; David Mangar, MPH; Tristan McPherson, MD; Farma
Pene, MPH; Jackilyn Rivera, BS; Jessie Schwartz, RN, MPH; Versalle Shelton; Liz Tang, LMSW;
Leandra Urena, MPH; Aprielle Wills, MPH), New York City Department of Health and Mental Hygiene’s
Bureau of Alcohol and Drug Use Prevention, Care and Treatment, Bureau of Communicable Diseases
Data Unit, General Surveillance Unit, and Foodborne Unit, Bureau of Hepatitis, HIV, and Sexually
Transmitted Infections, Bureau of Immunization, and Bureau of Vital Statistics; and New York City
Health + Hospitals/Correctional Health Services.
Suggested Citation: New York City Department of Health and Mental Hygiene. Hepatitis A, B and C in
New York City: 2021 Annual Report. Long Island City, NY. 2022.
3
Table of Contents
1. Introduction
Achieving a Hep Free NYC................................................................................................................ 4
Health Inequities in Viral Hepatitis.................................................................................................. 4
NYC Viral Hepatitis Elimination Plan................................................................................................ 5
Hepatitis B in NYC: Opportunities for Elimination........................................................................... 6
Hepatitis C in NYC: Opportunities for Elimination........................................................................... 7
2. Surveillance
Hepatitis A......................................................................................................................................... 8
Acute Hepatitis B……………………………………………………………………………………………………………… 11
Chronic Hepatitis B........................................................................................................................... 12
Acute Hepatitis C……………………………………………………………………………………………………………… 18
Chronic Hepatitis C........................................................................................................................... 19
Chronic Hepatitis C and HIV Coinfection......................................................................................... 33
3. Prevention and Screening
Hepatitis A and B Vaccinations........................................................................................................ 35
Viral Hepatitis in Correctional Facilities........................................................................................... 35
Syringe Service Programs and Medications for Addiction Treatment........................................... 36
4. Health Department Tele-Navigation........................................................................................... 37
5. Community Hepatitis Navigation Programs……........................................................................ 39
Check Hep B Patient Navigation Program....................................................................................... 40
Check Hep C Patient Navigation Program....................................................................................... 41
Hep C Navigation in Syringe Service Programs.............................................................................. 42
Health Care Provider Training and Workforce Development......................................................... 44
6. Capacity Building
Hep Free NYC Community Coalitions……......................................................................................... 45
Public Education............................................................................................................................... 46
Health Department Training............................................................................................................. 48
Clinical Practice Facilitation…….…….……......................................................................................... 48
7. NYC Viral Hepatitis Elimination Plan: 2021 Update................................................................. 50
8. Publications and Presentations.................................................................................................. 52
9. References and Resources......................................................................................................... 53
10. Appendices................................................................................................................................. 54

4
Introduction: Achieving a Hep Free NYC
As of 2019, more than 300,000 people are estimated to be living with hepatitis B or C in New York
City (NYC). Without care and treatment, more than 75,000 people may progress to serious liver
disease, liver cancer or premature death. The NYC Department of Health and Mental Hygiene (Health
Department) works to improve the health of people affected by hepatitis B and C through:
Prevention,
Screening
and
Vaccinations
Reporting
and
Surveillance
Outbreak
Response
Linkage to
Care
Health Care
Capacity
Building
Community
Engagement
and Public
Education
Research
and
Publication
Health Inequities in Viral Hepatitis
Not all New Yorkers have equitable access to viral hepatitis prevention and medical care. The Health
Department takes a health equity approach in monitoring and responding to the viral hepatitis
epidemic in NYC. The table below lists some of the priority groups for hepatitis B and C prevention,
testing, and treatment due to structural barriers they face. All groups face challenges accessing
health care due to structural racism, stigma or discrimination. Having low income due to historical
exclusion from resources and opportunities is yet another barrier for priority groups. Though not
exhaustive, this table gives context for current data trends.
Hepatitis B
Priority groups
Barriers to prevention
Barriers to testing and treatment
People born outside
of the United States
(U.S.)
Many New Yorkers born outside of
the U.S. with hepatitis B received
limited or no hepatitis B preventive
care in their countries of birth.
Many New Yorkers born outside of
the U.S. have limited or no health
insurance.
Newborns of
people living with
hepatitis B
In NYC, complete hepatitis B vaccination and testing of newborns is not
universal across all health care facilities.
People of color
Structural racism and cultural and linguistic barriers impacting quality of
care are among many barriers for people of color in accessing viral
hepatitis health care services.
Hepatitis C
Priority groups*
Barriers to prevention
Barriers to testing and treatment
People who use
drugs
Criminalization of drug use and
stigma of harm reduction are
barriers to prevention.
Institutional discrimination (including
in health care settings) against
people who use drugs deters health
care access.

›› Introduction: Achieving a Hep Free NYC
5
People
experiencing
homelessness
Lack of affordable housing in NYC
drives homelessness, which
increases barriers in accessing
prevention and care.
Limited to no health insurance and
institutional discrimination are
among several barriers to health
care access.
People with
criminal justice
involvement
People with criminal justice involvement have limited access to health care
during incarceration and can have issues accessing health insurance after
incarceration.
Men who have sex
with men (MSM)
Institutional discrimination (including in health care settings) against MSM
are among several strong barriers to health care access.
People of color
Structural racism and cultural and linguistic barriers impacting quality of
care are among many barriers for people of color in accessing viral
hepatitis health care services.
*Hepatitis C priority groups are also priority groups for hepatitis A and B prevention.
NYC Viral Hepatitis Elimination Plan
Recognizing the need for structural changes to effectively eliminate viral hepatitis in NYC, the Health
Department worked with community stakeholders from 2020 to 2021 to develop a set of coordinated
strategies to reduce the number of hepatitis C infections, improve the health of people living with
hepatitis B and C, and reduce health inequities related to viral hepatitis infection.
In 2021, the Health Department released the Plan to Eliminate Viral Hepatitis as a Major Public
Health Threat in NYC by 2030 (NYC Viral Hepatitis Elimination Plan). This plan proposes three goals:
1. Reduce new hepatitis C infections among people in NYC by 90% by 2030.
2. Reduce premature deaths among people with chronic hepatitis B and chronic hepatitis C in NYC
by 65% by 2030; Improve the health of people living with hepatitis B and C in NYC.
3. Reduce health inequities related to viral hepatitis infection among people in NYC.
To achieve these goals, the NYC Viral Hepatitis Elimination Plan proposes more than 70 strategies
across four key activities: awareness, education, and prevention; testing and linkage to care;
treatment; and surveillance. These strategies aim to increase the availability, accessibility,
acceptability, and quality of each activity to achieve elimination goals.
›› Read the NYC Viral Hepatitis Elimination Plan at
www1.nyc.gov/assets/doh/downloads/pdf/cd/viral-hepatitis-elimination-plan.pdf.
During the NYC Viral Hepatitis Elimination Plan implementation period (2022 to 2030), the Health
Department will assess and annually report NYC’s progress implementing the strategies. See page
50 for the 2021 update.
Opportunities for Elimination
The data provided in this annual report highlight additional opportunities for enhancing existing
interventions to accelerate progress toward viral hepatitis elimination. This information is provided
on pages 6 and 7.

6
Hepatitis B in NYC: Opportunities for Elimination
As of 2019, about 243,000 people are living with hepatitis B in NYC. While the annual number of
newly reported infections has declined since 2016, more efforts are needed to prevent new
infections, improve outcomes, and reduce health disparities in people affected by hepatitis B.
What’s Working
Patient navigation and care coordination programs support hepatitis B testing, treatment and
prevention in populations at high risk for hepatitis B in NYC.
Testing
92%
Percentage of infants born to pregnant
people living with hepatitis B in NYC in
2020 who were tested for hepatitis B
Hepatitis B testing of infants born to
people living with hepatitis B supports
treatment and prevention.
Treatment
95%
Percentage of Check Hep B program
1
participants who are eligible for hepatitis
B treatment and started treatment any
time between July 2014 and June 2021
Dedicated patient navigation
programs support treatment initiation
in people living with hepatitis B who
need treatment.
Prevention
96%
Percentage of infants born to pregnant
people living with hepatitis B in NYC in
2020 who were given hepatitis B
postexposure prophylaxis and vaccination
Monitoring and care coordination of
pregnant people living with hepatitis B
supports prevention of perinatal
transmission.
Opportunities for Elimination
The NYC Viral Hepatitis Elimination Plan recommends testing, treatment, and prevention to improve
health outcomes and address health disparities in people living with hepatitis B in NYC.
Testing
57%
Percentage of Check Hep B program
participants
1
at risk for hepatitis B
infection who were screened in 2018
The NYC Viral Hepatitis Elimination
Plan proposes a hepatitis B screening
goal of 90% by 2030.
Treatment
73%
Percentage of Health Department tele-
navigation program participants linked to
hepatitis B medical care who were virally
suppressed
2
in 2021
The NYC Viral Hepatitis Elimination
Plan proposes a hepatitis B viral
suppression goal of 80% by 2030 for
people eligible for treatment.
Prevention
75%
Percentage of infants born in 2021 who
received the hepatitis B vaccine birth
dose within three days after birth
All newborns should receive the
hepatitis B vaccine birth dose within 24
hours after birth.
1
NYC Health Department Viral Hepatitis Program-contracted navigation programs (see pages 39 to
43 for more information).
2
Viral suppression is the goal of hepatitis B treatment to minimize negative health outcomes.

7
Hepatitis C in NYC: Opportunities for Elimination
As of 2019, about 86,000 people are living with hepatitis C in NYC. While the number of newly
reported infections has declined since 2014, more efforts are needed to prevent new infections,
improve outcomes and reduce health disparities in people affected by hepatitis C.
What’s Working
Peer and patient navigation programs support hepatitis C testing, treatment and prevention in
populations at high risk for hepatitis C in NYC.
Testing
92%
Percentage of people ever infected with
hepatitis C
3
who completed viral
diagnostic (hepatitis C RNA) testing
Percentage of hepatitis C confirmatory
testing is high in NYC, mainly because
of mandatory RNA reflex testing.
Treatment
66%
Percentage of people with a positive viral
diagnostic test who have been cured or
cleared of the virus
More people in NYC are being cured of
hepatitis C.
Prevention
11,516
Number of peer navigation
program
4
participants who received
prevention services any time
between July 2014 and June 2021
Expansion of hepatitis C peer
navigation in syringe service programs
(SSPs) can support hepatitis C
prevention.
Opportunities for Elimination
The NYC Viral Hepatitis Elimination Plan recommends testing, treatment, and prevention to improve
health outcomes and address health disparities in people living with hepatitis C in NYC.
Testing
42%
Percentage of hepatitis C
contracted program
4
participants
screened in 2018
The NYC Viral Hepatitis Elimination Plan
proposes a hepatitis C screening goal of
90% by 2030.
Treatment
26%
Percentage of people reported with
a viral diagnostic test in 2021 who
initiated treatment
The NYC Viral Hepatitis Elimination Plan
proposes a goal of 80% of people cured
within one year of diagnosis by 2030.
Prevention
22%
Percentage of hepatitis C peer
navigation program participants at
SSPs who received treatment
4
Connecting people to harm reduction
services and treatment can prevent further
transmission of hepatitis C.
3
From July 2014 to December 2021
4
NYC Health Department Viral Hepatitis Program-contracted navigation programs (see pages 39 to
43 for more information)
›› Surveillance
8
Surveillance
Each year, the Health Department monitors the number of people with newly reported hepatitis A, B,
and C infections in NYC. The Health Department uses these data to describe trends over time and
across groups, prevent new infections, and promote linkage to care and treatment. For more
information, see the surveillance technical notes in Appendix 1.
Hepatitis A
5
89
Number of
people reported
with hepatitis A in
NYC in 2021
+112%
Percentage
change from
2020
1.1
Rate per
100,000 people
in NYC in 2021
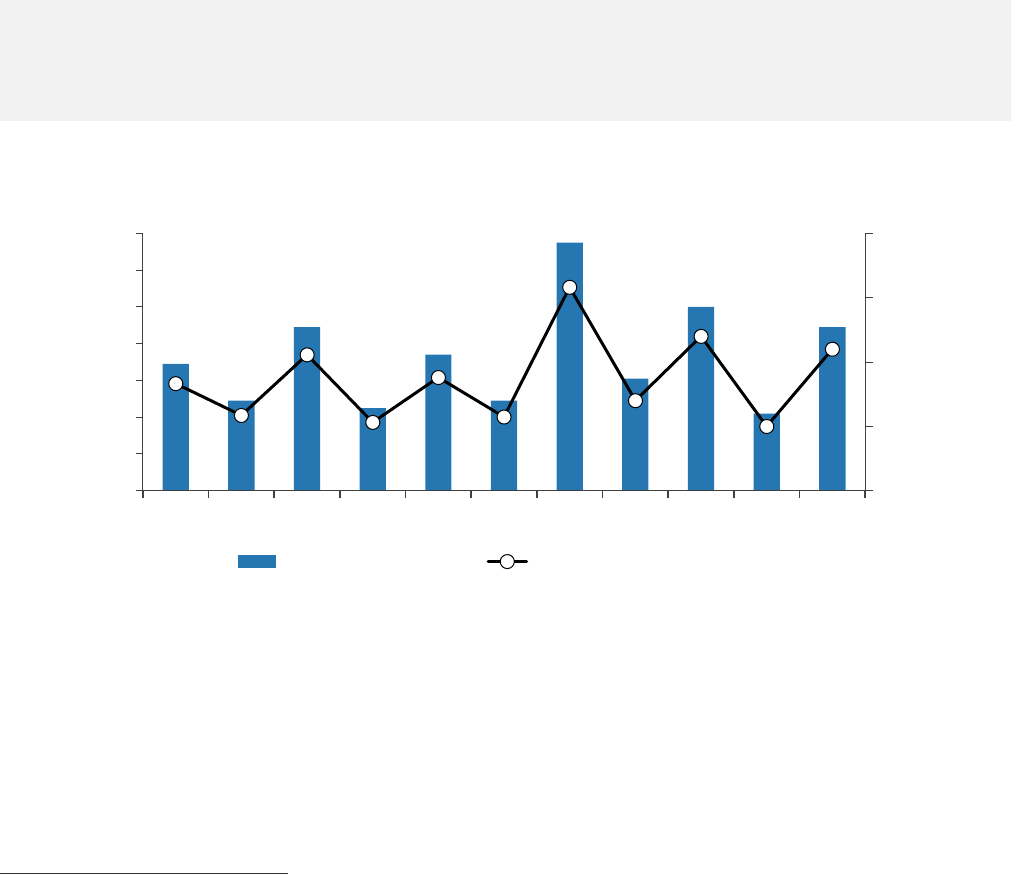
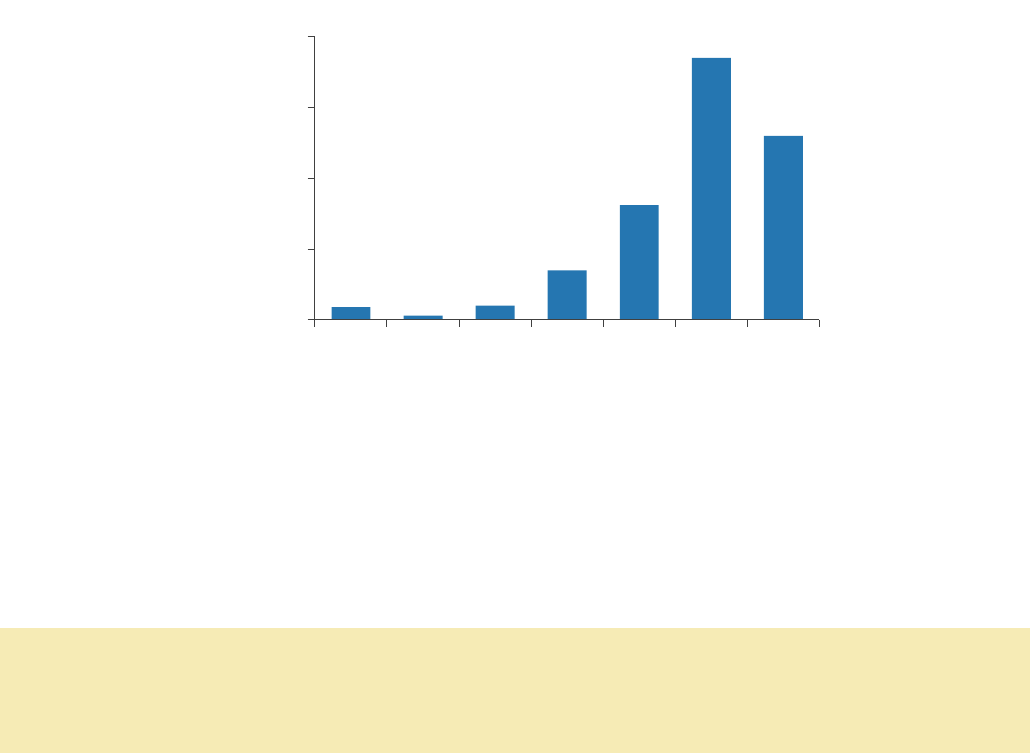
Figure 1. Number and rate of people reported with hepatitis A
6
in NYC by year of diagnosis, 2011–
2021
In 2011 and 2012, with the availability of hepatitis A vaccine and universal childhood vaccine
recommendations, the number of reported hepatitis A infections declined in NYC. Increases in
infections since 2013 were related to food handlers (2013), local clusters associated with
restaurants and social networks (2015), or outbreaks among MSM (2017,
7
2019). The decrease in
reported cases in 2020 was likely a result of less international travel, less close person-to-person
contact, and changes in health care-seeking behavior during the first year of the COVID-19 pandemic.
From late December 2020 through 2021, NYC received increasing reports of hepatitis A infections
5
All data as of April 11, 2022
6
Case definition for acute hepatitis A: discrete onset of symptoms consistent with hepatitis A
infection, positive anti-hepatitis A virus IgM or hepatitis A RNA nucleic acid amplification test, either
jaundice or elevated total bilirubin levels or elevated serum alanine aminotransferase levels, and
the absence of a more likely diagnosis.
7
For more information, visit dx.doi.org/10.15585/mmwr.mm6637a7
69
49
89
45
74
49
135
61
100
42
89
0.0
0.5
1.0
1.5
2.0
0
20
40
60
80
100
120
140
2011 2012 2013 2014 2015 2016 2017 2018 2019 2020 2021
Rate per 100,000 people
Number of people
Number of people Rate per 100,000 people
›› Surveillance
9
among people who use drugs and people experiencing homelessness, populations affected by
ongoing outbreaks of hepatitis A nationwide.
8
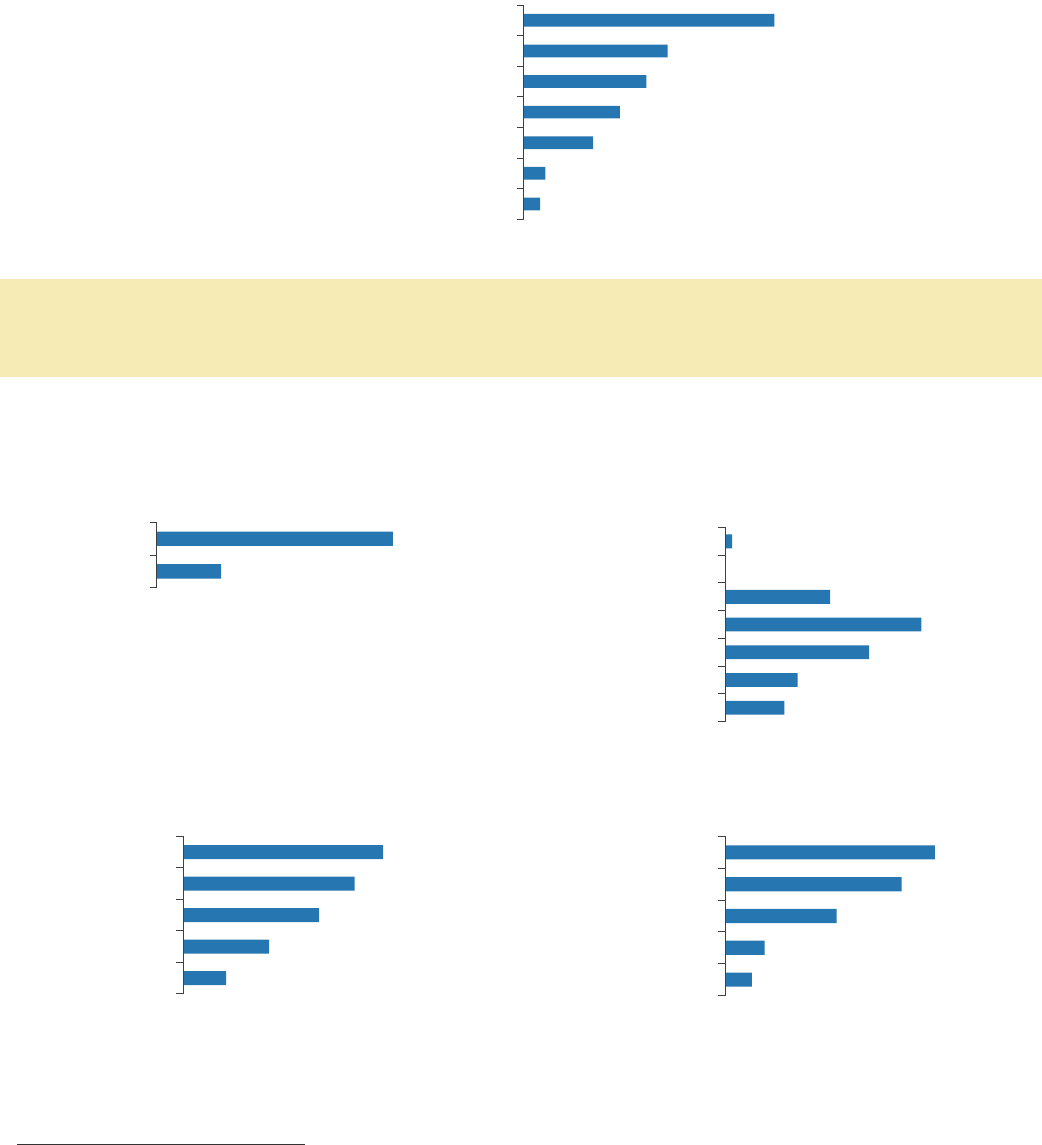
Figure 2. Percentage of people reported with hepatitis A in NYC by reported risk factors,
9
2021
*Within six months before diagnosis
Health Department Requirement
• Health care providers in NYC are required to report hepatitis A cases within 24 hours or in some
cases immediately. For more information on reporting hepatitis A cases, see Appendix 2.
Figure 3. Percentage of people reported with hepatitis A in NYC by sex, age, race and ethnicity, and
borough, 2021
Sex Age
*Greater than or equal to 60
Borough Race and ethnicity
10
›› For full data, see Appendix 3.
8
For more information, visit cdc.gov/hepatitis/outbreaks/2017March-HepatitisA.htm
9
Not mutually exclusive
10
3.4% of people had unknown race and ethnicity.
3.4
4.5
14.6
20.2
25.8
30.3
52.8
Incarceration*
Contact with a person with hepatitis A
International travel
MSM
Unknown
Homelessness
Drug use
21.4
78.7
Female
Male
1.1
0.0
18.0
33.7
24.7
12.4
10.1
0–9
10–19
20–29
30–39
40–49
50–59
≥ 60*
6.7
13.5
21.4
27. 0
31.5
Staten Island
Bronx
Queens
Manhattan
Brooklyn
4.5
6.7
19.1
30.3
36.0
Other
Asian, non-Latino/a
Black, non-Latino/a
White, non-Latino/a
Latino/a

›› Surveillance
10
Health Department Recommendations
Health care providers should administer two doses of single-antigen hepatitis A vaccine at least six
months apart to children beginning at age 1, as well as to the following groups:
• MSM
• Travelers to countries with high rates of hepatitis A, including countries in the Caribbean,
Central and South America, Africa, Eastern Europe, and parts of Asia
• People with chronic liver disease, including hepatitis B and C
• People who use drugs (injection and non-injection)
• People experiencing homelessness, including those who live on the street, live in a shelter,
access homeless services or otherwise do not have a permanent address
• People with HIV infection
For more information, read the full Centers for Disease Control and Prevention (CDC)
recommendations at cdc.gov/hepatitis/hav/havfaq.htm#vaccine. People with limited or no health
insurance can receive low- or no-cost hepatitis A vaccines at the Health Department’s Immunization
Clinic. For more information, visit nyc.gov/health/clinics.
Hepatitis A transmission has continued during the COVID-19 pandemic. Current CDC guidance allows
for administration of COVID-19 vaccines and other vaccines, such as hepatitis A vaccine, without
regard to timing, including vaccine co-administration (at the same time).
11
11
For more information, visit
cdc.gov/vaccines/covid-19/clinical-considerations/interim-considerations-us.html.

›› Surveillance
11
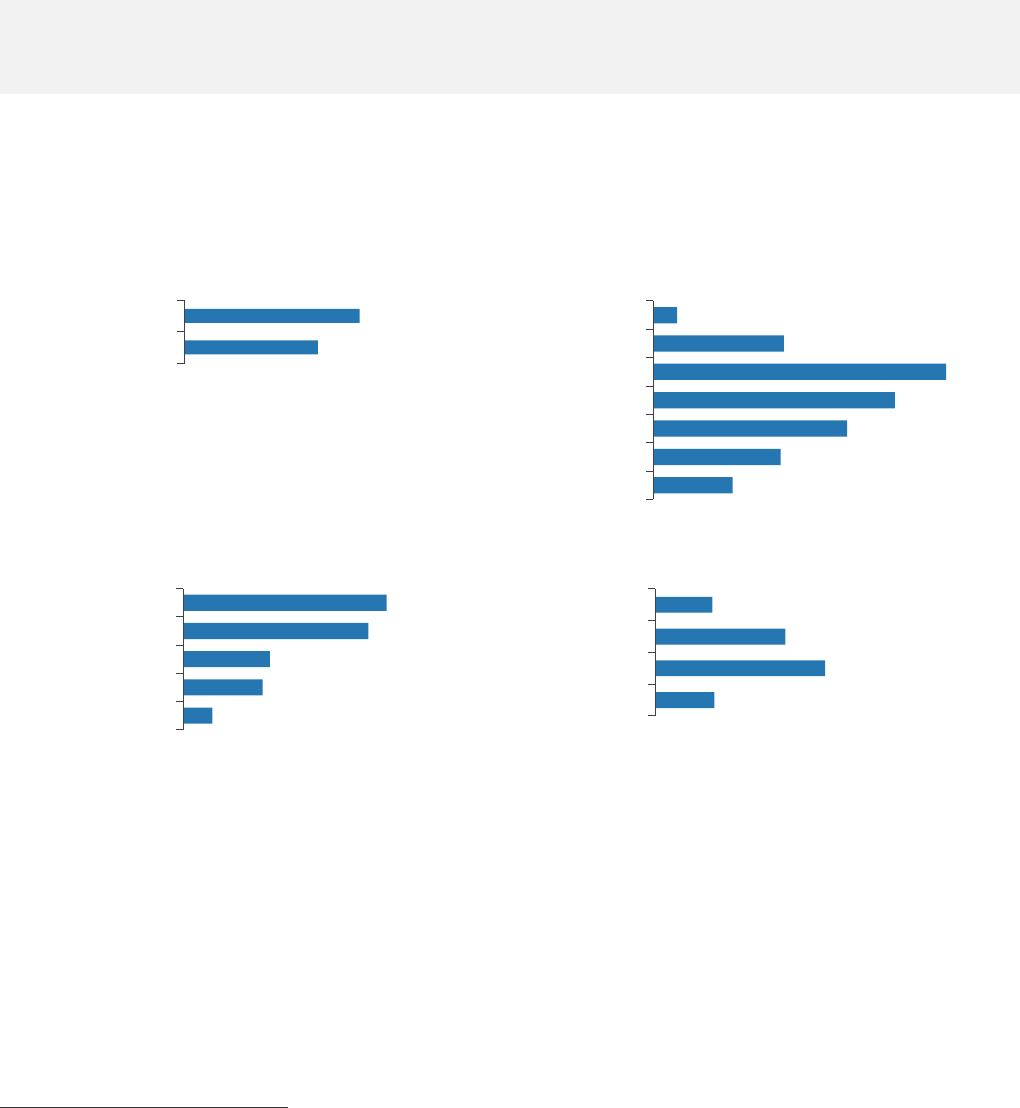
3 (6.8%)
0 (0.0%)
3 (6.8%)
6 (13.6%)
2 (4.6%)
1 (2.3%)
29 (65.9%)
Injection drug use
Household contact
MSM
Heterosexual contact
Health care-related exposure
Other
Unknown
Acute Hepatitis B
44
Number of people reported with
acute hepatitis B in NYC in 2021
0.5
Rate per 100,000 people in NYC
in 2021
Monitoring acute (initial infection or the six-month period following exposure to the virus) hepatitis B
infections helps to determine where new infections occur, who is infected, and how to implement
effective prevention activities.
›› For information on mandatory reporting of acute hepatitis B cases, see Appendix 2.
Figure 4. Number and percentage of people reported with acute hepatitis B in NYC by age, 2021
Sexual transmission was the most common reported risk factor for acute hepatitis B infection among
those with a known risk.
Figure 5. Number and percentage of people reported with acute hepatitis B infection in NYC by
reported risk factors,
12
2021
›› For full data, see Appendix 4.
Health Department Recommendations
• Health care providers should offer postexposure prophylaxis (PEP) to people exposed to hepatitis
B (for example, through sex, sharing drug use equipment or blood exposure) to prevent infection.
For more guidance, visit cdc.gov/hepatitis/hbv/pep.htm.
• Health care providers should offer the hepatitis B vaccine to all adults ages 19 to 59 years and
adults 60 years or older with risk factors for hepatitis B or without identified risk factors but
seeking protection, as recommended by the Advisory Committee on Immunization Practices. For
more guidance, visit cdc.gov/hepatitis/hbv/vaccadults.htm.
12
Mutually exclusive. Each patient is represented by the risk factor that poses the highest risk of
hepatitis B infection. For example, a person who injected drugs and had a health care-related
exposure is represented only once in the injection drug use category.
0 (0.0%)
3 (6.8%)
8 (18.2%)
14 (31.8%)
6 (13.6%)
13 (29.5%)
0–19
20–29
30–39
40–49
50–59
≥ 60
Age

›› Surveillance
12
Number of people newly reported with chronic hepatitis B
Rate per 100,000 people
Chronic Hepatitis B
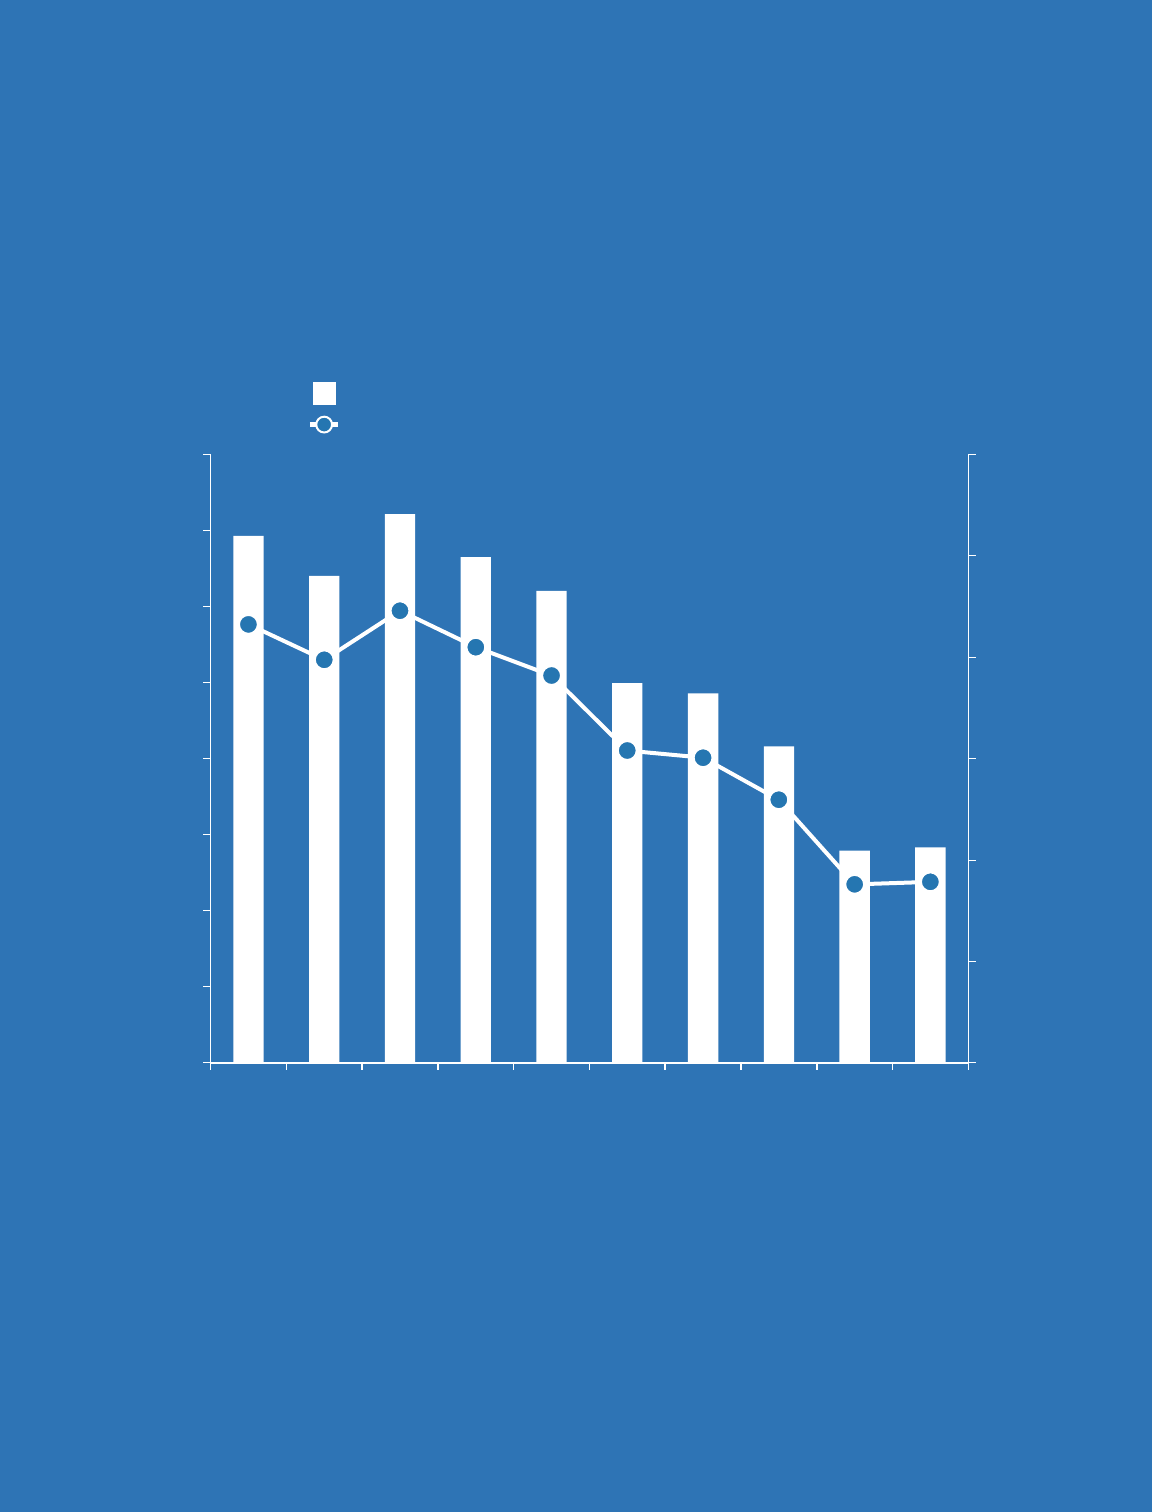
New reports of chronic hepatitis B have declined since 2016. During 2020, the lowest number of
cases were reported since hepatitis B case reporting began in NYC, because fewer people accessed
health care services during the COVID-19 pandemic and therefore fewer people were screened.
However, in 2021, there was an increase in new reports to almost the same level as in 2019.
Figure 6. Number and rate of people newly reported with chronic hepatitis B in NYC by year of first
report, 2012–2021
›› In NYC, there are many programs that provide supportive services and no- or low-cost hepatitis B
care and treatment. For more information, visit nyc.gov/health and search for hepatitis B.
7,344
7,081
7,395
7,594
8,328
7,189
6,101
5,930
3,998
5,346
0
20
40
60
80
100
120
0
1,000
2,000
3,000
4,000
5,000
6,000
7,000
8,000
9,000
2012 2013 2014 2015 2016 2017 2018 2019 2020 2021
Rate per 100,000 people
Number of people newly reported with hepatitis B
Year of first report
›› Surveillance
13
Chronic Hepatitis B
As of 2019, the Health Department estimates that 243,000 people (2.9% of NYC residents) are living
with chronic hepatitis B in NYC.
13
5,346
Number of people newly
reported with chronic
hepatitis B in NYC in 2021
64.8
Rate of newly reported
chronic hepatitis B per
100,000 people in NYC in 2021
Characteristics of People Newly Reported With Chronic Hepatitis B
Figure 7. Percentage of people newly reported with chronic hepatitis B in NYC by sex, age, borough,
and neighborhood poverty level, 2021
14
Sex Age
Borough Neighborhood poverty level
›› For full data, see Appendix 5.
13
Estimate as of 2017. Learn about the methods the Health Department uses to calculate the
hepatitis B prevalence estimate at journals.sagepub.com/doi/full/10.1177/0033354919882962.
14
Unknown responses are not presented in the charts.
43.2
56.7
Female
Male
13.7
39.2
30.0
13.2
Low
Medium
High
Very high
2.2
12.0
26.9
22.2
17. 8
11.7
7.3
0–19
20–29
30–39
40–49
50–59
60–69
≥ 70
4.8
13.1
14.3
30.5
33.5
Staten Island
Manhattan
Bronx
Queens
Brooklyn
›› Surveillance
14
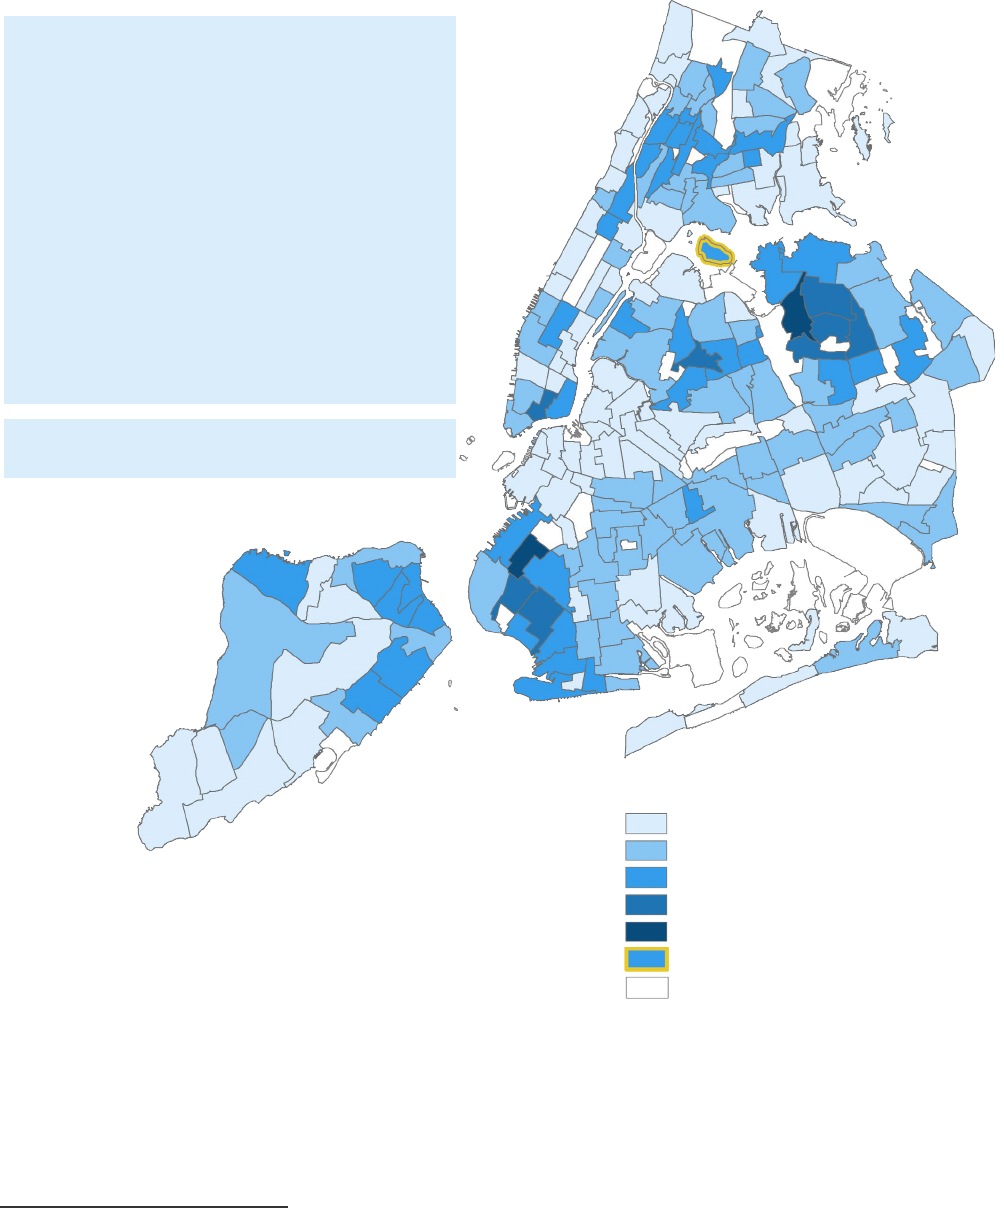
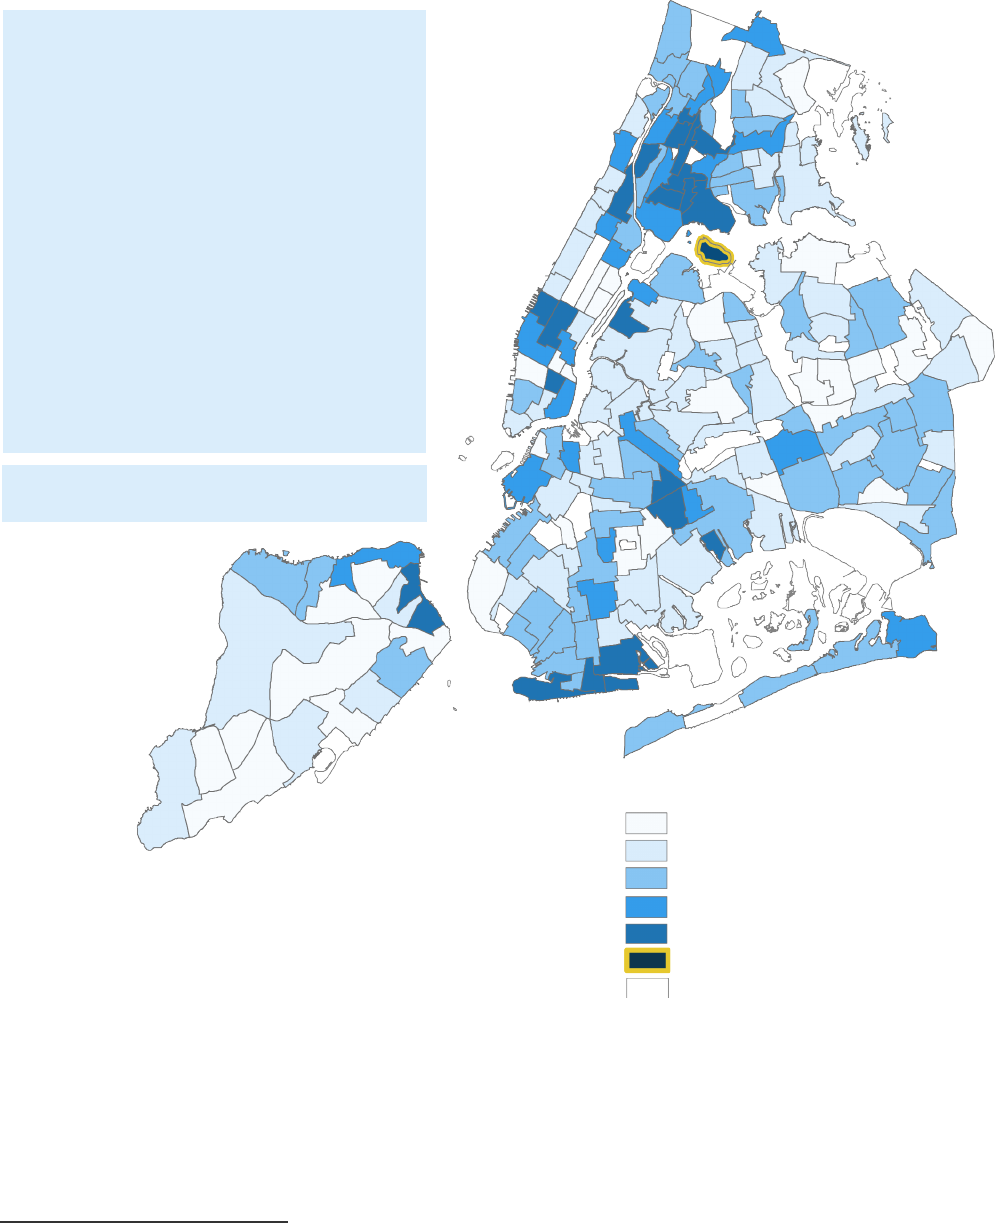
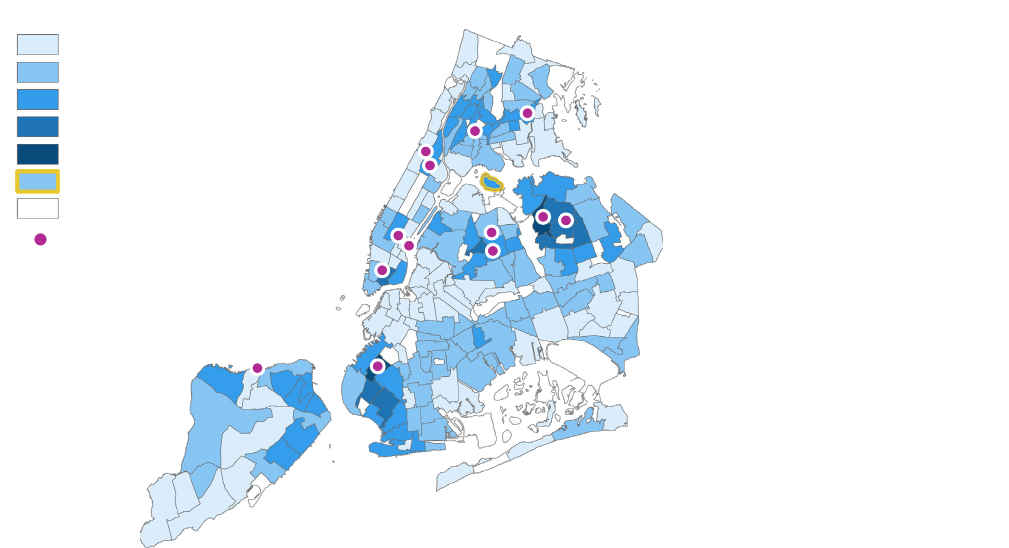
Chronic Hepatitis B: Geographic Distribution
Figure 8. Rate of people newly reported with chronic hepatitis B in NYC by neighborhood tabulation
area (NTA), 2021
15
››
For full data and map of NTAs, see Appendices 6 and 7.
15
NTAs could not be determined for 290 people (5.4%) based on their address at first report.
NYC rate: 64.8
Neighborhoods with the highest rates of
people newly reported with chronic
hepatitis B (per 100,000 people):
1. Sunset Park East, Brooklyn (600.7)
2. Flushing, Queens (400.1)
3. East Flushing, Queens (283.6)
4. Queensboro Hill, Queens (275.2)
5. Dyker Heights, Brooklyn (201.3)
6. Chinatown, Manhattan (191.4)
7. Auburndale, Queens (176.0)
8. Bensonhurst West, Brooklyn (173.4)
9. Murray Hill, Queens (165.3)
10. Elmhurst-Maspeth, Queens (153.3)
3.0–37.7
37.7–66.9
66.9–136.3
136.3–283.6
283.6–600.7
82.7 (Rikers Island)
Non-residential areas
Annual rate per 100,000 people
›› Surveillance
15
Perinatal Hepatitis B
Pregnant People Living With Chronic Hepatitis B Who Delivered a Live Infant in 2021
Hepatitis B can be transmitted from a pregnant person with hepatitis B to an infant during and after
delivery. The Health Department tracks and provides case management services to pregnant people
living with hepatitis B to prevent perinatal transmission.
676
Number of pregnant people
living with hepatitis B in
NYC in 2021
95%
Percentage of pregnant people
living with hepatitis B in NYC
in 2021 who were born
outside of the U.S.
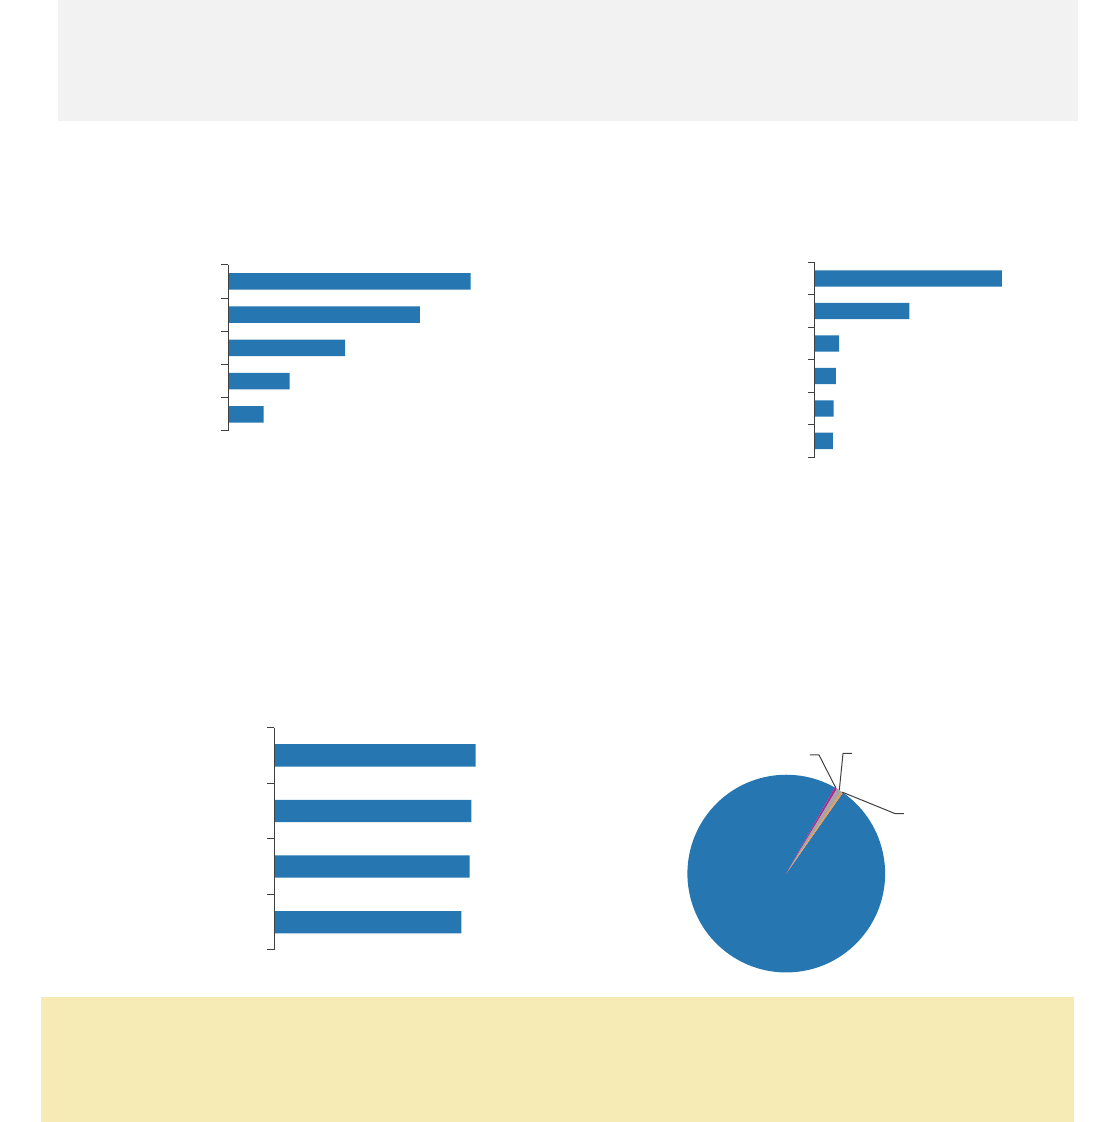
Figure 9. Percentage of people living with hepatitis B who delivered a live infant in NYC by borough
and region of birth, 2021
Borough Region of birth
›› For full data, see Appendix 8.
Hepatitis B Vaccination, Prophylaxis, and Testing at Birth for Infants Born in 2020
In 2020, 766 infants were born to a pregnant person with hepatitis B infection (see Appendix 9).
Figure 10. Percentage of infants born to pregnant
people living with hepatitis B who received
hepatitis B PEP, vaccination and testing, 2020
Health Department Recommendation
• Health care providers should administer PEP (including hepatitis B immune globulin and
hepatitis B vaccine) within 12 hours after birth to all infants born to pregnant people living with
hepatitis B. For more information, visit cdc.gov/hepatitis/hbv/perinatalxmtn.htm.
›› For full data, see Appendix 9.
37.4
29.6
18.1
9.5
5.5
Brooklyn
Queens
Bronx
Manhattan
Staten Island
Figure 11. Test results of infants born to
pregnant people living with hepatitis B in
NYC, 2020
99.1
97.0
96.2
92.0
Given PEP
Completed vaccine
series
Given PEP and
vaccinated
Tested
Immune,
98.4%
Susceptible, 0.4%
Indeterminate, 0.9%
Infected, 0.3%
44.5
22.5
5.8
5.0
4.4
4.3
China
Western Africa
West and Central Asia
U.S.
Caribbean
South Asia
›› Surveillance
16
0.4
1.6
Female
Male
0.2
1.6
3.9
4.4
25–44
45–64
65–84
≥ 85
2.6
0.9
0.7
0.4
Asian or Pacific Islander, non-Latino/a
Black, non-Latino/a
Latino/a
White, non-Latino/a
Hepatitis B Vaccination at Birth
To protect against hepatitis B infection, the CDC recommends hepatitis B vaccination of all infants at
birth (known as “the birth dose”).
16
In 2021, there were 99,007 infants born in NYC.
69.8%
Percentage of infants
born in NYC in 2021 who
received the birth dose within
one day after birth
75.4%
Percentage of infants
born in NYC in 2021 who
received the birth dose within
three days after birth
Health Department Recommendations
Health care providers should:
• Administer the hepatitis B vaccine to all infants within 24 hours after birth, followed by two or
three additional doses for completion of the hepatitis B vaccine series.
• Ensure that all children complete the full hepatitis B vaccine series.
• Test infants born to pregnant people living with hepatitis B for hepatitis B immunity and infection
between 9 and 12 months of age.
• To prevent transmission to infants and children, screen and immunize all household, needle-
sharing, and sexual contacts of people living with chronic hepatitis B for hepatitis B.
›› For more information, go to nyc.gov/health and search for perinatal hepatitis B.
Hepatitis B: Deaths
90
Number of deaths reported
as caused by hepatitis B
in NYC in 2020
0.9
Rate per 100,000 people
in NYC in 2020
Figure 12. Age-adjusted or age-specific death rate per 100,000 people
17
among NYC residents where
hepatitis B is listed as the cause of death in 2020, by sex, age, and race and ethnicity
Sex Age
Race and ethnicity
›› For full data, see Appendix 10.
16
The CDC universal hepatitis B birth dose recommendation is to administer hepatitis B vaccine
within 24 hours after birth to all medically stable infants weighing ≥ 2,000 grams.
17
The population used in the rate constructions are based on the 2020 Census population
estimates, 2021 vintage. However, the 2020 Census counts are substantially higher than the
estimates, rendering potentially overestimated rates.
›› Surveillance
17
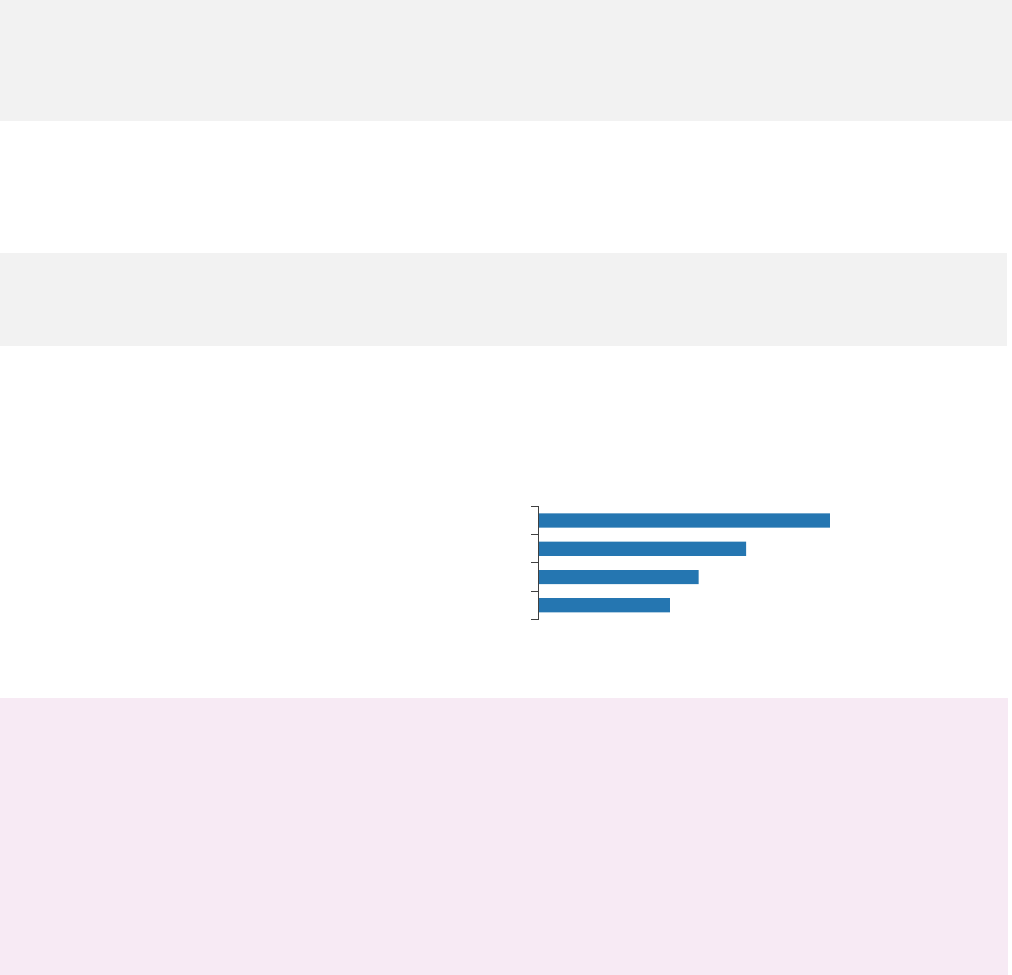
Leading Causes of Death Among Decedents With Hepatitis B
In 2021, the Health Department analyzed the leading causes of death among 1,613 decedents
(people who had died) with hepatitis B in 2020. For full data, see Appendix 11.
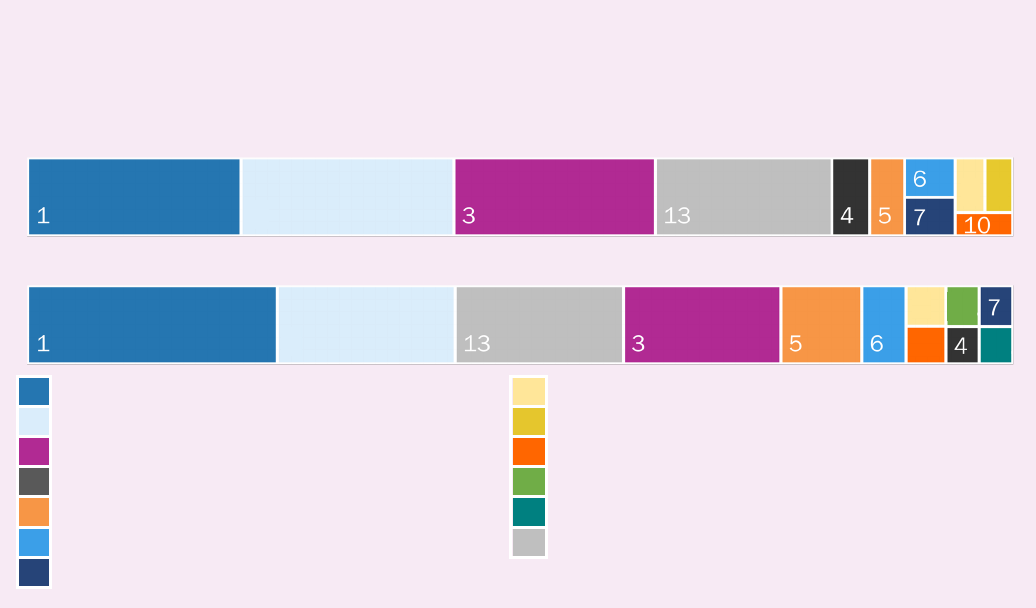
Leading causes of death, all decedents with hepatitis B, 2020
Leading causes of death, premature decedents with hepatitis B, 2020
1. Cancer (malignant neoplasms)
8. Cerebrovascular disease
2. COVID-19
9. Essential hypertension and renal diseases
3. Heart diseases
10. Viral hepatitis
4. Diabetes
11. Accidents except drug poisoning
5. Drug-related
12. Chronic liver disease and cirrhosis
6. HIV
13. All other causes
7. Influenza and pneumonia
2
8
9
2
8
10
11
12
›› Surveillance
18
Acute Hepatitis C
Monitoring acute (initial infection or the six-month period following exposure to the virus) hepatitis C
infections helps to determine where new infections occur, who is infected and how to implement
effective prevention activities. The Health Department identifies acute infections from provider
reports and during enhanced surveillance. In 2020 and 2021, the Health Department conducted
enhanced surveillance investigations for newly reported people ages 18 to 34 years.
Figure 13. Number of people reported with acute hepatitis C in NYC, 2015–2021
In 2020, the Council of State and Territorial Epidemiologists (CSTE) implemented a new definition for
acute hepatitis C. The addition of clinical criterion of peak elevated serum alanine aminotransferase
(ALT) levels > 200 international units per liter (IU/L) in conjunction with a positive hepatitis C virus
detection test drove the increase in acute hepatitis C cases in 2020. No providers reported cases of
acute hepatitis C infection to the Health Department in 2021; acute hepatitis C cases in 2021 were
identified through mandatory laboratory reporting of ALTs.
Health Department Requirement
• Health care providers in NYC are required to report all acute cases of hepatitis C within 24 hours.
Reporting of acute hepatitis C cases helps to identify outbreaks and inform effective prevention
programs. For more information on reporting acute hepatitis C cases, see Appendix 2.
9
3
10
35
81
185
130
0
50
100
150
200
2015 2016 2017 2018 2019 2020 2021
Number of people
Year of report
›› Surveillance
19
Chronic Hepatitis C
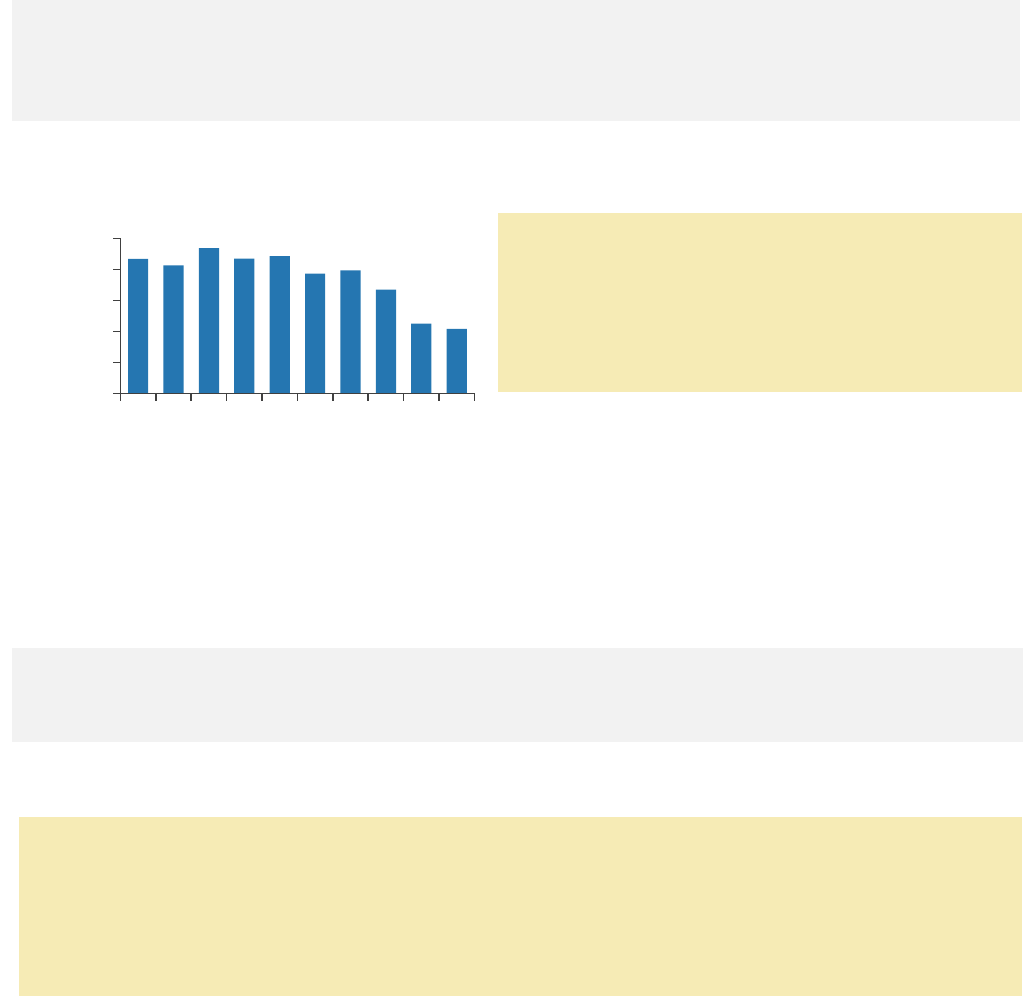
Since 2012, newly reported cases of chronic hepatitis C have declined in NYC. Reported cases of
chronic hepatitis C increased from 2020 to 2021, as more people accessed health care and
screening services in 2021 following the height of the COVID-19 pandemic in 2020. Thousands of
new cases of chronic hepatitis C continue to be reported each year.
Figure 14. Number and rate of people newly reported with chronic hepatitis C in NYC by year of first
report, 2012–2021
Data notes: In 2016 and 2018, CSTE implemented new case definitions for chronic hepatitis C. Since
2018, people first reported with hepatitis C between ages 2 and 36 months were classified using the
CSTE’s perinatal hepatitis C case definition and were excluded from total case counts. Perinatal
hepatitis C case counts can be found on page 22.
6,930
6,405
7,216
6,652
6,209
4,993
4,858
4,163
2,791
2,832
0
20
40
60
80
100
120
0
1,000
2,000
3,000
4,000
5,000
6,000
7,000
8,000
2012 2013 2014 2015 2016 2017 2018 2019 2020 2021
Rate per 100,000 people
Number of people newly reported with hepatitis C
Year of first report
Number of people newly reported with chronic hepatitis C
Rate per 100,000 people

›› Surveillance
20
4.7
21.0
21.8
23.1
29.4
Staten Island
Queens
Manhattan
Bronx
Brooklyn
Chronic Hepatitis C
As of 2019, the Health Department estimates that 86,000 people (1% of NYC residents) are living
with chronic hepatitis C.
18
2,832
Number of people newly
reported with chronic
hepatitis C in NYC in 2021
35.7
Rate of newly reported chronic
hepatitis C per 100,000 people
in NYC in 2021
Characteristics of People Newly Reported With Chronic Hepatitis C
Figure 15. Percentage of people newly reported with chronic hepatitis C in NYC by sex, age, borough,
and neighborhood poverty level, 2021
Sex Age
Borough
19
Neighborhood poverty level
›› For full data, see Appendix 12.
Health Department Recommendation
• Health care providers should screen all adults ages 18 to 79 years for hepatitis C according to
2020 U.S. Preventive Services Task Force guidelines. For more information, visit
uspreventiveservicestaskforce.org/uspstf/recommendation/hepatitis-c-screening.
18
Estimate as of 2017. For more information on how the hepatitis C prevalence estimate was
calculated, visit dx.doi.org/10.1017/S095026881800170X.
19
The Bronx includes people in Rikers Island jail facilities.
36.8
62.9
Female
Male
1.3
12.2
20.3
16.4
18.4
17. 5
14.1
3–19
20–29
30–39
40–49
50–59
60–69
≥ 70
15.8
41.0
23.1
20.0
Low
Medium
High
Very high
›› Surveillance
21
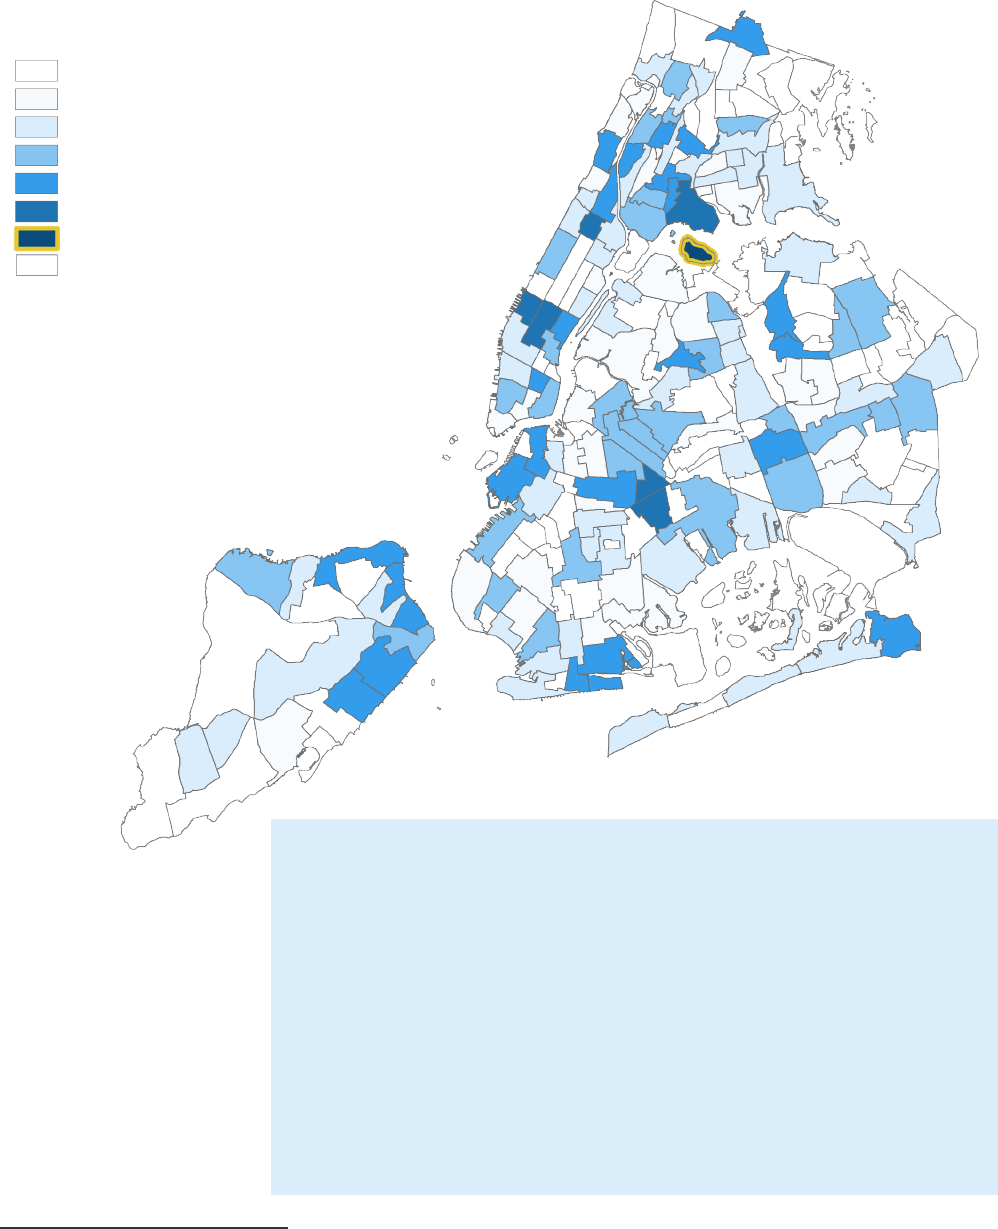
Chronic Hepatitis C: Geographic Distribution
Figure 16. Rate of people newly reported with chronic hepatitis C in NYC by NTA,
20
2021
›› For full data and map of NTAs, see Appendices 7 and 13.
20
NTA could not be determined for 121 people (4.3%) based on their address at first report.
NYC rate: 35.7
Neighborhoods with the highest rates
of people newly reported with chronic
hepatitis C (per 100,000 people):
1. Rikers Island, Bronx (275.7)
2. Brownsville, Brooklyn (87.7)
3. Brighton Beach, Brooklyn (86.7)
4. Fordham South, Bronx (82.1)
5. East Tremont, Bronx (81.1)
6. Stapleton-Rosebank, Staten Island
(75.9)
7. Queensbridge-Ravenswood-Long
Island City, Queens (75.2)
8. Hunts Point, Bronx (74.1)
9. Morrisania-Melrose, Bronx (71.6)
10. Ocean Hill, Brooklyn (69.9)
4.3–18.5
18.5–29.0
29.0–41.1
41.1–55.0
55.0–87.7
275.7 (Rikers Island)
Non-residential areas
Annual rate per 100,000 people
›› Surveillance
22
Perinatal Hepatitis C
The Health Department monitors newly reported hepatitis C in people who can become pregnant
(ages 15 to 44 years) as well as in children ages 0 to 36 months to identify perinatal transmission
and prevention opportunities.
Hepatitis C: People Who Can Become Pregnant (Ages 15 to 44 Years)
Nationally, an increasing number of people who can become pregnant are becoming infected with
hepatitis C. In NYC, the number of people who can become pregnant newly reported with chronic
hepatitis C has been slightly declining since 2014.
415
Number of people who
can become pregnant newly
reported with chronic
hepatitis C in NYC in 2021
23.1
Rate of people who can become
pregnant newly reported with
chronic hepatitis C per 100,000
people in NYC in 2021
Figure 17. Number of people who can become pregnant reported with chronic hepatitis C in NYC by
year of first report, 2012–2021
Characteristics of Children Newly Reported With Hepatitis C
In 2018, the Health Department began classifying children ages 0 to 36 months newly reported with
hepatitis C in NYC using the 2018 CSTE perinatal hepatitis C case definition.
3
Number of children ages 0 to
36 months newly reported with
hepatitis C in NYC in 2021
55%
Percentage of children tested because
the birthing parent was known to have
hepatitis C in NYC in 2021
›› For full data, see Appendix 14.
Health Department Recommendation
• Health care providers should test all children born to people living with hepatitis C for hepatitis
C antibody at age 18 months or older, or hepatitis C RNA at age two months or older, according
to the American Association for the Study of Liver Disease and Infectious Diseases Society of
America. All people diagnosed with hepatitis C should be connected to care and treatment.
• For more guidance, visit hcvguidelines.org/unique-populations/children.
415
0
200
400
600
800
1,000
2012
2013
2014
2015
2016
2017
2018
2019
2020
2021
Number of people
Year of first report
Health Department Recommendation
Health care providers should screen all pregnant
people for hepatitis C during each pregnancy
according to 2020 CDC guidelines. For more
information, visit
cdc.gov/mmwr/volumes/69/rr/rr6902a1.htm.
›› Surveillance
23
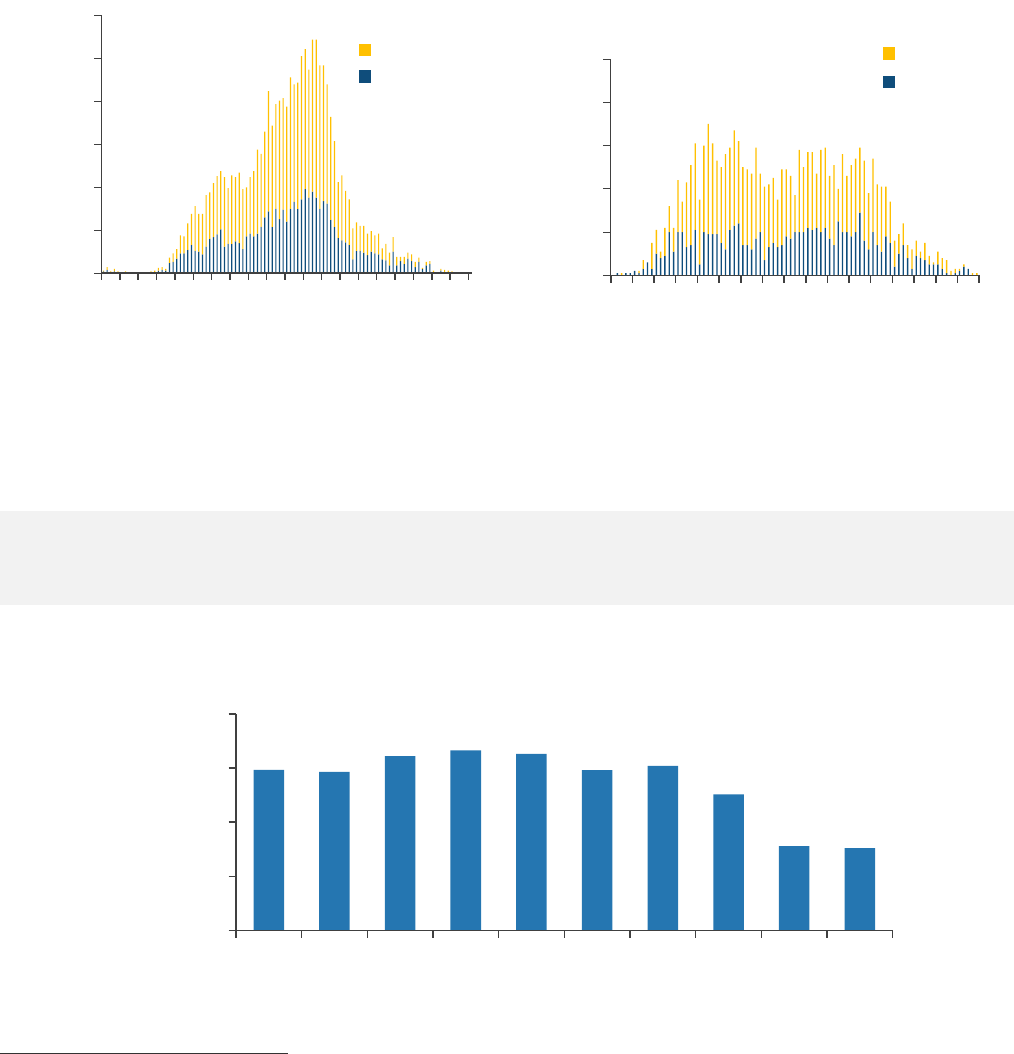
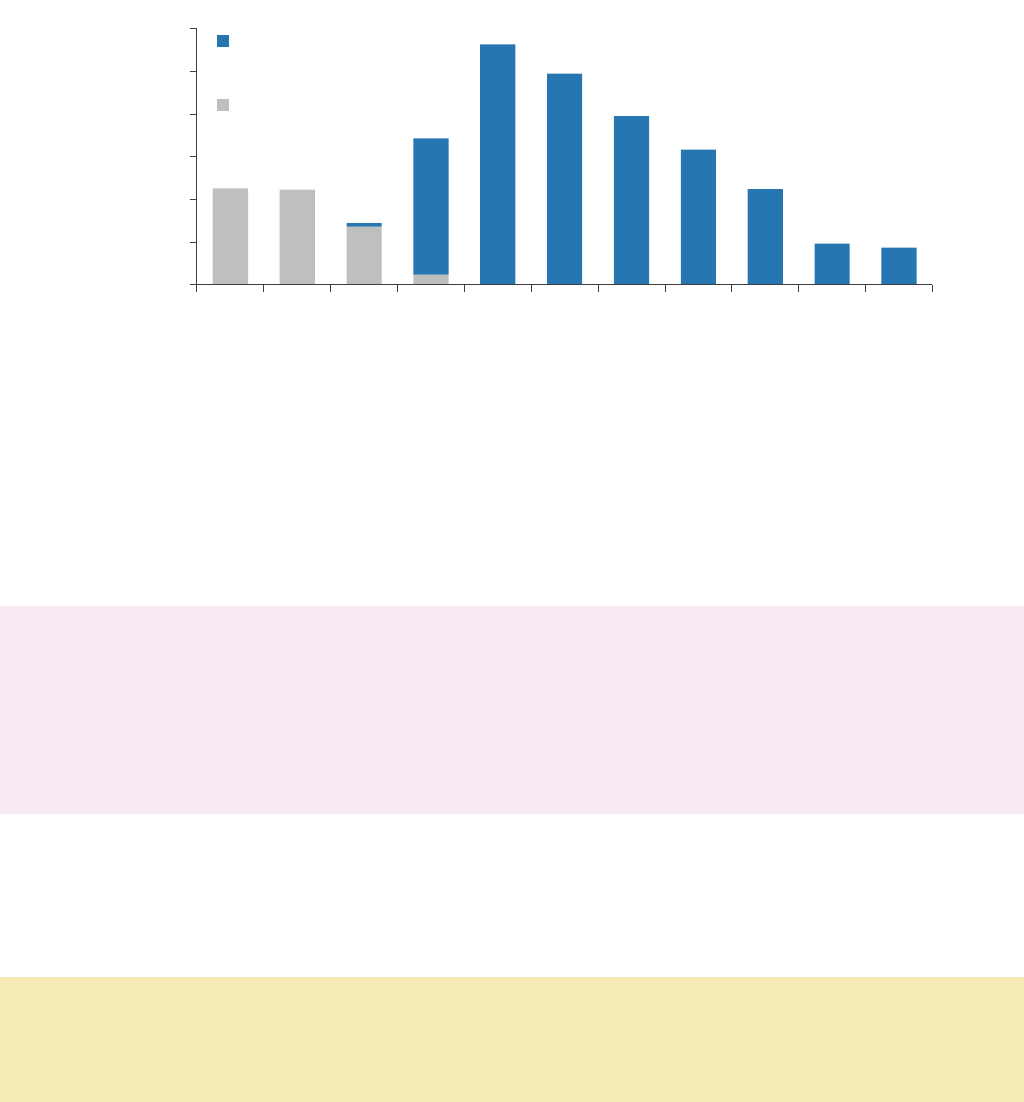
Chronic Hepatitis C: Age Distribution
In 2011, the age distribution of hepatitis C cases in NYC showed that cases were concentrated in
baby boomers (people born between 1945 and 1965) with another peak starting to form for younger
people. Ten years later, there was a distinct second peak showing a concentration of hepatitis C
cases in younger people, who are likely to have been infected from recent drug use.
Figure 18. Age distribution of people reported with chronic hepatitis C in NYC, 2011 and 2021
2011 2021
21
Hepatitis C: People Ages 3 to 29 Years
The Health Department monitors trends of hepatitis C in people ages 3 to 29 years since new cases
among young people are more likely to be recent infections. In 2021, 90.6% of people ages 3 to 29
years newly reported with chronic hepatitis C in NYC were ages 20 to 29 years.
381
Number of people ages 3 to 29
years newly reported with chronic
hepatitis C in NYC in 2021
13.7
Rate of newly reported chronic
hepatitis C per 100,000 people
ages 3 to 29 years in NYC in 2021
Figure 19. Number of people ages 3 to 29 years reported with chronic hepatitis C in NYC by year of
first report, 2012–2021
21
Starting in 2018, children ages 0 to 36 months reported with hepatitis C are reported as
perinatal infection.
0
50
100
150
200
250
300
0
10
20
30
40
50
60
70
80
90
110
Number of people
Age
Male
Female
0
20
40
60
80
100
0
20
30
40
50
60
70
80
90
Number of people
Age
Male
Female
742
732
805
831
815
740
760
629
390
381
0
250
500
750
1,000
2012 2013 2014 2015 2016 2017 2018 2019 2020 2021
Number of people
Year of first report
›› Surveillance
24
Neighborhoods with the highest rates of people ages 3 to 29 years
newly reported with chronic hepatitis C (per 100,000 people):
1. Rikers Island, Bronx (149.8)
2. Ocean Hill, Brooklyn (53.9)
3. Clinton, Manhattan (50.1)
4. Midtown-Midtown South, Manhattan (49.6)
5. Central Harlem South, Manhattan (43.1)
6. Hunts Point, Bronx (37.5)
7. Brownsville, Brooklyn (37.2)
8. West New Brighton-New Brighton-St. George, Staten Island (34.2)
9. Queensboro Hill, Queens (34.0)
10. Sheepshead Bay-Gerritsen Beach-Manhattan Beach, Brooklyn
(33.3)
Geographic Distribution
Figure 20. Rate of people ages 3 to 29 years newly reported with chronic hepatitis C in NYC by NTA,
22
2021
22
NTA could not be determined for 16 (4.2%) people based on their address at first report.
0.0
3.4–9.1
9.1–14.5
14.5–21.9
21.9–34.2
34.2–53.9
149.8 (Rikers Island)
Non-residential areas
Annual rate per 100,000 people
›› Surveillance
25
Enhanced Chronic Hepatitis C Surveillance of People Ages 18 to 34 Years
In 2021, the Health Department investigated 200 out of 301 (66.4%) people ages 18 to 34 years
newly reported with chronic hepatitis C in NYC and their health care providers. Patients were
interviewed for 74 (24.6%) investigations.
Patient Demographics
Figure 21. Characteristics of people ages 18 to 34 years newly reported with chronic hepatitis C in
NYC in 2021 interviewed through enhanced surveillance (n=200)
Gender identity
23
Race and ethnicity
24
*Or Alaska Native, non-Latino/a
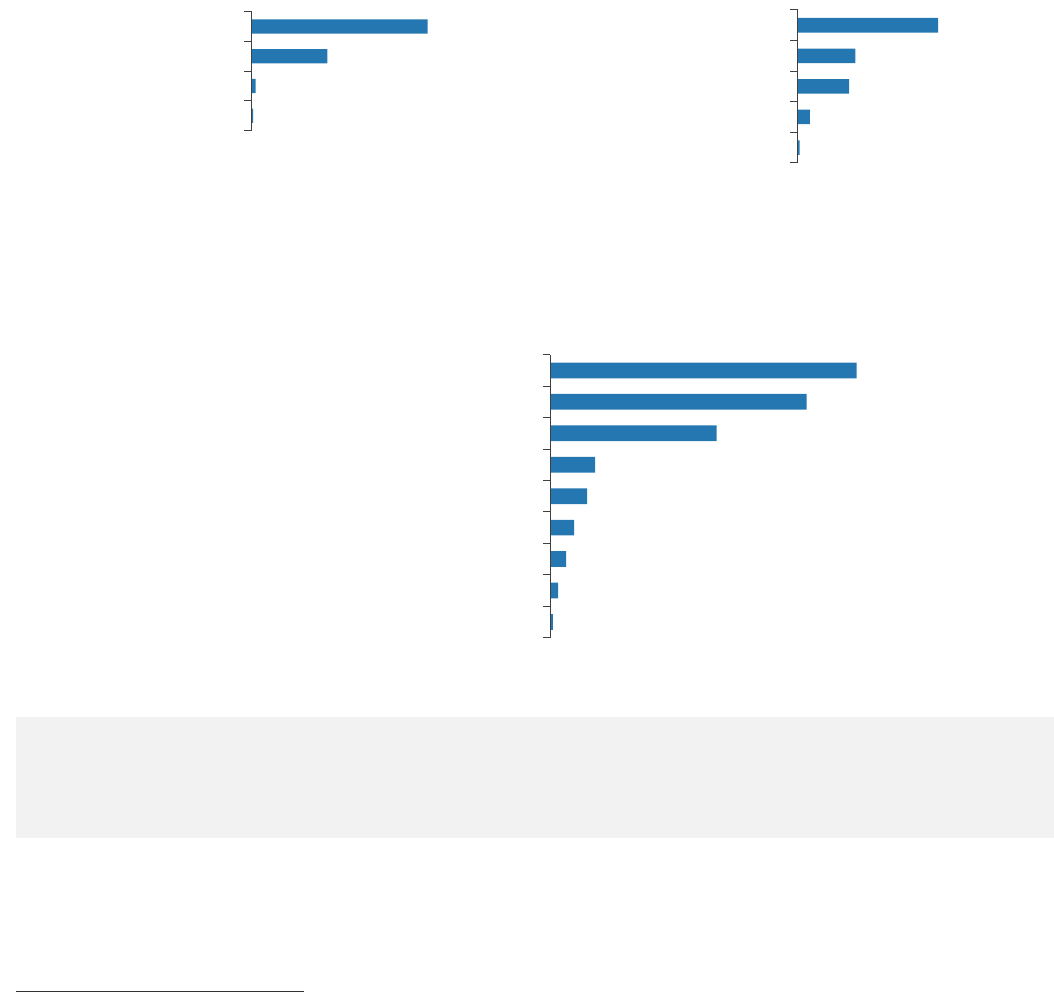
Hepatitis C Screening
Figure 22. Reason for hepatitis C screening among people ages 18 to 34 years newly reported with
chronic hepatitis C in NYC in 2021 interviewed through enhanced surveillance (n=200)
25
Access to Hepatitis C Health Care (n=200)
84%
Percentage of people ages
18 to 34 years with health
insurance in NYC in 2021
20%
Percentage of people ages
18 to 34 years referred to Health
Department navigator for linkage to
care in NYC in 2021
23
Gender identity was unknown for three (1.5%) people.
24
Race and ethnicity were unknown for 65 (32.5%) people.
25
Not mutually exclusive
58.0%
48.5%
31.5%
8.5%
7.0%
4.5%
3.0%
1.5%
0.5%
Routine screening
Drug or alcohol treatment
Risk factors
Other
Incarceration
Elevated liver enzymes
Symptoms or signs
Previously tested for hepatitis C
Jaundice
34.0%
14.0%
12.5%
3.0%
0.5%
White, non-Latino/a
Latino/a
Black, non-Latino/a
Asian, non-Latino/a
Native American*
67.5%
29.0%
1.5%
0.5%
Men
Women
Transgender women
Transgender men
›› Surveillance
26
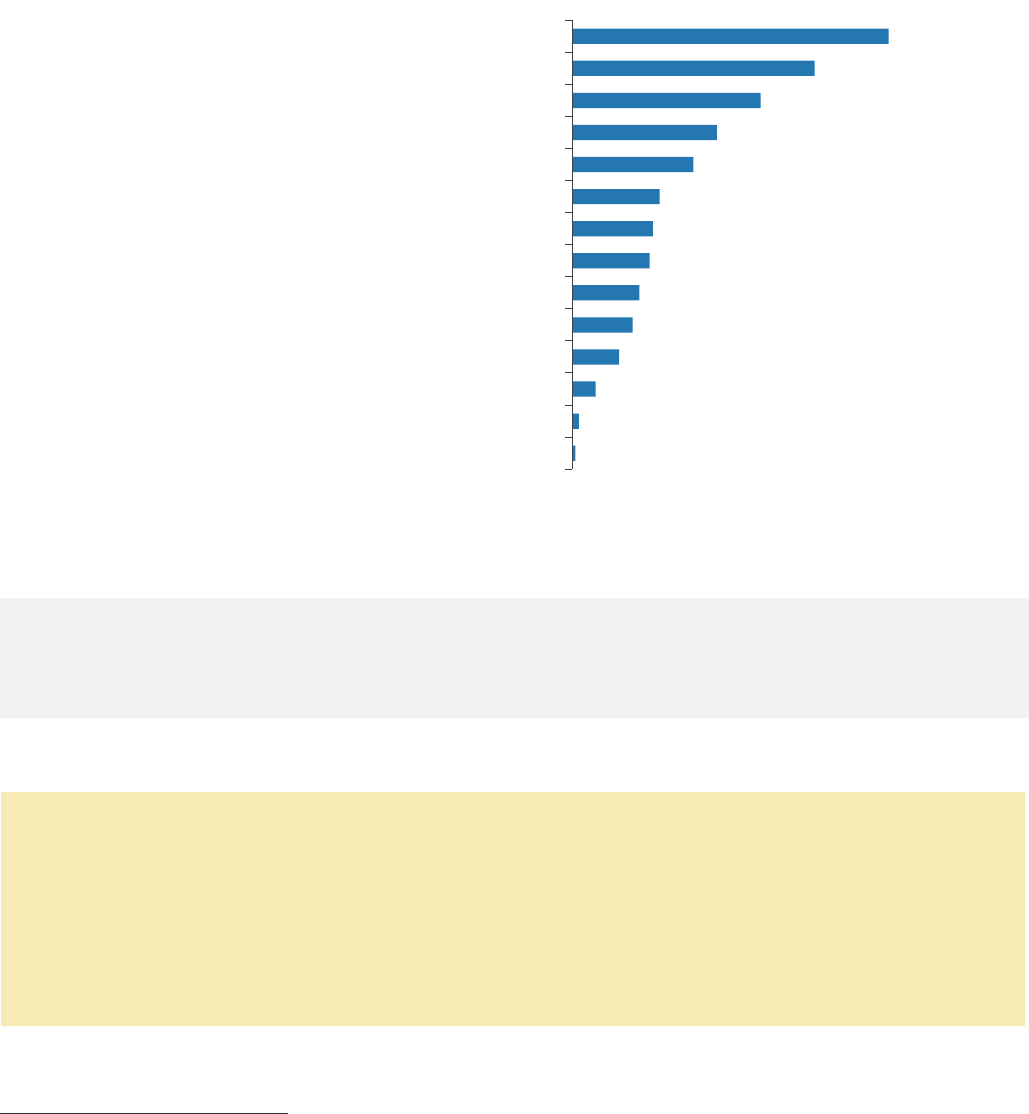
Hepatitis C Risk Factors
In 2021, people with a history of injection or intranasal drug use made up nearly half (47%) of people
ages 18 to 34 years newly reported with chronic hepatitis C in NYC.
Figure 23. Risk factors for hepatitis C infection among people ages 18 to 34 years newly reported
with chronic hepatitis C in NYC in 2021 interviewed through enhanced surveillance (n=200)
26,27
*Involving injections, anesthesia or blood
Hepatitis C Health Care
22%
Percentage of 200 people ages
18 to 34 years treated for
hepatitis C at the time of
interview in NYC in 2021
27%
Percentage of 200 people ages 18
to 34 years vaccinated against
hepatitis A and/or B as per provider
interview in NYC in 2021
›› For full hepatitis C enhanced surveillance data, see Appendix 15.
Health Department Recommendations
Health care providers should ensure that all people living with chronic hepatitis C are:
• Vaccinated for hepatitis A and B;
• Assessed for fibrosis or cirrhosis;
• Screened for liver cancer if cirrhotic; and
• Treated to cure infection.
For more information, see the Health Department’s City Health Information: Diagnosing and
Managing Hepatitis C at www1.nyc.gov/assets/doh/downloads/pdf/chi/chi-37-2.pdf.
26
Not mutually exclusive
27
41.5% of men interviewed reported as MSM.
47.0 %
36.0%
28.0%
21.5%
18.0%
13.0%
12.0%
11.5%
10.0%
9.0%
7.0%
3.5%
1.0%
0.5%
Injection drug use
Intranasal drug use
MSM
HIV infection
History of homelessness
Household contact
Non-professional tattoo or body piercing
Medical procedure*
Dental work or oral surgery
Hospitalized
History of incarceration
Long-term care facility
Received dialysis
Biological birthing parent with hepatitis C
›› Surveillance
27
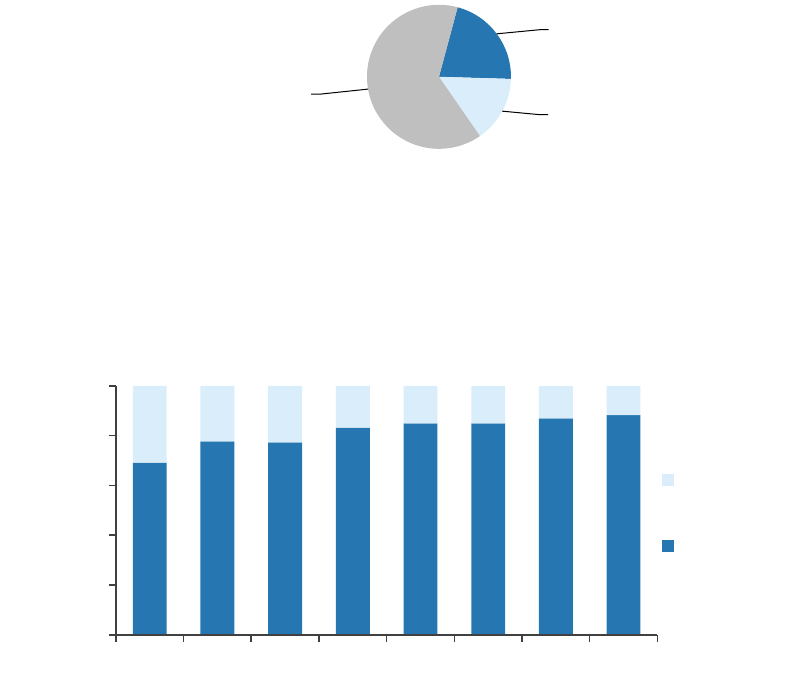
Hepatitis C Testing and Care Outcomes
Getting a positive hepatitis C test result is just the first step toward getting cured. The Health
Department analyzes surveillance and laboratory data to determine how many people are currently
infected, have received treatment for hepatitis C and have been cured. This information can be used
to identify opportunities to eliminate hepatitis C.
Hepatitis C Diagnosis
Hepatitis C viral (RNA) testing is an essential step in hepatitis C diagnosis to determine current
infection status so those currently infected can initiate treatment. In 2021, 85.3% of people in NYC
with a positive hepatitis C antibody test received an RNA test.
Figure 24. Test results of people in NYC with a positive hepatitis C antibody test who received an RNA
test, 2021
The Health Department works with health care facilities to increase the number of people in NYC
screened positive for hepatitis C antibody who have an RNA test (learn more on page 48). From 2014
to 2021, this percentage has increased from 69 to 88%.
Figure 25. Percentage of people in NYC with a positive hepatitis C antibody test who received an RNA
test, 2014 to 2021
››
For full data on the RNA and genotype test results of people newly reported with hepatitis C in
NYC in 2021, see Appendix 16.
Confirmed current
infection, 21.3%
Probable infection,
14.9%
Not currently
infected, 63.8%
0.0
20.0
40.0
60.0
80.0
100.0
2014 2015 2016 2017 2018 2019 2020 2021
Not tested
for RNA
Tested for
RNA
›› Surveillance
28
0%
20%
40%
60%
80%
100%
2015
2016
2017
2018
2019
2020
2021
Year of first report
Deceased before treatment
Not treated
Treated
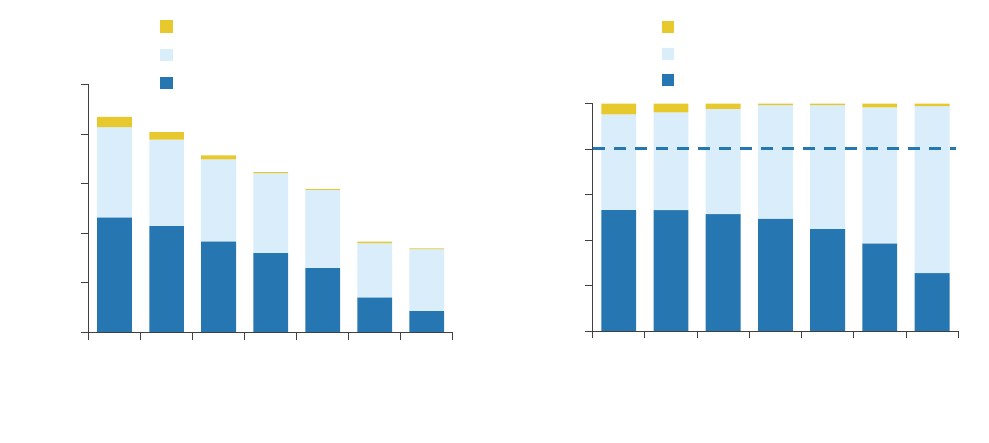
Hepatitis C Treatment
Hepatitis C treatment and cure are key steps toward achieving hepatitis C elimination goals.
Figure 26. Treatment initiation among people newly reported with a positive hepatitis C RNA test in
NYC by year of first report, 2015-2021
By number of people By percentage of people
Although nearly seven years have passed for people newly reported with hepatitis C during 2015,
only 56% of them were RNA negative as of March 31, 2022. Some may have moved or died outside
of NYC.
›› For full data on treatment initiation in people newly reported with hepatitis C in NYC in 2021, see
Appendix 17.
The NYC Viral Hepatitis Elimination Plan’s hepatitis C treatment goal is to increase the percentage of
people treated and cured within one year of diagnosis (as indicated by a negative RNA test). To reach
this goal, treatment should be initiated for more people newly diagnosed with hepatitis C.
0
1,000
2,000
3,000
4,000
5,000
2015
2016
2017
2018
2019
2020
2021
Year of first report
Deceased before treatment
Not treated
Treated
2030 elimination goal
›› Surveillance
29
Hepatitis C Treatment in Special Populations
Hepatitis C disproportionately affects people with low incomes, people with criminal justice
involvement and people who are experiencing homelessness. The Health Department analyzes data
from surveillance and other data registries to identify gaps in care for people facing structural barriers
to hepatitis C care and treatment.
Figure 27. Hepatitis C medication prescriptions for people covered by Medicaid in NYC, 2011–2021
Data source: Salient New York State (NYS) Medicaid Enterprise System
In 2014, with the availability of all-oral direct acting antiviral (DAA) medication, treatment initiation
increased for people living with hepatitis C in NYC enrolled in Medicaid. However, it has declined
since 2015 as fewer people are being diagnosed with hepatitis C and people who are harder to reach
are not engaged in services. More efforts are needed to identify these individuals and link them to
care and treatment.
Hepatitis C Cure in People With Criminal Justice System Involvement, With Substance Use
Disorders and Experiences With Homelessness
In 2021, the Health Department published an analysis of people in NYC who were cured of hepatitis
C from 2015 to 2019. Of 13,952 people with a confirmed hepatitis C infection from 2015–2018,
49.8% were cured within 841 to 966 days (about 2.5 years). Homelessness, criminal justice system
involvement, or substance use treatment was indicated for 4,304 (30.9%) people. For more
information, visit doi.org/10.1177/00333549211049263.
Since 2017, the Health Department has provided patient navigation services via telephone to people
with significant barriers to hepatitis C care. The Health Department also works with syringe services
and substance use treatment programs to integrate hepatitis C screening and treatment services.
Learn more on pages 37 and 48.
Health Department Recommendation
• To reach hepatitis C elimination goals, all people living with chronic hepatitis C should be treated
and cured. Providers can refer patients to no- or low-cost hepatitis C care and treatment
programs in NYC. For more information, see page 41 and visit nyc.gov/health/hepc.
0
1,000
2,000
3,000
4,000
5,000
6,000
2011 2012 2013 2014 2015 2016 2017 2018 2019 2020 2021
Number of people
Year of prescription
Direct acting antiviral
(DAAs) medications
Interferon-based
treatments
›› Surveillance
30
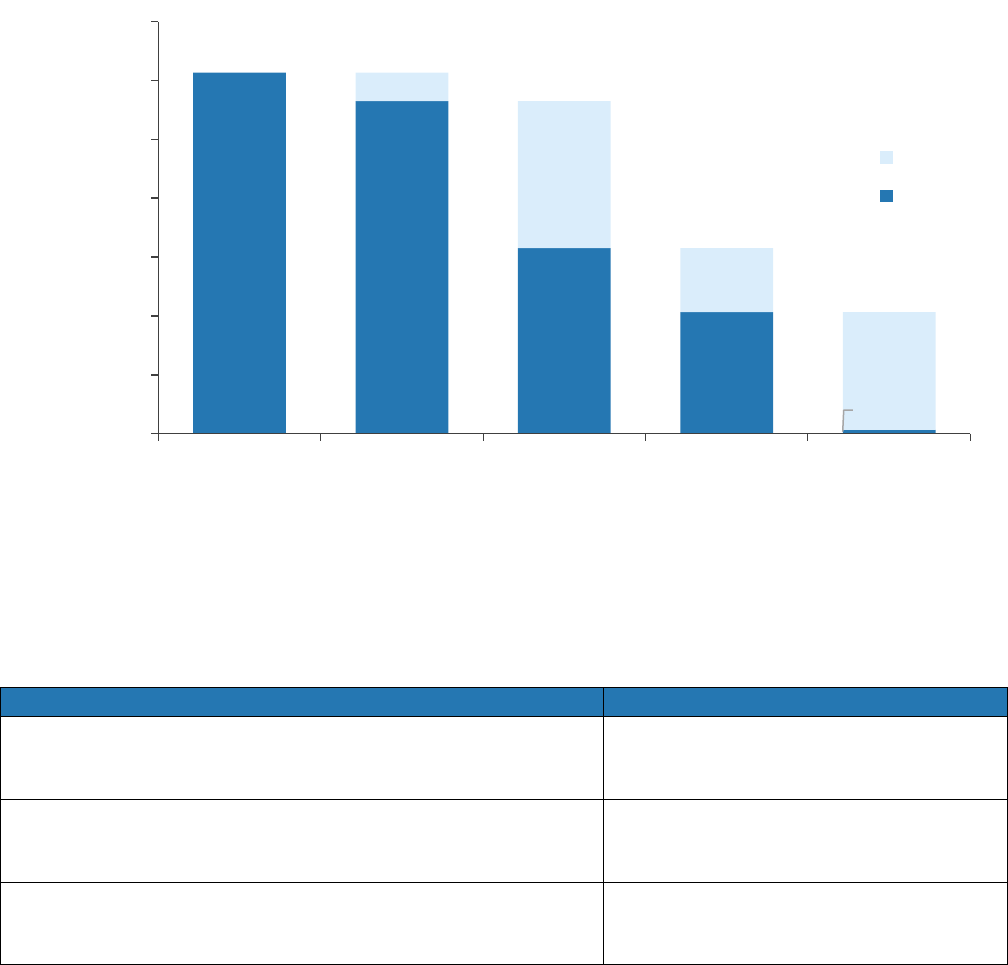
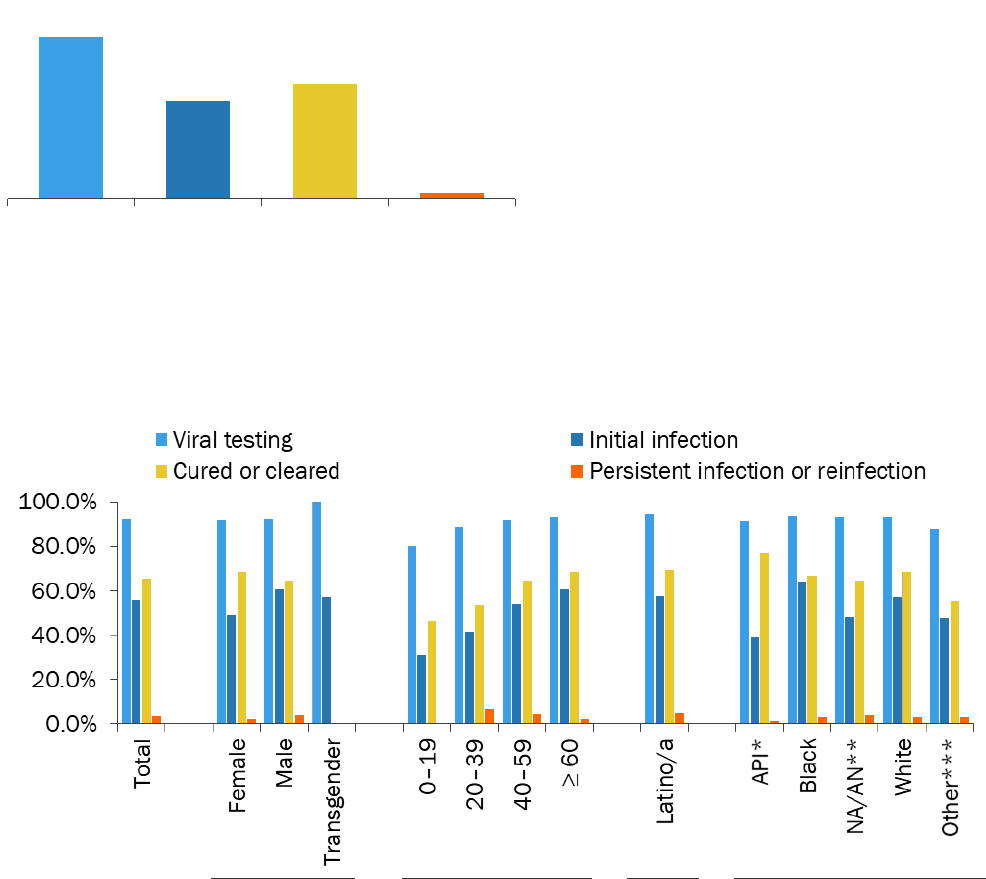
Hepatitis C Clearance Cascade
In 2021, the CDC developed a new method for calculating the number and percentages of people
who are tested for and cured of hepatitis C. This laboratory-based hepatitis C virus clearance cascade
updates the NYC surveillance-based care cascade used in previous reports.
Figure 28. Laboratory-based hepatitis C virus clearance cascade for NYC, July 1, 2014–December
31, 2021
*Of 49,972 people who did not test positive for hepatitis C RNA, 581 people were reinfected or had
a persistent infection.
What the cascade shows
Opportunities for intervention
Most (92%) of the 122,675 people who were ever
infected with hepatitis C in NYC since July 2014 were
tested to diagnose hepatitis C infection.
9,678 people in NYC have still not
completed viral diagnostic testing.
Of the 63,025 people whose first RNA test was positive,
more than half (55%) are no longer infected with
hepatitis C.
More than 20,000 people in NYC
have not been cured or cleared of
their hepatitis C infection.
Of the 41,332 people who have been cured or cleared
of the hepatitis C virus in NYC, 1,351 were reinfected or
had a persistent infection.
Learn more about hepatitis C
reinfection on page 32.
›› For full data and to read the definitions for each category, see Appendix 18.
122,675
112,997
63,025
41,332
1,351
9,678
49,972*
21,693
39,981
0
20,000
40,000
60,000
80,000
100,000
120,000
140,000
Number of people
No
Yes
Ever infected
(tested for past
or current
hepatitis C
infection)
Viral testing
(diagnostic
testing -
tested
for hepatitis C
RNA)
Initial infection
(tested positive
for hepatitis C
RNA)
Cured or
cleared
Persistent
infection or
reinfection
›› Surveillance
31
92.1%
55.8%
65.6%
3.3%
Viral testing Initial
infection
Cured or
cleared
Persistent
infection or
reinfection
In addition to calculating the number of people tested and cured, the Health Department calculates
the percentage of people at each stage of the hepatitis C care process to identify gaps in care.
Figure 29. Conditional proportions for laboratory-based hepatitis C virus clearance cascade for NYC,
July 1, 2014–December 31, 2021
Of people who were ever infected with
hepatitis C in NYC from July 2014 to
December 2020, 92.1% received viral
(hepatitis C RNA) testing by December
2021. Of this group, 55.8% had a positive
RNA test (initial infection). Of the initial
infection group, 65.6% have been cured or
cleared of the virus. Of the cured or cleared
group, 3.3% had a persistent infection or
were reinfected.
Figure 30. Conditional proportions for laboratory-based hepatitis C virus clearance cascade for NYC
by gender, age, and race and ethnicity, July 1, 2014–December 31, 2021
Gender Age Ethnicity Non-Latino/a Race
*Asian/Pacific Islander; **Native American or Alaska Native; ***Unknown
The percentage of people ever infected with hepatitis C in NYC who received a viral diagnostic
(hepatitis C RNA) test is similar across subpopulations. A greater percentage of people age 40 or
older were cured or cleared of hepatitis C compared to people under the age of 40. Persistent
infection or reinfection was higher among people ages 20 to 39 years.
›› For full data and to read the definitions for each category, see Appendix 18.
›› Surveillance
32
Hepatitis C Reinfection
Understanding hepatitis C reinfection patterns helps to guide hepatitis C prevention and elimination
efforts in NYC. The Health Department investigated 62 out of 118 (48%) people reported with a
positive hepatitis C RNA test in 2020 after cure.
28
Of those, 56 (90%) people were identified as
reinfected with hepatitis C by provider interviews and chart reviews.
80%
Percentage of people living with
hepatitis C reinfection in NYC
who are male
46.5
Median age of people living with
hepatitis C reinfection in NYC
Of people with a hepatitis C reinfection, 41% were reinfected one year or less from their estimated
cure dates.
Figure 31. Number and percentage of people reinfected with hepatitis C infection in NYC by reported
risk factors,
29
2020
Drug use was the most common reported risk factor for hepatitis C reinfection.
›› For full data, see Appendices 19 and 20.
Health Department Recommendations
Reinfection may occur in some people who continue to share drug use equipment or remain at risk
for infection. However, the rate of hepatitis C reinfection is lower than the rate of initial infection
among people who inject drugs.
30
Health care providers should:
• Test all adults once for hepatitis C infection and people with ongoing risk factors such as injection
drug use annually.
• Retreat people who are reinfected with hepatitis C to reduce poor liver-related outcomes and to
prevent ongoing transmission.
• Refer people who inject drugs to harm reduction services to prevent reinfection. Find harm
reduction services in NYC at
www1.nyc.gov/site/doh/health/health-topics/alcohol-and-drug-use-services.page.
›› For guidance on addressing drug use in primary care, visit
www1.nyc.gov/assets/doh/downloads/pdf/chi/chi-35-3.pdf.
28
Cure was determined for any person with a high-positive RNA test followed by a negative,
indeterminate, or low positive (less than [<] 1,000 international units per milliliter [IU/mL]) RNA
test. At least one negative RNA test must be reported at least four months after the date of the
negative or low positive RNA test for the person to be considered cured.
29
Not mutually exclusive.
30
For more information, visit hcvguidelines.org/unique-populations/pwid.
75.0%
28.6%
16.1%
12.5%
Ever used intranasal or injection drugs
Ever incarcerated
HIV positive
MSM
›› Surveillance
33
36.0
52.5
63.0
69.4
76.0
70.4
0.0
20.0
40.0
60.0
80.0
100.0
2015 2016 2017 2018 2019 2020
Year of first report
Not treated
Treated
96.7%
82.8%
77.3 %
4.3%
Viral testing Initial
infection
Cured or
cleared
Persistent
infection or
reinfection
Hepatitis C and HIV Coinfection
The Health Department matches hepatitis C and HIV surveillance data to characterize NYC’s
population with hepatitis C and HIV coinfection and identify opportunities to improve access to
hepatitis C treatment.
Figure 32. Percentage of people living with confirmed chronic hepatitis C and HIV coinfection in NYC
who initiated hepatitis C treatment by year of first report, 2015–2020
By the end of 2020, 70.4% of people living
with HIV in NYC who had ever tested
positive for hepatitis C RNA from 2014 to
2020 received treatment.
›› For data on people reported with hepatitis C and HIV coinfection who initiated treatment, see
Appendix 21.
Hepatitis C Clearance Cascade For People Living With HIV
The Health Department calculates the percentage of people at each stage of hepatitis C testing and
cure using the laboratory-based hepatitis C virus clearance cascade.
Figure 33. Laboratory-based hepatitis C virus clearance cascade for people living with HIV ever
infected with hepatitis C in NYC (n=11,157), July 1, 2014–December 31, 2021
In NYC, 96.7% of people reported with HIV
and ever infected with hepatitis C (from July
2014 to December 2020) were tested for
hepatitis C RNA (from July 2014 to
December 2021). Of people tested, 82.8%
had a positive RNA test (initial infection). Of
people with a positive RNA test, 77.3%
were cured or cleared of the hepatitis C
virus. Of this group, 4.3% were reinfected
or had a persistent infection.
››
For full cascade data and to read the definitions for each category, see Appendix 22.
Health Department Recommendation
• Health care providers should prioritize hepatitis C screening and treatment in all patients with
HIV. For more information, visit hcvguidelines.org/unique-populations/hiv-hcv.
›› Surveillance
34
Hepatitis C: Deaths
263
Number of deaths reported
as caused by hepatitis C
in NYC in 2020
2.7
Rate per 100,000 people
in NYC in 2020
Figure 34. Age-adjusted or age-specific death rate per 100,000 people
31
among NYC residents where
hepatitis C is listed as the cause of death in 2020, by sex, age, and race and ethnicity
Sex Age
Race and ethnicity
›› For full data, see Appendix 23.
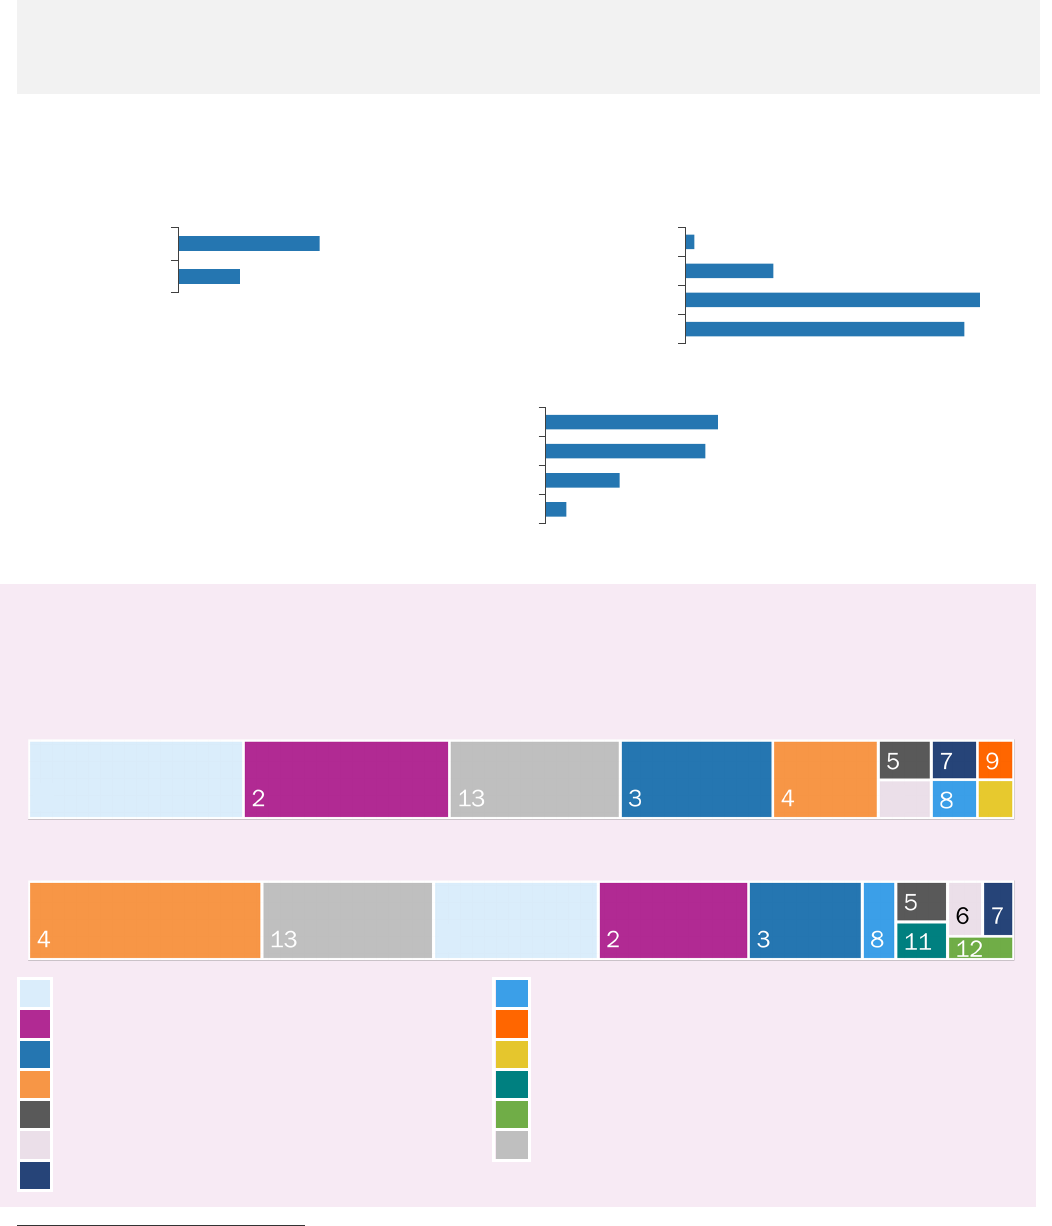
Leading Causes of Death Among Decedents With Hepatitis C
In 2021, the Health Department analyzed the leading causes of death among 4,505 decedents with
hepatitis C in 2020. For full data, see Appendix 24.
Leading causes of death, all decedents with hepatitis C, 2020
Leading causes of death, premature decedents with hepatitis C, 2020
1. COVID-19
8. HIV
2. Heart diseases
9. Viral hepatitis
3. Cancer
10. Essential hypertension and renal diseases
4. Drug-related
11. Chronic liver disease and cirrhosis
5. Diabetes
12. Accidents except drug poisoning
6. Chronic lower respiratory diseases
13. All other causes
7. Influenza and pneumonia
31
The population used in the rate constructions are based on the 2020 Census population
estimates, 2021 vintage. However, the 2020 Census counts are substantially higher than the
estimates, rendering potentially overestimated rates.
1.7
3.9
Female
Male
0.4
4.0
13.4
12.7
25–44
45–64
65–84
≥ 85
4.2
3.9
1.8
0.5
Black, non-Latino/a
Latino/a
White, non-Latino/a
Asian or Pacific Islander, non-Latino/a
10
1
1
6

35
Prevention and Screening
The Health Department promotes hepatitis A, B, and C prevention and screening among people at
high risk of acquiring these infections, including people who use drugs; people who have sexual
partner(s) with hepatitis A, B, or C; MSM; and infants born to pregnant people living with hepatitis B
and C. The Health Department offers low- or no-cost hepatitis A and B vaccinations at its clinics,
including to people who are underinsured or uninsured.
Hepatitis A and B Vaccinations
Number of vaccine doses provided at
Health Department clinics in 2021
Number of people who completed the
vaccine series in NYC in 2021*
Hepatitis A
2,277
97,998
Hepatitis B
3,330
55,794
*As reported to the Citywide Immunization Registry (CIR);
CIR data are less representative of adult vaccination
›› For full data, see Appendices 25 and 26.
Viral Hepatitis in Correctional Facilities
Since 2013, New York City Health + Hospitals (NYC H+H)/Correctional Health Services has screened
people in the NYC jails for hepatitis C. In 2018, Correctional Health Services implemented universal
hepatitis C screening at the intake examination upon admission to jail. Correctional Health Services
also provides vaccinations against hepatitis B.
63
Number of people who
received hepatitis C treatment
in NYC jails in 2021*
72
Number of people vaccinated
against hepatitis B in NYC jails in
2021
*Includes those who completed or partially completed treatment while in NYC jails
›› For guidance on providing primary care to patients with a history of criminal justice system
involvement, see www1.nyc.gov/assets/doh/downloads/pdf/chi/chi-38-2.pdf.
32
Based on rapid test, antibody test or viral load test in 2021 for individuals who received an
intake examination in 2021. Numerator excludes those who refused screening.
1,918
Number of hepatitis C
screening tests performed at
intake examination in 2021
32
13%
Percentage of intake examinations
with a hepatitis C screening test
performed in 2021
35

›› Prevention and Screening
36
Syringe Service Programs and Medications for Addiction Treatment
The Health Department funds 15 syringe service programs across NYC to provide health care services
to people who use drugs. Services include hepatitis B vaccination, hepatitis C testing and care
coordination, overdose prevention and harm reduction education, distribution of sterile syringes and
other drug use equipment to prevent the transmission of viral hepatitis and other blood-borne
diseases, and access to buprenorphine treatment.
20,191
Number of syringe
service program participants
in NYC in 2021
5,376,627
Number of
syringes distributed
in NYC in 2021
›› For more information on syringe service programs in NYC, see the Epi Data Brief at
www1.nyc.gov/assets/doh/downloads/pdf/epi/databrief110.pdf.
The Health Department works to expand access to methadone and buprenorphine, which are
medicines for addiction treatment for people with opioid use disorder. Treatment with methadone
and buprenorphine has been shown to reduce a person’s risk of getting hepatitis B and C and their
risk of overdose.
26,103
Number of people in methadone treatment in NYC in 2021
15,080
Number of people filling a buprenorphine prescription in NYC in 2021
2,922
Number of providers who issued buprenorphine prescriptions
to NYC residents in 2021
Provisional data show that in 2020, 2,062 people died from drug overdose in NYC. The Health
Department estimates there are more than 10,000 non-fatal overdoses each year. People with a
history of non-fatal overdose are at risk for hepatitis B and C and should be tested and connected to
care and treatment.
›› For more information on drug overdose in NYC, see the Epi Data Brief at
www1.nyc.gov/assets/doh/downloads/pdf/epi/databrief129.pdf.
Health Department Recommendations
Health care providers should:
• Assess all patients for drug use and provide overdose and infection prevention services to
patients who use drugs.
• Offer hepatitis A and B vaccination to patients who report current injection or intranasal drug
use, are at risk for sexual transmission of hepatitis A and B, or have hepatitis C.
• Screen people who have had a non-fatal overdose for hepatitis B and C.
37
Health Department Tele-Navigation
The Health Department uses hepatitis B and C surveillance data to assess patient diagnosis and
engagement in care and perform outreach. From 2017 to 2021, the Health Department reached out
to 2,904 people living with hepatitis B or C by telephone to provide health care navigation services
to support linkage to care and treatment.
965
Number of people living with
hepatitis B or C in NYC called to offer
tele-navigation services in 2021
474
Number of people living with
hepatitis B or C in NYC reached
and provided tele-navigation
services in 2021
Hepatitis B Tele-Navigation Program
In 2021, the Health Department provided linkage to care services to 201 people living with hepatitis
B in NYC.
61%
Percentage of people
linked to hepatitis B
medical care in 2021
73%
Percentage of people linked to
hepatitis B medical care who were
virally suppressed in 2021
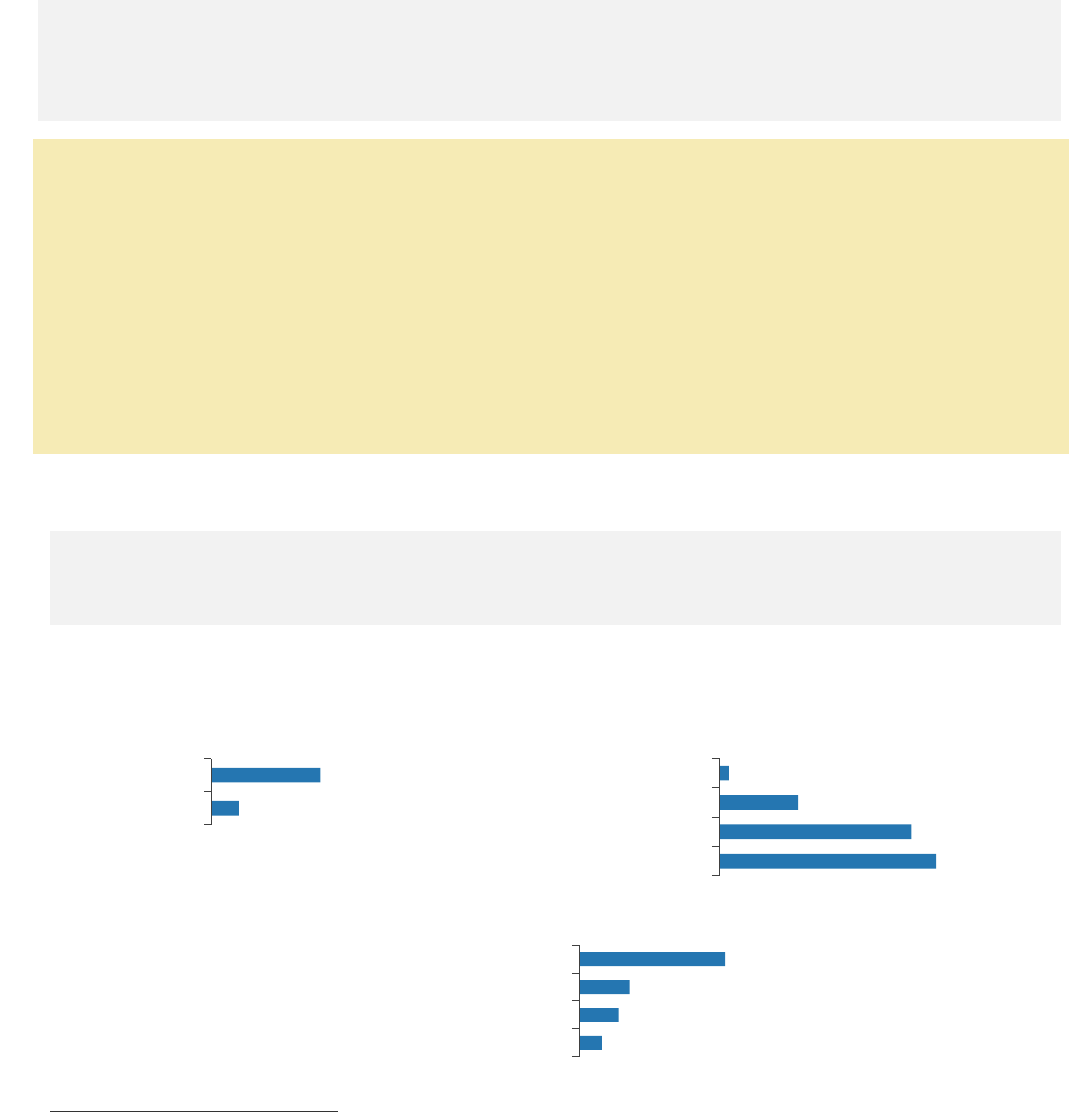
Of those living with hepatitis B, the Health Department reached out to people who were pregnant,
recently gave birth, or tested positive in the NYC Sexual Health Clinics.
Figure 35. Characteristics of people who received hepatitis B tele-navigation services in NYC, 2021
*Temporary Medicaid for pregnant people only
Increasing Follow-up Hepatitis B Care in the Postpartum Period
Pregnant people are routinely tested for hepatitis B to prevent perinatal transmission but may not
receive appropriate hepatitis B education and referrals. Since 2017, the Health Department has
contacted perinatal hepatitis B prevention program patients to offer culturally appropriate
telephone patient navigation services with the goal of improving adherence with postpartum
hepatitis B care. An analysis of 409 people who delivered a live infant between July 1, 2016—
March 1, 2019, found those receiving telephone patient navigation services were 1.66
times as
likely to see a hepatitis B care provider within six
months of childbirth compared with those who
did not. Read more at doi.org/10.1007/s10903-021-01240-5.
76.1
54.2
41.8
34.3
Born outside of the U.S.
Live in high- or very high-poverty neighborhood
Do not speak English
Uninsured or temporarily insured*

›› Health Department Tele-Navigation
38
Hepatitis C Tele-Navigation Program
In 2021, the Health Department provided linkage to care services to 273 people living with hepatitis
C in NYC.
75%
Percentage of people
linked to hepatitis C
medical care in 2021
48%
Percentage of people linked to
hepatitis C medical care who
initiated treatment*
*Defined by negative hepatitis C RNA test reported on a date after linkage to care
Of those living with hepatitis C, the Health Department reached out to people who were coinfected
with HIV, tested positive for hepatitis C in NYC jails or in NYC Sexual Health Clinics, were under the
age of 30 and diagnosed with hepatitis C during 2021, or recently gave birth. Overall, 29% were ever
tested at a substance use treatment facility.
Figure 36. Characteristics of people who received hepatitis C tele-navigation services in NYC,
2021
33,34
33
History of substance use is defined as any hepatitis C laboratory report ever from a free-standing
NYC substance use treatment center.
34
History of incarceration is defined as any hepatitis C laboratory report ever from an NYC
correctional facility.
71.1
59.0
29.3
16.8
Live with HIV
Live in high- or very high-poverty neighborhood
Have a history of substance use
Have a history of incarceration
39
Community Hepatitis Navigation Programs
The New York City Council Viral Hepatitis Initiative provides funding to community organizations to
help people at risk for hepatitis B and C overcome barriers to testing, care and treatment. Since
2014, the initiative has enabled 30 community health organizations to hire and train hepatitis B and
C patient and peer navigators.
Navigation Description
Peer and patient navigators are trained and employed to provide:
• Outreach and prevention (such as harm reduction) for people at risk for hepatitis B and C
• Health promotion and help accessing supportive services
• Navigation through complete hepatitis B and C testing
• Linkage to hepatitis A and B vaccination and hepatitis B and C care and treatment
Training Description
Training programs aim to:
• Build capacity of navigators and other service providers to support patients with hepatitis A, B
and C through testing, care and treatment
• Equip navigators to educate people at risk for hepatitis B and C
Navigators are trained in:
• Peer and patient navigation program protocols
• Patient navigation approaches, including Motivational Interviewing
• Hepatitis B and C transmission, prevention, and recommended testing and care practices
• Trauma-informed care
• Mental health first aid
• Overdose prevention
Fiscal Year 2015 (FY15) to FY21 Program Outcomes
From July 1, 2014, through June 30, 2021:
194
Number of peer and patient navigators trained and employed at community
organizations such as health centers, hospitals and syringe service programs
18,669
Number of people at risk for or living with hepatitis B or C who received
hepatitis education and navigation services
7,542
Number of people who were linked to hepatitis B or C medical care
4,444
Number of people who initiated treatment for hepatitis B or C
›› Community Hepatitis Navigation Programs
40
3.8–31.0
32.0–53.0
54.0–89.0
90.0–157.0
158.0–312.0
63.4 (correctional facilities)
Non-residential areas
Annual hepatitis B rate per 100,000 people
Check Hep B Patient Navigation Program
Since 2014, the Viral Hepatitis Initiative has supported hospitals, health centers, and community
organizations to provide patient navigation to people living with chronic hepatitis B. Check Hep B
patient navigators help patients complete hepatitis B testing, evaluation, and treatment. In FY21 (July
1, 2020, through June 30, 2021), there were 12 navigators employed in the program who served
901 people living with chronic hepatitis B, including people served in previous years who need
ongoing care coordination.
FY15 to FY21 Program Outcomes
From July 1, 2014, through June 30, 2021:
2,295
Number of
participants
enrolled
98%
Percentage of
participants with a
hepatitis B medical
evaluation completed
95%
Percentage of
treatment eligible
participants who
started treatment
Participant Characteristics
84%
Percentage of participants who
were born outside of the U.S.
80
Number of participants’
countries of birth
26%
Percentage of participants who
were uninsured
40
Number of languages other than
English spoken by participants
Program Organizations
The map below shows the rate of people newly reported with chronic hepatitis B in NYC in 2021 by
NTA and Check Hep B Patient Navigation Program locations.
Health Centers and Hospitals
1.
APICHA Community Health
Center
2.
BronxCare Health System
3.
Charles B. Wang
Community Health Center
4.
NYC H+H/Bellevue
Hospital
5.
NYC H+H/Elmhurst
Hospital
6.
Montefiore Medical Center
7.
NYU Seventh Avenue
Family Health Center
Community Organizations
1.
African Services Committee
2.
Community Health Action
of Staten Island
3.
Korean Community
Services
Check Hep B Program
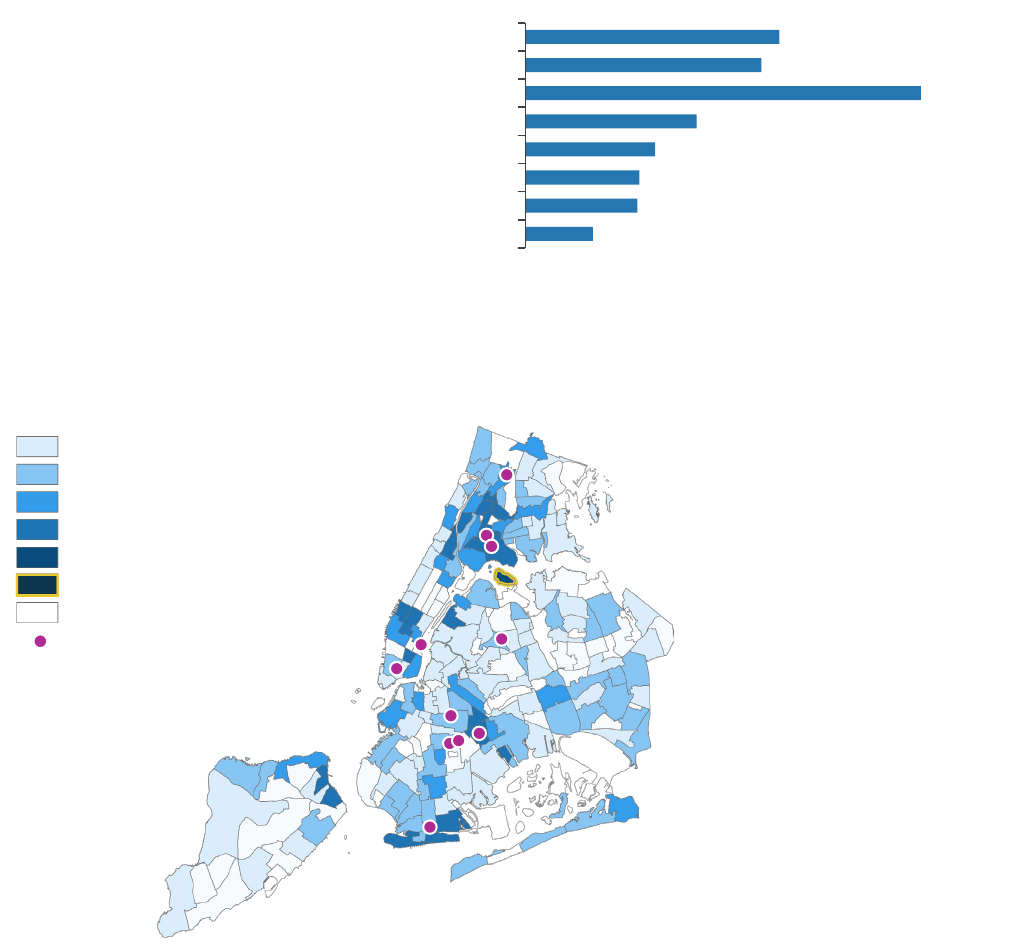
›› Community Hepatitis Navigation Programs
41
2.4–20.3
20.3–33.9
33.9–49.8
49.8–73.7
73.7–108.1
302.8 (correctional facilities)
Non-residential areas
Annual hepatitis C rate per 100,000 people
Check Hep C Program
Check Hep C Patient Navigation Program
Since 2014, the Viral Hepatitis Initiative has supported health centers and hospitals to provide
patient navigation to people living with chronic hepatitis C. Check Hep C patient navigators help
patients complete hepatitis C testing, evaluation and treatment. In FY21 (July 1, 2020, through June
30, 2021), there were 12 navigators employed in the program who served 513 people living with
chronic hepatitis C.
FY15 to FY21 Program Outcomes
From July 1, 2014, through June 30, 2021:
4,858
Number of
participants
enrolled
89%
Percentage of
participants
linked to care
59%
Percentage of
participants enrolled
who received treatment
Participant Characteristics
Program Organizations
The map below shows the rate of people newly reported with chronic hepatitis C in NYC in 2021 by
NTA and Check Hep C Patient Navigation Program health center and hospital locations.
33.1%
30.8%
51.5%
22.3%
16.9%
14.8%
14.6%
8.8%
Black, non-Latino/a
Latino/a
Enrolled in Medicaid
Mental health condition reported
Experiencing homelessness or unstably housed
History of incarceration
History of drug use
HIV infection
Health Centers and Hospitals
1. APICHA Community Health
Center
2. Bedford-Stuyvesant Family
Health Center
3. BronxCare Health System
4. Brownsville Multiservice
Family Health Center
5. Community Healthcare
Network
6. NYC H+H/Bellevue Hospital
7. NYC H+H/Coney Island
Hospital
8. NYC H+H/Elmhurst Hospital
9. NYC H+H/Kings County
Hospital
10. Kingsbrook Jewish Medical
Center
11. Montefiore Comprehensive
Health Care Center

›› Community Hepatitis Navigation Programs
42
Integration of Overdose Prevention in Hepatitis C Patient Navigation
From 2019 to 2022, the Health Department expanded the scope of its hepatitis C navigation
programs to include overdose prevention services with the support of a multi-year CDC grant award.
From September 1, 2019, through February 28, 2022,* this funding supported services for:
58
Number of navigators trained in overdose prevention counseling
for hepatitis C patients
4,546
Number of people living with hepatitis C who received
overdose prevention counseling
1,096
Number of people linked to integrated hepatitis C and
medication-assisted treatment
*These data are provisional and may be subject to change.
Hep C Navigation in Syringe Service Programs
Since 2014, the Viral Hepatitis Initiative has supported SSPs in NYC to provide peer and patient
navigation services to people at risk for hepatitis C. Peers use lived experience expertise to conduct
outreach, prevention, and linkage to care, while patient navigators coordinate care and support
retention in care to complete hepatitis C treatment. In FY21 (July 1, 2020, through June 30, 2021),
there were 19 peer and patient navigators employed in the program who served 1,741 people at risk
for hepatitis C.
FY15 to FY21 Program Outcomes
From July 1, 2014, through June 30, 2021:
11,516
Number of people at risk for
hepatitis C who received education
and prevention services
2,547
Number of participants
who tested positive for
hepatitis C
984
Number of participants with chronic
hepatitis C linked to medical care
572
Number of participants
with chronic hepatitis C
who received treatment
Participant Characteristics**
**Based on available data from 2,547 participants who tested positive for hepatitis C
19.0%
50.8%
49.0%
37.7%
30.9%
28.5%
24.2%
9.1%
Black, non-Latino/a
Latino/a
Enrolled in Medicaid
History of drug use
History of incarceration
Experiencing homelessness or unstably housed
Mental health condition reported
HIV infection
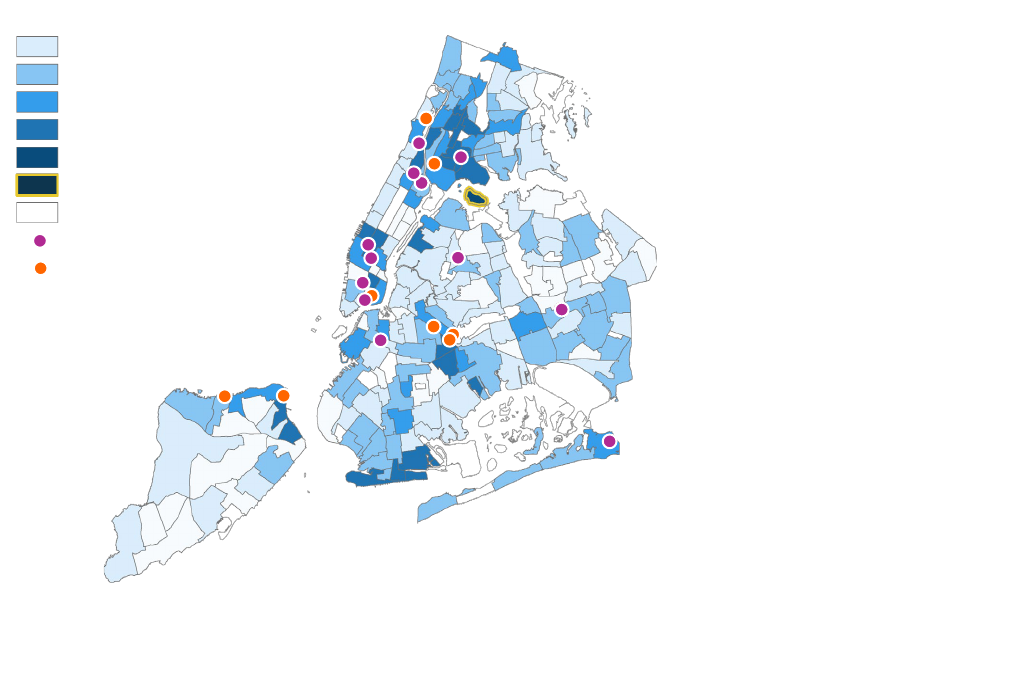
›› Community Hepatitis Navigation Programs
43
Program Organizations
The map below shows the rate of people newly reported with chronic hepatitis C in NYC in 2021 by
NTA and SSP locations.
Impact of COVID-19 and Adaptations in Community Navigation Programs
In 2020 and 2021, the community organizations providing hepatitis B and C outreach and navigation
services reported the following barriers brought on by the COVID-19 pandemic:
•
Reduced office hours and outreach activities to protect the safety of staff and patients
•
Limited hepatitis B and C testing services due to physical distancing requirements and reduced
laboratory capacity, which delayed diagnosis and treatment initiation
•
Patient apprehension to seek care to avoid exposure to COVID-19
•
Psychosocial needs of patients exacerbated by the pandemic such as lack of housing,
unemployment, food insecurity and mental health issues
Organizations adapted to provide navigation services via telephone. In 2021, navigators focused on
reengaging patients and helping them to return to care for in-person or telemedicine appointments.
Additionally, organizations integrated COVID-19 testing and vaccination activities into hepatitis
navigation efforts to ensure people at risk for and living with hepatitis B and C received critical care
given their increased risk for severe illness due COVID-19. During the COVID-19 pandemic, the Health
Department provided support to programs on navigating health insurance requirements and
accessing hepatitis B and C care, facilitated community of practice and learning meetings with
navigators, and coordinated trainings for navigators and clinicians. Despite the additional
responsibilities, the programs have met and even exceeded most goals for client engagement and
linkage to and retention in care.
2.4–20.3
20.3–33.9
33.9–49.8
49.8–73.7
73.7–108.1
302.8 (correctional facilities)
Non-residential areas
Annual hepatitis C rate per 100,000 people
Hep C Peer Program
Integrated Peer and
Check Hep C Patient
Navigation Program
Hep C Peer Program
1. AIDS Center of Queens County
2. Harlem United FROST’D
3. Housing Works
4. New York Harm Reduction
Educators
5. Positive Health Project
6. Safe Horizon Streetwork Project
7. St. Ann’s Corner of Harm
Reduction
8. VOCAL-NY
Integrated Hep C Peer and
Check Hep C Program
1. Alliance for Positive Change
2. After Hours Project
3. BOOM!Health
4. Community Health Action of
Staten Island
5.
Family Services Network of New
York
6. Praxis Housing Initiatives
7. Washington Heights CORNER
Project
›› Community Hepatitis Navigation Programs
44
Health Care Provider Training and Workforce Development
Since 2014, the Viral Hepatitis Initiative has supported the Harm Reduction Coalition, Empire Liver
Foundation, and, in 2018, the Hepatitis C Mentor and Support Group (HCMSG) to train peer and
patient navigators and clinical providers in hepatitis B and C prevention, testing, linkage to care,
evaluation and treatment.
Harm Reduction Coalition Navigation Training Program Outcomes
From July 1, 2014, through June 30, 2021:
58
Number of patient navigators trained
and employed at health care facilities
and community organizations
122
Number of SSP participants trained
and employed as hepatitis C peer
navigators
Empire Liver Foundation Clinical Training Program Outcomes
Since 2014, Empire Liver Foundation has trained over 3,000 clinicians providing care for people at
risk for hepatitis B and C. In FY21, specialized trainings included: Hepatitis B and HIV Coinfection,
Universal Screening for Hepatitis C, Integrating Treatment for Hepatitis B and C via Telemedicine into
Low-Threshold Care Models, Hepatitis B and C During Pregnancy, and A Minimal Monitoring Approach
to Hepatitis C Treatment, among others.
›› Visit empireliverfoundation.org to view a full list of training topics and request a training.
From July 1, 2020, through June 30, 2021:
Clinical training event
Number of clinician participants
Clinical hepatitis B and C grand rounds at health
care facilities across NYC
236
Hepatitis C clinical training series
1,805
Hepatitis B clinical training series
298
Special topics viral hepatitis trainings
543
The four-course Hepatitis C Clinical Training Series reviews screening and treatment guidelines with
a focus on issues related to people who use drugs. The series is designed to prepare clinicians with
MD, DO, PA, NP, and PharmD credentials to either begin treating hepatitis C patients or increase the
number of hepatitis C patients they treat. Evaluation data from 2017 to 2020 show that 67.4% of
attendees felt able to treat hepatitis C independently after completing a training.
“The Perinatal Hepatitis C course was excellent. The information I received prepared [me] to discuss
the issues regarding screening and treatment with my patients.”
– Participating nurse practitioner from a community health clinic in Brooklyn, NY
Hepatitis C Education for People At Risk
Since 2018, HCMSG has reached 572 people at risk for or living with hepatitis C through educational
programs and support groups at more than 30 community-based organizations and substance use
treatment and harm reduction programs. During COVID-19, HCMSG converted their public education
curriculum into an online, interactive module viewed by 337 people at risk for hepatitis C. In FY21,
HCMSG provided staff training and a demonstration of the online module to 182 care managers,
health educators and other program staff at 22 organizations.
45
Capacity Building
The Health Department engages with organizations throughout NYC to build capacity to prevent,
screen, and treat hepatitis B and C. The Health Department convenes coalition meetings, trains
clinical and non-clinical providers, and conducts data-to-care quality improvement projects.
Hep Free NYC Community Coalitions
Since 2004, the Health Department has engaged with community health organizations to organize
Hep Free NYC, a citywide network of health care providers, patients and public health professionals
working together to prevent, manage, and treat hepatitis B and C in NYC.
178
Number of
participating
organizations in 2021
826
Number of unique
meeting attendees
in 2021
4,167
Number of
social media
followers*
*Facebook, Instagram, Twitter and LinkedIn
Figure 37. Organizational makeup of Hep Free NYC
meeting attendees by percentage, 2021*
*CBOs = community-based organizations, CHCs = community health centers; figure excludes other
organizations.
At Hep Free NYC meetings, attendees review the latest viral hepatitis data, share best practices in
screening, and linkage to care and treatment, collaborate on special projects to meet community
needs, and develop new patient referral relationships.
›› To sign up for Hep Free NYC meeting invites and the Hep Free NYC newsletter, contact
2021 Hep Free NYC Highlights
•
Hep Free NYC led eight active committees, including the advocacy, awareness day planning,
clinical education, communications, research and public awareness committees.
•
The Coalition Against Hepatitis in People of African Origin NYC Committee and the South Asian
Hepatitis Initiative developed a range of resources, including multilingual resources for African
and South Asian communities.
5.6
6.2
7.9
9.6
17. 4
30.3
CHCs
Government
Education
Pharmacies
Hospitals
CBOs
0
1,500
3,000
4,500
6,000
2017 2018 2019 2020 2021
Figure 38. Number of Hep Free NYC
newsletter subscribers, 2017–2021

›› Capacity Building
46
Public Education
The Health Department produces and distributes free educational materials to community-based
organizations and health care facilities to promote up-to-date hepatitis B and C health prevention,
care and treatment, and referrals to NYC resources. In 2021, the Health Department developed new
translations of its hepatitis B and hepatitis C educational resources.
Public Education Materials
“Hepatitis B: The Facts”
(English, Spanish, Simplified
Chinese, Traditional Chinese,
French, Korean, Russian,
Bengali, Albanian, Uzbek,
Twi/Akan, Hausa): Booklet with
basic information on hepatitis B
testing, treatment, prevention
and care
Hepatitis B Vaccine Palm
Card (English
,
Spanish,
Simplified Chinese,
Traditional Chinese, French,
Korean, Russian, Bengali,
Albanian, Uzbek, Twi/Akan,
Hausa): Palm card to track
hepatitis B vaccine doses
“Hepatitis C and Your Liver”
(English, Spanish, Arabic,
Russian, Urdu, Bengali and
Hindi): Booklet with basic
information on hepatitis C
testing, treatment, prevention
and care
“Hepatitis C: Get Checked,
Get Cured” (English, Spanish
and Russian): Palm card with
basic information on
hepatitis
C testing, treatment and
prevention and care
“Your Liver Keeps You Healthy:
Protect It” (English, Spanish and
Chinese): Booklet with basic
information on hepatitis A, B,
and C testing, treatment,
prevention and care
“Alcohol and Hepatitis”
(English and Spanish): Palm
card with alcohol reduction
tips and action plan template
“Hepatitis C: Get Tested, Get
Cured” (English, Spanish and
Traditional Chinese): Poster
promoting hepatitis C testing
and treatment among baby
boomers
“Hepatitis C Treatment:
Before & Now” (English and
Spanish): Poster promoting
new hepatitis C treatments
“Get Hepatitis C Checked”
(English and Spanish): Posters
promoting hepatitis C testing
“Get Hepatitis C Cured”
(English and Spanish):
Posters promoting hepatitis C
treatment
›› Capacity Building
47
Public Education Materials
“Reduce Your Risk of Overdose,
Hep C & HIV” (English, Spanish
and Russian): Palm card with
tips for reducing the harm of
injection drug use
“Your Guide to Syringe Service
Programs” (English, Spanish
and Russian
): Palm card listing
SSPs in NYC
“Take Charge, Take Care”
(English, Spanish and Russian):
Booklet with basic information
on safer drug use, including on
preventing hepatitis C infection
“Fentanyl” (English, Spanish,
Russian, Simplified Chinese
and Traditional Chinese):
Postcard with basic
information on preventing
opioid overdose
“Buprenorphine” (English,
Spanish, Russian, Traditional
Chinese and Arabic): Pamphlet
with basic information on
buprenorphine safety, side
effects and insurance coverage
Provider Education Materials
“Preventing, Identifying and
Managing Hepatitis B”
(English): Clinical
recommendations for
hepatitis B prevention,
diagnosis and management
“Diagnosing and Managing
Hepatitis C” (English): Clinical
recommendations for hepatitis C
prevention, diagnosis and
management
“Dear Colleague Letter:
Hepatitis B and C Screening,
Care, and Treatment
Recommendations, 2020”
(English)
“Dear Colleague Letter:
Hepatitis B Vaccination
Recommendations, 2022”
(English)
“Dear Colleague Letter:
Universal Hepatitis C
Screening is Recommended
for Pregnant People, 2021”
(English)
“Treat Addiction. Save Lives.”
(English): Pamphlet with provider
information on buprenorphine
prescription and opportunities for
training and preceptorship
“Alcohol Screening and
Counseling for Patients with
Hepatitis” (English): Alcohol
counseling guidance for
patients with hepatitis C;
accompanies “Alcohol and
Hepatitis” palm card
“Hepatitis A, B and C in New York
City: 2020 Annual Report”
(English): Annual report with
2020 viral hepatitis surveillance
data and programmatic activities
›› For more information or to order materials, contact [email protected].

›› Capacity Building
48
Health Department Training
The Health Department trains non-clinical service providers on effective outreach, prevention,
testing, linkage to care and support through treatment. In 2021, the Health Department delivered 11
trainings, including Introduction to Viral Hepatitis and Hepatitis C Patient Navigation.
›› See the Health Department training catalog at nychealthtraining.org/training.
Number of
trainings
Number of
participants
Number of organizations
represented
Introduction to Viral Hepatitis
6
124
58
Hepatitis C Patient Navigation
5
98
42
Clinical Practice Facilitation
Through the Clinical Practice Facilitation program, the Health Department supports acute care
hospitals, community health centers, and other clinical settings where people at risk for hepatitis B
or C seek care, to increase their clinical capacity to screen for and treat hepatitis B and C. Using
surveillance data, Health Department staff identify health care facilities in high-prevalence areas or
with large populations of patients with hepatitis B and/or C to participate in clinical practice
improvement projects. Participating facilities engage in a tailored array of capacity building
interventions, including:
• Querying electronic health records (EHR) and using surveillance data to assess screening and
treatment rates
• Training clinical and non-clinical providers
• Implementing quality improvement projects
• Enrolling in peer-to-peer provider mentoring
• Participating in the Hep Free NYC community coalitions
Through these projects, participating facilities align workflows, data systems, resources, and staff
training to increase hepatitis B and C screening and treatment rates. The Health Department provides
support to improve access to care and clinical outcomes in people affected by hepatitis B and C
through sustained systemic changes at participating facilities.
Hepatitis C Treatment via Telemedicine at Syringe Services Programs
In 2021, the Health Department completed a seven-month clinical practice facilitation project with
two SSPs in Manhattan. Both sites offer low threshold hepatitis C treatment to people who use drugs.
Patients at both sites were offered treatment on-site and/or via telemedicine. Many patients were
experiencing homelessness and were hard to locate during the first few months of the COVID-19
pandemic. Sites offered cell phones and transportation support for medical labs to keep patients
engaged. One site offered up to $100 in gift cards. Over the course of the project, both sites
diagnosed a total of 64 patients with chronic hepatitis C. Of the patients diagnosed, 41 (64%) were
linked to care with a medical appointment and 23 (36%) started treatment by the end of the seven-
month project.
Improving Hepatitis C Treatment Initiation at Substance Use Treatment Programs
In 2021, the Health Department worked with a drug rehabilitation center with an inpatient site in
Brooklyn and an outpatient site in Manhattan. The goal of this 12-month project was to link people
diagnosed with chronic hepatitis C to a provider, especially one with experience providing primary
care to people who use drugs. The center hired and trained a patient navigator who used a
surveillance-based patient list to identify patients with a positive hepatitis C RNA test admitted to the

›› Capacity Building
49
center in the previous 12 months. The center developed a patient referral workflow to facilitate
referrals to local providers and partnered with a primary care program to provide monthly hepatitis C
testing at its outpatient site and hepatitis C treatment via telemedicine. During the project, 1,845
people were tested at the center’s inpatient or outpatient sites. Of those tested, 134 (7%) had a
positive hepatitis C RNA test. Of those who tested positive, 41 (31%) were referred to treatment, 14
(10%) were linked to care, and 6 (4%) started treatment by the end of the project.
The Health Department also completed a 12-month project with a multi-site outpatient substance
use treatment program in NYC to expand hepatitis C treatment options on-site and via telemedicine.
The program recruited non-clinical and clinical staff for trainings led by the Health Department and
Empire Liver Foundation, created a hepatitis C testing-to-treatment patient workflow, and reviewed
surveillance and EHR reports. Of the 60 patients identified with a positive hepatitis C RNA test, 38
(63%) were linked to care, 34 (56%) started treatment, and 17 (28%) completed treatment by the
end of the project. The program noted that when offered the option, patients overwhelmingly opted
for treatment on-site. The patient navigator played a central role in engaging and educating patients.
The program is continuously training staff on hepatitis C among people who use drugs and monitoring
patients at all sites who may need treatment.
Program Evaluation: Building Clinical Capacity Since 2017
In 2021, the Health Department partnered with an evaluation specialist to develop a theory of change
and an evaluation framework for its Clinical Practice Facilitation program.
29
Number of clinical practice
facilitation projects from 2017 to
2021
19
Number of health care facilities
participating in clinical practice
facilitation projects from 2017 to
2021
Projects focused on practice improvement in hepatitis C screening and treatment. During these
projects, health care facilities committed to making systemic changes in their hepatitis care practices
examined surveillance and EHR data, created workflows and protocols, devoted staff time to trainings
and shared best practices in community events. Most participating facilities implemented improved
screening and care coordination protocols, initiated audit and feedback reports, improved their use
of data for service advancements, and reported high satisfaction level post-project completion.

50
NYC Viral Hepatitis Elimination Plan: 2021 Update
Since the release of the NYC Viral Hepatitis Elimination Plan in 2021, the Health Department and
community partners have made progress on several priority strategies.
›› Learn more about the NYC Viral Hepatitis Elimination Plan on page 5.
Hepatitis B Elimination Strategies
Strategy
Status update
To increase accessibility of hepatitis B awareness, education and prevention:
1.4 Expand no- or low-cost, adult hepatitis B
vaccination for people who are uninsured or
underinsured. Focus vaccination efforts on adults
with comorbidities such as HIV and hepatitis C
that can make it more difficult to clear acute
hepatitis B infection. Offer testing co-located with
vaccination, across a wide variety of health care
facilities.
Hep Free NYC members joined the Hep B
Foundation, Hep B United, and other
stakeholders to advocate for expansion of
the CDC Adult Immunization Program to
increase support for adult hepatitis B
vaccination programs. Continued advocacy
is needed.
To increase acceptability of hepatitis B testing and linkage to care:
2.8 Offer hepatitis B testing at community venues,
especially those located in or serving communities
with high hepatitis B prevalence or vulnerability,
and alongside other types of testing to normalize
hepatitis B screening as a part of routine health
care.
The Health Department provided clinical
training on the importance of hepatitis B
testing (for more details, see page 44) and
will collaborate with community partners to
increase screening at community venues
and normalize hepatitis B screening as a
part of routine health care.
To increase accessibility of hepatitis B care and treatment:
3.4 Advocate for Medicaid, Medicaid Managed
Care Plans, and private insurance plans to require
insurers to fully cover hepatitis B screening,
treatment, lab work, routine ultrasound/liver
cancer screening, and other related costs, without
cost sharing.
The Health Department has and will
continue to meet with the New York State
Department of Health (NYSDOH) to identify
mechanisms to expand coverage for the full
range of hepatitis B care and continued
advocacy by community members is needed.
3.5 Advocate to expand the NYSDOH AIDS Drug
Assistance Program (ADAP) to include all hepatitis
B treatment options for people with HIV and co-
infected with hepatitis and to raise the income
level for eligibility and simplify the application
process.
The Health Department will increase
awareness of the existing NYSDOH ADAP
program that covers screening, serology, and
two treatment options for hepatitis B among
people living with HIV.
To increase availability of hepatitis B surveillance data:
4.2 Amend the NYC Health Code to require
laboratories to report the tests commonly used to
monitor hepatitis B (for example, negative
HBeAg).
The Health Department drafted language for
NYC Health Code amendments to present to
the Board of Health in FY23.

›› NYC Viral Hepatitis Elimination Plan: 2021 Update
51
Hepatitis C Elimination Strategies
Strategy
Status update
To increase acceptability of hepatitis C awareness, education, and prevention:
5.7 Develop additional trainings and materials for
clinical providers that communicate the importance
of delivering trauma-informed, stigma-free and harm
reduction-oriented hepatitis C care. Ensure that
clinical provider trainings include education about
reinfection and cirrhosis follow-up care, and address
the need for urgency in initiation of hepatitis C care.
The Health Department partnered with
Empire Liver Foundation to deliver clinical
education on harm reduction, re-infection,
cirrhosis and liver cancer follow-up care,
and the importance of initiating hepatitis
C treatment for all including active drug
users and people with HIV.
To increase accessibility of hepatitis C testing and linkage to care:
6.5 Support increased funding for patient navigation
programs (such as Check Hep C) for people living
with hepatitis C.
The Hep Free NYC Advocacy Committee
developed educational materials and
organized a training session to support
the Viral Hepatitis Initiative and to
advocate for increased funding for patient
navigation programs.
To increase accessibility of hepatitis C treatment:
7.7 Advocate for Medicaid, Medicaid Managed Care
Plans, and private insurance plans to make hepatitis
C treatment and ongoing monitoring via
telemedicine available and reimbursable beyond the
COVID-19 public health emergency.
The FY23 NYS budget included telehealth
payment parity that will require insurers to
pay physicians the same rate for the
same service whether the service is
delivered in-person or via telehealth.
To increase acceptability of hepatitis C treatment:
7.13 Expand efforts to aid facilities serving
populations with a high prevalence of hepatitis C
(such as federally qualified health centers (FQHCs),
SSPs, opioid treatment programs (OTPs),
alternatives to incarceration programs, and inpatient
drug treatment programs) to have the capacity to
treat on-site. Specifically, support OTPs in
addressing the staffing and administrative barriers
to providing and billing for hepatitis C treatment. This
may include supporting the development of 340B
applications and facilitating collaborations with
community health centers.
The Health Department supported two
organizations’ applications for 340B
certification to increase access to
affordable hepatitis C medications.
However, as of April 1, 2023, the NYS
Medicaid pharmacy benefit will be moved
under Medicaid Fee-For-Service Pharmacy
Program which will effectively remove the
ability for community health centers to
purchase prescription drugs at a reduced
price. Advocacy related to this issue will
be ongoing.
To increase availability of hepatitis C surveillance data:
8.2 Amend the NYC Health Code to require
laboratories to report negative hepatitis C antibody
results to enable the NYC Health Department to
develop and share citywide and facility-specific
screening rates and identify acute infections.
The Health Department drafted language
for NYC Health Code amendments to
present to the Board of Health in FY23.
52
Publications and Presentations
Publications
• Foster MA, Hofmeister MG, Albertson JP, et al. Hepatitis A virus infections among men who have
sex with men - eight U.S. states, 2017-2018.
MMWR Morb Mortal Wkly Rep
. 2021;70(24):875-
878.
• Kela-Murphy N, Moore MS, Verma CM, et al. The Hepatitis C Clinical Exchange Network: A local
health department partnership with acute care hospitals to promote screening and treatment of
hepatitis C virus infection.
J Public Health Manag Pract
. 2022;28(2), E413-E420.
• Moore MS, Bocour A. Association between time to first RNA-negative test result among people
with hepatitis C virus infection and homelessness or testing at a correctional or substance use
treatment facility, New York City.
Public Health Rep
. 2021 Oct 25:333549211049263.
• Schwartz J, Bocour A, Tang L, et al. Telephone patient navigation increases follow-up hepatitis B
care in the postpartum period for immigrants living in New York City.
J Immigr Minor Health
.
2021; 23(6):1179–1186.
• Woodworth KR, Reynolds MR, Burkel V, et al. A preparedness model for mother-baby linked
longitudinal surveillance for emerging threats.
Matern Child Health J
. 2021;25(2):198-206.
Posters and Presentations
• Ahmed S, Khan A, Khatun U, et al. Laying the groundwork for a Hep Free NYC South Asian
Hepatitis Initiative to improve awareness and access to care. Presented at 2021 Hep B
United/TB Elimination Alliance Summit. Nov 2021.
• Chu A, Mcleod A, Shaikh D, et al. Lessons of implementing integrated hepatitis C treatment
services in a community-based opioid treatment program in New York City. Presented at APHA
2021 Annual Meeting and Expo. Oct 2021.
• Guerra K, Bocour A. Identifying hepatitis C reinfection among previously cured individuals with
recurrent hepatitis C viremia in New York City. Presented at 2021 Council of State and
Territorial Epidemiologists (CSTE) Annual Conference. Jun 2021.
• Guerra K, Bocour A. Using surveillance data to prospectively detect spatiotemporal clusters of
newly reported chronic hepatitis C virus infections in New York City, July 2017–January 2020.
Presented at 2021 Council of State and Territorial Epidemiologists (CSTE). Jun 2021.
• Tang L, Bocour A, Mikati T, et al. Improving hepatitis B and C care by increasing NYC Health
Department screening and patient navigation services collaboration. Presented at 2021 Hep B
United/TB Elimination Alliance Summit. Nov 2021.
53
References and Resources
Local and national hepatitis B and C epidemiological data:
• EpiQuery: Provides data on the health of New Yorkers from a variety of sources, including
surveys, surveillance data and vital records (births and deaths):
a816-health.nyc.gov/hdi/epiquery.
• New York City Department of Health and Mental Hygiene Hepatitis A, B and C Reports:
www1.nyc.gov/site/doh/data/data-publications/hepatitis-abc-surveillance-data.page.
• Moore MS, Bocour A, Winters A. Surveillance-based estimate of chronic hepatitis B prevalence,
New York City, 2016.
Public Health Reports.
2019; 134(6):695-702.
• Bocour A, Greene SK, Laraque F, Winters A. Estimating the prevalence of chronic hepatitis C
virus infection in New York City, 2015.
Epidemiol Infect
. 2018;146(12):1537-1542.
Viral hepatitis elimination planning:
• World Health Organization. Combating hepatitis B and C to reach elimination by 2030. Geneva,
2016. apps.who.int/iris/bitstream/handle/10665/206453/WHO_HIV_2016.04_eng.pdf.
• National Academies of Sciences, Engineering and Medicine, “A National Strategy for the
Elimination of Hepatitis B and C: Phase Two Report”: nap.edu/24731.
• New York State Health Department, “Viral Hepatitis Strategic Plan 2016-2020”:
health.ny.gov/publications/1806.pdf.
• New York State Health Department, “New York State Hepatitis C Elimination Plan”:
health.ny.gov/diseases/communicable/hepatitis/hepatitis_c/docs/hepatitis_c_elimination_pla
n.pdf.
Clinical guidance on hepatitis screening, care and treatment:
• New York City Department of Health and Mental Hygiene, 2018. “Diagnosing and Managing
Hepatitis C”: www1.nyc.gov/assets/doh/downloads/pdf/chi/chi-37-2.pdf.
• New York City Department of Health and Mental Hygiene, 2018. “Diagnosing and Managing
Hepatitis B”: www1.nyc.gov/assets/doh/downloads/pdf/chi/chi-37-4.pdf.
• American Association for the Study of Liver Diseases Practice Guidelines:
aasld.org/practice-guidelines.
• Schillie S, Wester C, Osborne M, Wesolowski L, Ryerson AB. CDC recommendations for hepatitis
C screening among adults—United States, 2020.
MMWR Recommendations and Reports
. 2020
Apr 3;69(2):1.
• Dieterich DT, Ahn J, Bacon B, et al. A simplified algorithm for the management of hepatitis C
infection.
Gastroenterology & Hepatology
. 2019 May;15(5 Suppl 3):1.
• Weng MK, Doshani M, Khan MA, et al. Universal hepatitis B vaccination in adults aged 19–59
years: Updated recommendations of the Advisory Committee on Immunization Practices—
United States, 2022.
MMWR Morb Mortal Wkly Rep
. 2022;71:477–483.
For interpreting Health Department surveillance data:
• CSTE case definitions: ndc.services.cdc.gov.
• NTAs: www1.nyc.gov/site/planning/data-maps/open-data/dwn-nynta.page.

›› Appendices
54
Appendices
›› Appendices
55
Appendix 1: Surveillance technical data notes
When interpreting NYC hepatitis B and C surveillance data, please note:
• This report includes surveillance data on people who meet the CSTE’s current case definition for
chronic hepatitis C confirmed or probable cases, which was implemented in 2016. Therefore,
cases that are antibody positive with only negative RNA results are excluded from most
analyses, unless otherwise specified. For more information, visit ndc.services.cdc.gov.
• Laboratories are required to report positive hepatitis B and C tests to the Health Department, as
well as negative results for hepatitis C RNA tests and hepatitis B DNA tests. For more
information about hepatitis labs reportable to the Health Department, visit
wadsworth.org/sites/default/files/WebDoc/CDRG%20NYState%202020_101920%202.pdf.
• The Health Department often receives more than one hepatitis B or C laboratory report per
person and uses automatic deduplication methods to identify multiple reports for the same
person based on name, date of birth and other information. Only the first report is counted in
the counts of newly reported cases for the year in which the person was first reported.
• The Health Department does not investigate all chronic hepatitis B and C cases, so only minimal
information — patient name, address, date of birth and sex — from laboratory reports is
available. Gender identity (how one lives or sees themselves — for example: woman,
transgender woman, man, transgender man, nonbinary person, gender-nonconforming) is not
consistently reported by all laboratories and is therefore underreported.
• The Health Department investigates all positive hepatitis B core IgM antibody reports and other
positive hepatitis B reports that include significantly elevated liver function tests as potential
cases of acute hepatitis B.
• Veterans Affairs (VA) health care facilities began reporting cases through routine surveillance at
the end of 2016; therefore, people with viral hepatitis who receive health care at only VA
facilities are not fully represented in this report.
• Differences in data between this report and previous reports may be related to factors such as
delays in disease reporting, correction of errors and refinements in data processing (for
example, the removal of duplicate reports).
• Many people with acute hepatitis B or C have no or mild symptoms. As a result, these infections
might not be diagnosed at the time of infection. Therefore, surveillance data underestimate the
true incidence of acute hepatitis B and C in NYC.
• Neighborhood poverty based on ZIP code was defined as the percentage of residents with
incomes below 100% of the Federal Poverty Level (FPL), per American Community Survey data
from 2016 to 2020. Neighborhood poverty categories are defined as follows:
• Low (less than 10% below FPL)
• Medium (10% to less than 20% below FPL)
• High (20% to less than 30% below FPL)
• Very high (greater than or equal to 30% below FPL)
These categories are not applied to people whose first or most recently reported address is a
NYC correctional facility.
• All people reported from a NYC correctional facility have been aggregated to Rikers Island in
maps.
• Many patients with chronic hepatitis B or C are asymptomatic; as a result, many cases are not
diagnosed or reported. Therefore, surveillance data underestimate the true level of chronic
hepatitis B and C in NYC.
• Ten-year trends are shown for hepatitis A, chronic hepatitis B and C. Years prior to 2012 can be
found on EpiQuery: a816-health.nyc.gov/hdi/epiquery.
›› Appendices
56
Rates
• Rates presented include people newly reported to the Health Department. They are not
prevalence rates or incidence rates.
• Age adjustment was performed using the following age categories: 0-24, 25-44, 45-64, 65-84
and ≥ 85 years, and weighted to the U.S. 2000 standard population.
• Rates stratified by age group are presented as age-specific rates (in other words, no age
adjusting within a presented age stratum was performed).
• Denominators used throughout this report are intercensal estimates for 2020, except
denominators for the Rikers Island population, which were provided by NYC Correctional Health
Services.
• The jail at Rikers Island is part of the Bronx, although it has a Queens ZIP code (11370; note
that ZIP code 11370 also includes parts of mainland Queens). Therefore, for numbers and rates
presented by borough, Rikers Island cases are included with other Bronx cases.
• The Health Department is presenting maps using NYC NTAs, which are aggregations of census
tracts that are subsets of NYC’s 55 Public Use Microdata Areas. For details on NTAs, please see
www1.nyc.gov/site/planning/data-maps/open-data/dwn-nynta.page.
Prevalence Estimates
• Hepatitis B and C prevalence estimates were updated for 2017 and used the methods
described in Moore MS, et al. Surveillance-based estimate of chronic hepatitis B prevalence,
New York City, 2016, and Bocour A, et al. Estimating the prevalence of chronic hepatitis C virus
infection in New York City, 2015. Estimates will be updated annually contingent upon data
availability.
Death Data
• Deaths occurring outside NYC or those of non-NYC residents are not included.
• Both underlying and contributing causes are included. Underlying cause of death is the disease
or condition that set off the chain of events leading to death. Contributing causes of death are
diseases, morbid conditions or injuries that either resulted in or contributed to death.
• Causes of death are coded using ICD-10 classifications. The codes used for hepatitis B are B16,
B170, B180 and B181; and the codes used for hepatitis C are B171 and B182. Both acute and
chronic hepatitis B and C are included as causes of death.
• Causes of death are not mutually exclusive.
• The population used in the rate constructions are based on the Census 2020 population
estimates, 2021 vintage. However, the 2020 Census counts are substantially higher than the
estimates, rendering rates potentially overestimated.
›› Appendices
57
Appendix 2: Hepatitis A, B and C reporting in NYC
Laboratories are required to electronically report chronic hepatitis B and C tests to the Health
Department. Providers should report all hepatitis A (IgM positive), and acute B and acute C cases
(based on clinical criteria, such as jaundice) to the Health Department. The Health Department uses
demographic and risk information to determine the characteristics of those infected with acute
hepatitis B and C and to prevent ongoing transmission.
Health care providers can report hepatitis A, B and C cases:
• Online: Visit nyc.gov/nycmed.
• By mail: Download the Universal Reporting Form at
www1.nyc.gov/assets/doh/downloads/pdf/hcp/urf-0803.pdf.
• By phone: Call the Health Department’s Provider Access Line (PAL) at 866-NYC-DOH1
(866-692-3641).

›› Appendices
58
Appendix 3: Characteristics of people reported with confirmed hepatitis A infection in NYC, 2021
Characteristics Number
Percentage of
each group
Rate per
100,000 people
Overall
89
100.0
1.1
Sex
Female
19
21.4
0.4
Male
70
78.7
1.8
Age at time of report
0–9
1
1.1
0.1
10–19
0
0.0
0.0
20–29
16
18.0
1.3
30–39
30
33.7
2.3
40–49
22
24.7
2.2
50–59
11
12.4
1.1
≥ 60
9
10.1
0.5
Borough of residence
Bronx
12
13.5
0.9
Brooklyn
28
31.5
1.1
Manhattan
24
27.0
1.5
Queens
19
21.4
0.9
Staten Island
6
6.7
1.3
Neighborhood poverty level by ZIP code
Low (< 10% below poverty)
10
11.2
0.6
Medium (10 to < 20%)
35
39.3
1.0
High (20 to < 30%)
30
33.7
1.7
Very high (≥ 30%)
14
15.7
1.3
Race and ethnicity
Asian, non-Latino/a
6
6.7
0.5
Black, non-Latino/a
17
19.1
0.9
Latino/a
32
36.0
1.3
White, non-Latino/a
27
30.3
1.0
Other
4
4.5
2.2
Unknown
3
3.4
N/A
Risk factors (not mutually exclusive)
Drug use
47
52.8
N/A
Homelessness
27
30.3
N/A
MSM
18
20.2
N/A
International travel
13
14.6
N/A
Contact with a person with
hepatitis A
4 4.5 N/A
Incarceration within 6 months
before diagnosis
3 3.4 N/A
Unknown
23
25.8
N/A

›› Appendices
59
Appendix 4: Characteristics of people reported with acute hepatitis B in NYC, 2021
Characteristics Number
Percentage of
each group
Rate per
100,000 people
Overall
44
100.0
0.5
Sex
Female
18
40.9
0.4
Male
26
59.1
0.7
Age at time of first report
0–19
0
0.0
0.0
20–29
3
6.8
0.2
30–39
8
18.2
0.6
40–49
14
31.8
1.4
50–59
6
13.6
0.6
≥ 60
13
29.5
0.7
Borough of residence
Bronx
10
22.7
0.7
Brooklyn
11
25.0
0.4
Manhattan
9
20.5
0.6
Queens
10
22.7
0.4
Staten Island
4
9.1
0.8
Neighborhood poverty level by ZIP code
Low (< 10% below poverty)
9
20.5
0.5
Medium (10 to < 20%)
14
31.8
0.4
High (20 to < 30%)
10
22.7
0.6
Very high (≥ 30%)
11
25.0
1.0
Race and ethnicity
Asian, non-Latino/a
4
9.1
0.3
Black, non-Latino/a
12
27.3
0.7
Latino/a
6
13.6
0.3
White, non-Latino/a
11
25.0
0.4
Multi-race
1
2.3
0.7
Unknown
10
22.7
N/A
Risk factors (mutually exclusive
1
)
Injection drug use (IDU)
3
6.8
N/A
Household contact with a person with
hepatitis B
0 0.0 N/A
MSM
3
6.8
N/A
Heterosexual contact
6
13.6
N/A
Health care-related exposure
2
4.6
N/A
Other
1
2.3
N/A
Unknown
29
65.9
N/A
1
“Mutually exclusive” means that each patient is represented by the risk factor that poses the
highest risk of hepatitis B infection. For example, a person who injected drugs and had a health
care-related exposure is represented only once, in the Injection drug use row. The table lists risk
factors from highest to lowest risk.

›› Appendices
60
Appendix 5: Characteristics of people reported with chronic hepatitis B in NYC, 2021
Characteristics
People newly reported in 2021
All people reported
2018–2021, regardless
of year of first report
Number
Percentage of
each group
Rate per
100,000 people
Number
Percentage of
each group
Overall
5,346
100.0
64.8
101,066
100.0
Sex
1
Female
2,312
43.2
53.6
41,778
44.7
Male
3,031
56.7
77.0
51,527
55.2
Unknown
2
0.1
N/A
98
0.1
Age at time of first report
0–19
115
2.2
6.2
4,380
4.7
20–29
643
12.0
52.3
20,131
21.6
30–39
1,440
26.9
108.1
25,467
27.3
40–49
1,186
22.2
116.0
20,341
21.8
50–59
950
17.8
93.3
13,664
14.6
60–69
624
11.7
70.6
6,826
7.3
≥ 70
388
7.3
42.9
2,595
2.8
Borough of residence
Bronx
2
766
14.3
54.7
9,813
10.5
Brooklyn
1,789
33.5
70.5
34,059
36.5
Manhattan
699
13.1
43.4
17,573
18.8
Queens
1,631
30.5
73.3
28,408
30.4
Staten Island
255
4.8
53.6
2,127
2.3
Unknown
206
3.9
N/A
1,424
1.5
Neighborhood poverty level by ZIP code
3
Low (< 10% below
poverty)
733
13.7
40.4
12,629
13.5
Medium (10 to < 20%)
2,089
39.2
57.5
36,599
39.2
High (20 to < 30%)
1,599
30.0
92.1
30,844
33.1
Very high (≥ 30%)
704
13.2
65.8
11,404
12.2
Unknown
209
3.9
N/A
1,805
1.9
1
People reported as transgender are excluded, as gender identity is not consistently reported by all
laboratories and is therefore underreported.
2
The Bronx includes 10 people reported in Rikers Island facilities and 118 people in 2018–2021.
3
Neighborhood poverty level data excludes people incarcerated at the time of first report. In 2021,
there were 12 newly reported people incarcerated at the time of first report. In 2018–2021, there
were 190 people who were incarcerated at the time of their most recent report.

›› Appendices
61
Appendix 6: Number and rate of people newly reported with chronic hepatitis B by NTA in NYC, 2021
1
NTA name (code)
Number
of
cases
Rate per
100,000
people
NTA name (code)
Number
of
cases
Rate per
100,000
people
Allerton-Pelham
Gardens (BX31)
15
48.4
Cambria Heights
(QN33)
4
19.0
Annadale-Huguenot-
Prince’s Bay-Eltingville
(SI01)
8
27.5
Canarsie (BK50)
52
62.1
Carroll Gardens-
Columbia Street-Red
Hook (BK33)
6
13.9
Arden Heights (SI48)
12
45.6
Astoria (QN70)
37
53.0
Central Harlem North-
Polo Grounds (MN03)
60
73.2
Auburndale (QN48)
35
176.0
Baisley Park (QN76)
12
33.4
Central Harlem South
(MN11)
34
71.6
Bath Beach (BK27)
28
83.4
Battery Park City-Lower
Manhattan (MN25)
18
40.5
Charleston-Richmond
Valley-Tottenville (SI11)
5
22.1
Bay Ridge (BK31)
35
44.8
Chinatown (MN27)
86
191.4
Bayside-Bayside Hills
(QN46)
28
66.9
Claremont-Bathgate
(BX01)
24
71.4
Bedford (BK75)
15
19.6
Clinton (MN15)
30
53.5
Bedford Park-Fordham
North (BX05)
28
49.5
Clinton Hill (BK69)
13
34.1
Co-op City (BX13)
22
46.4
Bellerose (QN43)
15
56.1
College Point (QN23)
27
113.4
Belmont (BX06)
11
40.3
Corona (QN25)
44
80.4
Bensonhurst East
(BK29)
83
126.1
Crotona Park East
(BX75)
17
72.8
Bensonhurst West
(BK28)
156
173.4
Crown Heights North
(BK61)
55
51.9
Borough Park (BK88)
98
99.7
Crown Heights South
(BK63)
19
49.8
Breezy Point-Belle
Harbor-Rockaway
Park-Broad Channel
(QN10)
8
29.9
Cypress Hills-City Line
(BK83)
18
39.0
Douglas Manor-
Douglaston-Little Neck
(QN45)
18
36.1
Briarwood-Jamaica
Hills (QN35)
20
46.7
Brighton Beach (BK19)
30
86.9
DUMBO-Vinegar Hill-
Downtown Brooklyn-
Boerum Hill (BK38)
15
60.3
Bronxdale (BX07)
13
33.8
Brooklyn Heights-
Cobble Hill (BK09)
4
16.7
Dyker Heights (BK30)
88
201.3
Brownsville (BK81)
25
52.4
East Concourse-
Concourse Village
(BX14)
54
85.5
Bushwick North
(BK77)
13
24.7
Bushwick South
(BK78)
27
35.8
East Elmhurst (QN27)
5
27.9
East Flatbush-Farragut
(BK91)
29
57.7
1
290 people could not be assigned to an NTA based on their address at first report.

›› Appendices
62
Appendix 6: Number and rate of people newly reported with chronic hepatitis B by NTA in NYC, 2021
NTA name (code)
Number
of
cases
Rate per
100,000
people
NTA name (code)
Number
of
cases
Rate per
100,000
people
East Flushing (QN52)
71
283.6
Greenpoint (BK76)
5
13.2
East Harlem North
(MN34)
20
34.0
Grymes Hill-Clifton-Fox
Hills (SI08)
23
105.0
East Harlem South
(MN33)
25
44.1
Hamilton Heights
(MN04)
14
28.0
East New York (BK82)
44
46.9
Hammels-Arverne-
Edgemere (QN12)
16
39.5
East New York
(Pennsylvania Ave)
(BK85)
20
75.5
Highbridge (BX26)
30
80.4
Hollis (QN07)
10
49.5
East Tremont (BX17)
38
89.0
Homecrest (BK25)
18
41.0
East Village (MN22)
13
32.2
Hudson Yards-Chelsea-
Flatiron-Union Square
(MN13)
32
39.4
East Williamsburg
(BK90)
10
28.2
Eastchester-Edenwald-
Baychester (BX03)
11
29.5
Hunters Point-
Sunnyside-West
Maspeth (QN31)
38
50.8
Elmhurst (QN29)
110
136.3
Elmhurst-Maspeth
(QN50)
36
153.3
Hunts Point (BX27)
10
39.2
Jackson Heights
(QN28)
42
43.8
Erasmus (BK95)
15
54.8
Far Rockaway-
Bayswater (QN15)
15
27.0
Jamaica (QN61)
29
54.1
Jamaica Estates-
Holliswood (QN06)
10
36.8
Flatbush (BK42)
62
62.0
Flatlands (BK58)
24
35.3
Kensington-Ocean
Parkway (BK41)
18
52.4
Flushing (QN22)
281
400.1
Fordham South (BX40)
21
77.7
Kew Gardens (QN60)
6
27.7
Forest Hills (QN17)
35
40.8
Kew Gardens Hills
(QN37)
23
63.6
Fort Greene (BK68)
9
28.0
Fresh Meadows-Utopia
(QN41)
18
94.9
Kingsbridge Heights
(BX30)
13
39.1
Ft. Totten-Bay Terrace-
Clearview (QN47)
12
54.9
Laurelton (QN66)
5
19.5
Lenox Hill-Roosevelt
Island (MN31)
33
40.5
Georgetown-Marine
Park-Bergen Beach-
Mill Basin (BK45)
10
21.9
Lincoln Square (MN14)
18
27.8
Lindenwood-Howard
Beach (QN57)
6
22.0
Glen Oaks-Floral Park-
New Hyde Park (QN44)
7
28.8
Longwood (BX33)
13
47.7
Glendale (QN19)
7
20.9
Lower East Side
(MN28)
52
74.2
Gramercy (MN21)
3
11.8
Grasmere-Arrochar-Ft.
Wadsworth (SI14)
11
65.8
Madison (BK44)
21
51.4
Manhattanville (MN06)
9
39.9
Gravesend (BK26)
24
80.1
Marble Hill-Inwood
(MN01)
15
29.6
Great Kills (SI54)
14
34.2

›› Appendices
63
Appendix 6: Number and rate of people newly reported with chronic hepatitis B by NTA in NYC, 2021
NTA name (code)
Number
of cases
Rate per
100,000
people
NTA name (code)
Number
of
cases
Rate per
100,000
people
Mariner’s Harbor-
Arlington-Port Ivory-
Graniteville (SI12)
23
69.8
Old Town-Dongan Hills-
South Beach (SI36)
23
86.5
Ozone Park (QN56)
15
66.2
Maspeth (QN30)
24
76.2
Park Slope-Gowanus
(BK37)
19
26.0
Melrose South-Mott
Haven North (BX34)
18
43.4
Parkchester (BX46)
24
78.5
Middle Village (QN21)
20
50.5
Pelham Bay-Country
Club-City Island (BX10)
10
37.7
Midtown-Midtown
South (MN17)
25
78.4
Pelham Parkway
(BX49)
13
46.2
Midwood (BK43)
32
61.0
Morningside Heights
(MN09)
18
34.7
Pomonok-Flushing
Heights-Hillcrest
(QN38)
24
69.3
Morrisania-Melrose
(BX35)
26
65.7
Port Richmond (SI28)
6
30.8
Mott Haven-Port
Morris (BX39)
18
35.0
Prospect Heights
(BK64)
6
27.3
Mount Hope (BX41)
56
106.8
Prospect Lefferts
Gardens-Wingate
(BK60)
30
44.9
Murray Hill (QN51)
83
165.3
Murray Hill-Kips Bay
(MN20)
17
35.8
Queens Village (QN34)
17
32.0
New Brighton-Silver
Lake (SI35)
15
86.9
Queensboro Hill
(QN62)
55
275.2
New Dorp-Midland
Beach (SI45)
18
85.5
Queensbridge-
Ravenswood-Long
Island City (QN68)
17
77.0
New Springville-
Bloomfield-Travis
(SI05)
21
48.1
Rego Park (QN18)
11
39.4
Richmond Hill (QN54)
34
56.4
North Corona (QN26)
22
43.5
Ridgewood (QN20)
21
29.5
North Riverdale-
Fieldston-Riverdale
(BX22)
4
14.5
Rikers Island (BX98)
12
82.7
Rosedale (QN05)
10
39.5
Rossville-Woodrow
(SI32)
4
19.1
North Side-South Side
(BK73)
15
24.3
Rugby-Remsen Village
(BK96)
27
50.8
Norwood (BX43)
33
84.5
Oakland Gardens
(QN42)
25
85.6
Schuylerville-Throgs
Neck-Edgewater Park
(BX52)
12
27.3
Oakwood-Oakwood
Beach (SI25)
10
48.8
Seagate-Coney Island
(BK21)
22
72.1
Ocean Hill (BK79)
16
46.4
Ocean Parkway South
(BK46)
5
25.2
Old Astoria (QN71)
7
29.1

›› Appendices
64
Appendix 6: Number and rate of people newly reported with chronic hepatitis B by NTA in NYC, 2021
NTA name (code)
Number
of
cases
Rate per
100,000
people
NTA name (code)
Number
of
cases
Rate per
100,000
people
Sheepshead Bay-
Gerritsen Beach-
Manhattan Beach
(BK17)
43
66.6
Upper East Side-
Carnegie Hill (MN40)
6
10.6
Upper West Side
(MN12)
30
23.0
SoHo-TriBeCa-Civic
Center-Little Italy
(MN24)
21
48.5
Van Cortlandt Village
(BX28)
22
44.5
Van Nest-Morris Park-
Westchester Square
(BX37)
21
76.9
Soundview-Bruckner
(BX55)
15
41.6
Soundview-Castle Hill-
Clason Point-Harding
Park (BX09)
14
25.8
Washington Heights
North (MN35)
11
15.7
Washington Heights
South (MN36)
24
27.1
South Jamaica (QN01)
20
47.8
South Ozone Park
(QN55)
28
36.0
West Brighton (BK23)
6
32.0
West Concourse (BX63)
22
59.2
Springfield Gardens
North (QN02)
6
22.4
West Farms-Bronx
River (BX08)
15
43.3
Springfield Gardens
South-Brookville
(QN03)
11
51.8
West New Brighton-
New Brighton-St.
George (SI22)
19
60.1
Spuyten Duyvil-
Kingsbridge (BX29)
3
9.7
West Village (MN23)
10
15.7
Westchester-Unionport
(BX59)
8
28.3
St. Albans (QN08)
16
31.0
Stapleton-Rosebank
(SI37)
21
80.8
Westerleigh (SI07)
6
24.3
Whitestone (QN49)
34
109.9
Starrett City (BK93)
5
39.7
Williamsbridge-Olinville
(BX44)
33
50.2
Steinway (QN72)
16
36.0
Stuyvesant Heights
(BK35)
19
28.6
Williamsburg (BK72)
1
3.0
Windsor Terrace
(BK40)
2
8.8
Stuyvesant Town-
Cooper Village (MN50)
3
12.6
Woodhaven (QN53)
35
60.9
Sunset Park East
(BK34)
383
600.7
Woodlawn-Wakefield
(BX62)
13
29.9
Sunset Park West
(BK32)
47
91.6
Woodside (QN63)
35
86.1
Yorkville (MN32)
22
28.5
Todt Hill-Emerson Hill-
Heartland Village-
Lighthouse Hill (SI24)
12
36.3
Turtle Bay-East
Midtown (MN19)
17
33.8
University Heights-
Morris Heights (BX36)
44
79.7
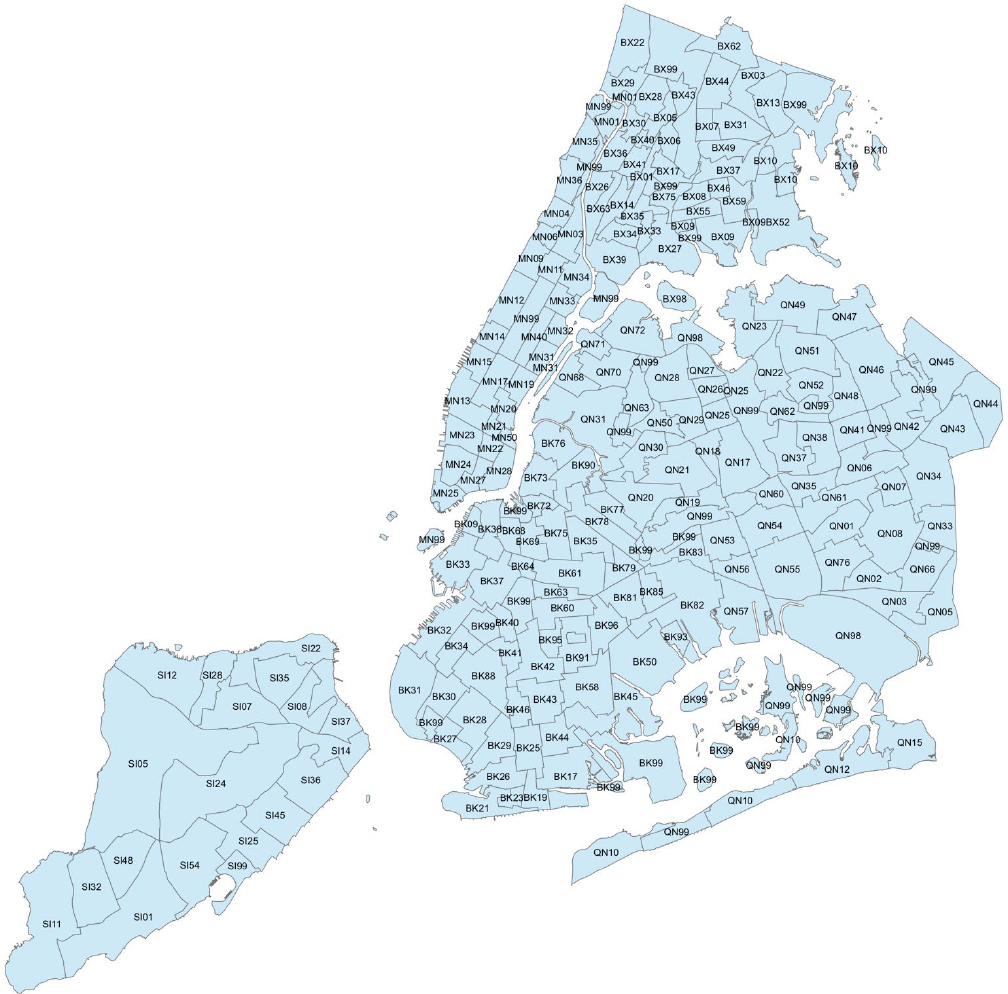
›› Appendices
65
Appendix 7: NYC NTAs

›› Appendices
66
Appendix 8: Demographic characteristics of pregnant people living with hepatitis B in NYC who
delivered a live infant in 2021
Characteristics Number
Percentage of
each group
Overall
676
100.0
Borough of residence
Bronx
122
18.1
Brooklyn
253
37.4
Manhattan
64
9.5
Queens
200
29.6
Staten Island
37
5.5
Race and ethnicity
Asian/Pacific Islander, non-Latino/a
400
59.2
Black, non-Latino/a
164
24.3
Latino/a
24
3.6
White, non-Latino/a
61
9.0
Other
25
3.7
Unknown
2
0.3
Country of birth
China
301
44.5
Uzbekistan
35
5.2
U.S.
34
5.0
Ghana
28
4.1
Guinea
21
3.1
Nigeria
18
2.7
Bangladesh
17
2.5
Dominican Republic
15
2.2
Liberia
13
1.9
Senegal
13
1.9
Unknown
3
0.4
Other
178
26.3

›› Appendices
67
Appendix 8: Demographic characteristics of pregnant people living with hepatitis B in NYC who
delivered a live infant in 2021 (continued)
Characteristics Number
Percentage of
each group
Region of birth
1
China
301
44.5
Western Africa
152
22.5
West and Central Asia
39
5.8
U.S.
34
5.0
Caribbean
30
4.4
South Asia
29
4.3
Europe
23
3.4
Mexico, Central and South America
22
3.3
East Asia (excluding China)
19
2.8
Southeast Asia
12
1.8
Middle East
8
1.2
Africa (excluding Western Africa)
4
0.6
Unknown
3
0.4
1
Includes countries counted as separate regions for comparison with larger regions. Excludes
regions that were not reported as a region of birth for any reported person (Australia/Oceania,
Canada and Pacific Islands).

›› Appendices
68
Appendix 9: Hepatitis B vaccination, post-exposure prophylaxis (PEP) and testing among infants born
in 2020 to pregnant people living with hepatitis B, NYC
Characteristics Number
Percentage of
each group
Overall
766
100.0
PEP
1
and vaccination status
PEP
759
99.1
Vaccine series
completion
2
743 97.0
PEP and vaccine
series completion
737 96.2
Testing status
Tested
705
92.0
Not tested
61
8.0
Test results
3
Infected
2
0.3
Immune
694
98.4
Susceptible
3
0.4
Indeterminate
6
0.9
1
Defined as administration of hepatitis B immune globulin and birth dose of hepatitis B vaccine
series within one day of birth
2
Defined as receiving three valid doses of hepatitis B vaccine including a dose given at age greater
than or equal to 164 days. People counted in this category may or may not have received PEP as
defined in footnote 1.
3
Percentage calculated out of those tested (n=705)

›› Appendices
69
Appendix 10: Characteristics of decedents where hepatitis B is listed as the underlying cause or
contributing cause of death, NYC, 2020
Characteristics Number
Percentage of
each group
Age-adjusted rate per
100,000 people
1
Overall
90
100
0.9
Sex
Female
22
24.4
0.4
Male
68
75.6
1.6
Race and ethnicity
Asian/Pacific Islander, non-
Latino/a
38
42.2
2.6
Black, non-Latino/a
19
21.1
0.9
Latino/a
18
20.0
0.7
White, non-Latino/a
13
14.4
0.4
Other/Unknown
2
2.2
N/A
Age
Age-specific rate per
100,000 population
1
0–24
0
0
0.0
25–44
6
6.7
0.2
45–64
32
35.6
1.6
65–84
44
48.9
3.9
≥ 85
8
8.9
4.4
1
The population used in the rate constructions are based on the Census 2020 population
estimates, 2021 vintage. However, the 2020 Census counts are substantially higher than the
estimates rendering rates potentially overestimated.

›› Appendices
70
Appendix 11: Leading causes of deaths among decedents with hepatitis B in 2020, by number
All Decedents
Cause of death
Number
Cancer
349
COVID-19
349
Heart diseases
330
Diabetes
62
Drug-related
57
HIV
42
Influenza and pneumonia
41
Cerebrovascular disease
34
Essential hypertension and renal
diseases
32
Viral hepatitis
28
All other causes
289
Total
1,613
Premature Decedents
Cause of death
Number
Cancer
157
COVID-19
112
Heart diseases
99
Drug-related
51
HIV
28
Cerebrovascular disease
13
Viral hepatitis
12
Accidents except drug poisoning
11
Influenza and pneumonia
11
Diabetes
10
Chronic liver disease and cirrhosis
10
All other causes
106
Total
620

›› Appendices
71
Appendix 12: Characteristics of people reported with chronic hepatitis C in NYC, 2021
Characteristics
People newly reported in 2021
All people reported
2018–2021, regardless
of year of first report
Number
Percentage of
each group
Rate per
100,000 people
Number
Percentage of
each group
Overall
2,832
100.0
35.7
81,490
100.0
Sex
1
Female
1,043
36.8
25.1
30,609
37.6
Male
1,781
62.9
47.1
50,784
62.3
Unknown
7
0.3
N/A
93
0.1
Age at time of first report
2
3–19
36
1.3
2.3
801
0.0
20–29
345
12.2
28.1
6,741
8.3
30–39
574
20.3
43.1
14,325
1.0
40–49
464
16.4
45.4
23,360
17.6
50–59
520
18.4
51.1
22,800
28.7
60–69
495
17.5
56.0
9,924
28.0
≥ 70
398
14.1
44.0
3,512
12.2
Unknown
N/A
N/A
N/A
27
4.3
Birth cohort
1900–1944
161
5.7
33.9
5,690
7.0
1945–1965
975
34.4
56.9
48,803
59.9
1966–1983
898
31.7
47.7
19,753
24.2
1984–2018
798
28.2
20.6
7,244
8.9
Borough of residence
Bronx
3
655
23.1
48.8
21,447
26.3
Brooklyn
833
29.4
34.3
24,039
29.5
Manhattan
616
21.8
39.4
18,139
22.3
Queens
596
21.0
27.8
14,295
17.5
Staten Island
132
4.7
28.7
3,569
4.4
Unknown
N/A
N/A
N/A
1
0.0
Neighborhood poverty level by ZIP code
4
Low (< 10% below
poverty)
439
15.8
25.0
10,885
13.6
Medium (10 to < 20%)
1,144
41.0
32.7
29,801
37.1
High (20 to < 30%)
643
23.1
38.6
18,992
23.7
Very high (≥ 30%)
558
20.0
54.8
18,368
22.9
Unknown
4
0.1
N/A
2,195
2.7
1
People reported as transgender are excluded, as gender identity is not consistently reported by all
laboratories. In 2021, there was one person reported with a transgender identity.
2
People newly reported in 2021 ages 0 to 2 years are classified using the 2018 CDC perinatal
hepatitis C case definition and are reported in Appendix 13.
3
The Bronx includes forty people reported from Rikers Island facilities.
4
Neighborhood poverty level data excludes people incarcerated at the time of first report. In 2021,
there were forty-four newly reported people incarcerated at the time of first report. In 2018–2021,
there were 3,523 people incarcerated at time of their most recent report.

›› Appendices
72
Appendix 13: Number and rate of people newly reported with chronic hepatitis C by NTA in NYC, 2021
1
NTA name (code)
Number
of
cases
Rate per
100,000
people
NTA name (code)
Number
of
cases
Rate per
100,000
people
Allerton-Pelham
Gardens (BX31)
8
26.7
Cambria Heights
(QN33)
4
19.5
Annadale-Huguenot-
Prince’s Bay-Eltingville
(SI01)
4
14.1
Canarsie (BK50)
21
26.0
Carroll Gardens-
Columbia Street-Red
Hook (BK33)
20
48.7
Arden Heights (SI48)
4
15.7
Astoria (QN70)
14
20.6
Central Harlem North-
Polo Grounds (MN03)
50
63.3
Auburndale (QN48)
7
36.3
Baisley Park (QN76)
14
40.4
Central Harlem South
(MN11)
21
46.0
Bath Beach (BK27)
10
31.1
Battery Park City-Lower
Manhattan (MN25)
10
23.4
Charleston-Richmond
Valley-Tottenville (SI11)
6
27.4
Bay Ridge (BK31)
13
17.3
Chinatown (MN27)
9
20.5
Bayside-Bayside Hills
(QN46)
13
32.0
Claremont-Bathgate
(BX01)
22
68.9
Bedford (BK75)
16
22.3
Clinton (MN15)
33
60.1
Bedford Park-Fordham
North (BX05)
24
44.6
Clinton Hill (BK69)
8
21.9
Co-op City (BX13)
8
17.3
Bellerose (QN43)
6
23.2
College Point (QN23)
5
21.9
Belmont (BX06)
10
38.3
Corona (QN25)
13
24.8
Bensonhurst East
(BK29)
24
37.9
Crotona Park East
(BX75)
12
53.7
Bensonhurst West
(BK28)
28
32.3
Crown Heights North
(BK61)
35
34.4
Borough Park (BK88)
17
19.0
Crown Heights South
(BK63)
8
22.1
Breezy Point-Belle
Harbor-Rockaway
Park-Broad Channel
(QN10)
10
38.5
Cypress Hills-City Line
(BK83)
11
24.9
Douglas Manor-
Douglaston-Little Neck
(QN45)
18
37.8
Briarwood-Jamaica
Hills (QN35)
7
17.0
Brighton Beach (BK19)
29
86.7
DUMBO-Vinegar Hill-
Downtown Brooklyn-
Boerum Hill (BK38)
5
20.7
Bronxdale (BX07)
14
37.9
Brooklyn Heights-
Cobble Hill (BK09)
1
4.4
Dyker Heights (BK30)
9
21.4
Brownsville (BK81)
40
87.7
East Concourse-
Concourse Village
(BX14)
28
46.5
Bushwick North
(BK77)
15
29.8
Bushwick South
(BK78)
34
46.8
East Elmhurst (QN27)
6
34.8
East Flatbush-Farragut
(BK91)
8
16.4
1
One hundred twenty-one people could not be assigned to an NTA based on their address at first
report.

›› Appendices
73
Appendix 13: Number and rate of people newly reported with chronic hepatitis C by NTA in NYC, 2021
NTA name (code)
Number
of
cases
Rate per
100,000
people
NTA name (code)
Number
of
cases
Rate per
100,000
people
East Flushing (QN52)
5
20.7
Greenpoint (BK76)
10
27.0
East Harlem North
(MN34)
22
38.8
Grymes Hill-Clifton-Fox
Hills (SI08)
4
19.0
East Harlem South
(MN33)
28
51.1
Hamilton Heights
(MN04)
12
24.8
East New York (BK82)
32
35.6
Hammels-Arverne-
Edgemere (QN12)
13
33.6
East New York
(Pennsylvania Ave)
(BK85)
13
51.6
Highbridge (BX26)
21
59.0
Hollis (QN07)
6
30.6
East Tremont (BX17)
33
81.1
Homecrest (BK25)
15
35.9
East Village (MN22)
25
62.8
Hudson Yards-Chelsea-
Flatiron-Union Square
(MN13)
34
42.9
East Williamsburg
(BK90)
8
23.1
Eastchester-Edenwald-
Baychester (BX03)
7
19.5
Hunters Point-
Sunnyside-West
Maspeth (QN31)
20
27.8
Elmhurst (QN29)
20
25.8
Elmhurst-Maspeth
(QN50)
8
35.3
Hunts Point (BX27)
18
74.1
Jackson Heights
(QN28)
16
17.3
Erasmus (BK95)
11
41.8
Far Rockaway-
Bayswater (QN15)
23
43.8
Jamaica (QN61)
21
41.1
Jamaica Estates-
Holliswood (QN06)
6
22.8
Flatbush (BK42)
30
31.3
Flatlands (BK58)
19
29.0
Kensington-Ocean
Parkway (BK41)
7
21.4
Flushing (QN22)
26
38.1
Fordham South (BX40)
21
82.1
Kew Gardens (QN60)
7
33.6
Forest Hills (QN17)
18
21.9
Kew Gardens Hills
(QN37)
5
14.7
Fort Greene (BK68)
13
42.1
Fresh Meadows-Utopia
(QN41)
1
5.5
Kingsbridge Heights
(BX30)
13
40.9
Ft. Totten-Bay Terrace-
Clearview (QN47)
0
0.0
Laurelton (QN66)
8
31.9
Lenox Hill-Roosevelt
Island (MN31)
14
17.8
Georgetown-Marine
Park-Bergen Beach-
Mill Basin (BK45)
10
22.8
Lincoln Square (MN14)
13
20.9
Lindenwood-Howard
Beach (QN57)
5
18.9
Glen Oaks-Floral Park-
New Hyde Park (QN44)
2
8.4
Longwood (BX33)
16
61.7
Glendale (QN19)
7
21.7
Lower East Side
(MN28)
32
46.9
Gramercy (MN21)
2
8.0
Grasmere-Arrochar-Ft.
Wadsworth (SI14)
3
18.5
Madison (BK44)
11
28.0
Manhattanville (MN06)
5
22.9
Gravesend (BK26)
10
34.8
Marble Hill-Inwood
(MN01)
16
32.7
Great Kills (SI54)
10
25.2

›› Appendices
74
Appendix 13: Number and rate of people newly reported with chronic hepatitis C by NTA in NYC, 2021
NTA name (code)
Number
of cases
Rate per
100,000
people
NTA name (code)
Number
of
cases
Rate per
100,000
people
Mariner’s Harbor-
Arlington-Port Ivory-
Graniteville (SI12)
12
38.0
Old Town-Dongan Hills-
South Beach (SI36)
9
35.0
Ozone Park (QN56)
4
18.3
Maspeth (QN30)
7
23.1
Park Slope-Gowanus
(BK37)
16
22.9
Melrose South-Mott
Haven North (BX34)
25
63.1
Parkchester (BX46)
7
23.8
Middle Village (QN21)
3
7.8
Pelham Bay-Country
Club-City Island (BX10)
6
23.4
Midtown-Midtown
South (MN17)
19
60.8
Pelham Parkway
(BX49)
10
37.0
Midwood (BK43)
25
50.0
Morningside Heights
(MN09)
13
25.7
Pomonok-Flushing
Heights-Hillcrest
(QN38)
5
14.9
Morrisania-Melrose
(BX35)
27
71.6
Port Richmond (SI28)
7
37.4
Mott Haven-Port
Morris (BX39)
27
55.0
Prospect Heights
(BK64)
4
19.1
Mount Hope (BX41)
34
68.1
Prospect Lefferts
Gardens-Wingate
(BK60)
25
38.9
Murray Hill (QN51)
13
26.7
Murray Hill-Kips Bay
(MN20)
23
49.5
Queens Village (QN34)
19
37.0
New Brighton-Silver
Lake (SI35)
3
18.0
Queensboro Hill
(QN62)
5
25.9
New Dorp-Midland
Beach (SI45)
5
24.6
Queensbridge-
Ravenswood-Long
Island City (QN68)
16
75.2
New Springville-
Bloomfield-Travis
(SI05)
9
21.4
Rego Park (QN18)
11
40.7
Richmond Hill (QN54)
29
48.6
North Corona (QN26)
10
20.9
Ridgewood (QN20)
16
23.5
North Riverdale-
Fieldston-Riverdale
(BX22)
9
33.8
Rikers Island (BX98)
40
275.7
Rosedale (QN05)
9
36.8
Rossville-Woodrow
(SI32)
2
9.9
North Side-South Side
(BK73)
13
21.9
Rugby-Remsen Village
(BK96)
9
17.5
Norwood (BX43)
16
43.0
Oakland Gardens
(QN42)
2
7.1
Schuylerville-Throgs
Neck-Edgewater Park
(BX52)
11
25.9
Oakwood-Oakwood
Beach (SI25)
3
15.1
Seagate-Coney Island
(BK21)
18
61.1
Ocean Hill (BK79)
23
69.9
Ocean Parkway South
(BK46)
6
32.3
Old Astoria (QN71)
12
51.6

›› Appendices
75
Appendix 13: Number and rate of people newly reported with chronic hepatitis C by NTA in NYC, 2021
NTA name (code)
Number
of
cases
Rate per
100,000
people
NTA name (code)
Number
of
cases
Rate per
100,000
people
Sheepshead Bay-
Gerritsen Beach-
Manhattan Beach
(BK17)
37
59.2
Upper East Side-
Carnegie Hill (MN40)
9
16.3
Upper West Side
(MN12)
34
27.0
SoHo-TriBeCa-Civic
Center-Little Italy
(MN24)
15
36.0
Van Cortlandt Village
(BX28)
16
33.7
Van Nest-Morris Park-
Westchester Square
(BX37)
12
45.9
Soundview-Bruckner
(BX55)
11
32.0
Soundview-Castle Hill-
Clason Point-Harding
Park (BX09)
18
34.3
Washington Heights
North (MN35)
19
28.0
Washington Heights
South (MN36)
46
53.6
South Jamaica (QN01)
10
24.9
South Ozone Park
(QN55)
23
30.7
West Brighton (BK23)
7
38.1
West Concourse (BX63)
13
36.7
Springfield Gardens
North (QN02)
4
15.4
West Farms-Bronx
River (BX08)
11
33.3
Springfield Gardens
South-Brookville
(QN03)
4
19.7
West New Brighton-
New Brighton-St.
George (SI22)
16
52.7
Spuyten Duyvil-
Kingsbridge (BX29)
11
37.1
West Village (MN23)
11
17.7
Westchester-Unionport
(BX59)
7
25.8
St. Albans (QN08)
15
30.0
Stapleton-Rosebank
(SI37)
19
75.9
Westerleigh (SI07)
4
16.7
Whitestone (QN49)
3
10.0
Starrett City (BK93)
8
65.3
Williamsbridge-Olinville
(BX44)
18
28.6
Steinway (QN72)
13
30.1
Stuyvesant Heights
(BK35)
23
35.9
Williamsburg (BK72)
3
10.2
Windsor Terrace
(BK40)
4
18.5
Stuyvesant Town-
Cooper Village (MN50)
1
4.3
Woodhaven (QN53)
14
25.3
Sunset Park East
(BK34)
19
31.5
Woodlawn-Wakefield
(BX62)
18
43.0
Sunset Park West
(BK32)
19
38.6
Woodside (QN63)
10
25.4
Yorkville (MN32)
12
16.1
Todt Hill-Emerson Hill-
Heartland Village-
Lighthouse Hill (SI24)
5
15.6
Turtle Bay-East
Midtown (MN19)
11
22.4
University Heights-
Morris Heights (BX36)
24
45.5
›› Appendices
76
Appendix 14: Characteristics of children ages 0 to 36 months newly reported with hepatitis C in NYC,
2021
Characteristics Number
Percentage of
each group
Overall
11
100.0
Hepatitis C test results
Confirmed
1
3
27.3
Exposed (infection status unknown)
2
6
54.5
Not currently infected
3
2
18.2
Reason child was tested for hepatitis C
4
Birthing parent known to have hepatitis C
6
54.6
Birthing parent’s current or past injection
drug use
1 9.1
Other reason
1
9.1
Unknown
3
27.3
Sex
Female
4
36.4
Male
7
63.6
Race and ethnicity
Asian, non-Latino/a
0
0.0
Black, non-Latino/a
0
0.0
Latino/a
2
18.2
Multi-race
0
0.0
White, non-Latino/a
1
9.1
Other
3
27.3
Unknown
5
45.5
Borough of residence
Bronx
4
36.4
Brooklyn
1
9.1
Manhattan
2
18.2
Queens
3
27.3
Staten Island
1
9.1
Other characteristics
5
Birthing parent previously reported to
Health Department with hepatitis C
0 0.0
Child lives with biological birthing parent
5
57.1
1
RNA positive between ages 2 to 36 months
2
Antibody positive between ages 0 to 36 months or RNA positive between ages 0 to 2 months
3
RNA negative between ages 2 to 36 months or antibody negative between ages 18 to 36 months
4
Not mutually exclusive
5
Unknown for four children

›› Appendices
77
Appendix 15: Characteristics of people ages 18 to 34 years newly reported with chronic hepatitis C
in 2021 interviewed through enhanced surveillance (n=200)
Characteristics Number
Percentage of
each group
Interviewed
Patient interview
74
37.0
Provider interview
172
86.0
Demographic information
Gender identity
Men
135
67.5
Women
58
29.0
Transgender
women
3
1.5
Transgender men
1
0.5
Unknown
3
1.5
Borough of residence
Bronx
47
23.5
Brooklyn
47
23.5
Manhattan
55
27.5
Queens
39
19.5
Staten Island
12
6.0
Race and ethnicity
Asian, non-
Latino/a
6
3.0
Black, non-
Latino/a
25
12.5
Latino/a
28
14.0
Native American
or Alaska Native,
non-Latino/a
1
0.5
White, non-
Latino/a
68
34.0
Other
7
3.5
Unknown
65
32.5
Place of birth
U.S.
79
39.5
Outside of the
U.S.
20
10.0
Unknown
101
50.5
Country of birth
Brazil
1
5.0
Cuba
1
5.0
China
1
5.0
Dominican
Republic
3 15.0
Georgia
1
5.0
Honduras
1
5.0
Hungary
1
5.0
Italy
1
5.0
Kazakhstan
1
5.0
Peru
1
5.0
Russia
2
10.0
Tibet
1
5.0
Unknown
5
25.0
Access to care
Insurance status
Insured
168
84.0
Not insured
10
5.0
Unknown
3
1.5
Missing
19
9.5
Referrals
Referred to a
linkage to care
specialist
15
20.3
Referred to harm
reduction services
3
4.1
Hepatitis A and B vaccination (provider
question)
Hepatitis A
7
3.5
Hepatitis B
16
8.0
Hepatitis A and B
23
11.5
Not vaccinated
against either
46
23.0
Unknown
108
54.0
›› Appendices
78
Appendix 15: Characteristics of people ages 18 to 34 years newly reported with chronic hepatitis C
in 2021 interviewed through enhanced surveillance (n=200) (continued)
Characteristics Number
Percentage
of each
group
Clinical assessment
Why patient tested for hepatitis C
1
Risk factors
63
31.5
Routine screening
116
58.0
Drug or alcohol
treatment
97
48.5
Elevated liver
enzymes
9
4.5
Jaundice
1
0.5
Previously tested
for hepatitis C
3
1.5
Symptoms or signs
6
3.0
Incarceration
14
7.0
Dialysis
0
0.0
Other
17
8.5
Currently receiving treatment for hepatitis C
Yes
43
21.5
No
56
28.0
Unknown
101
50.5
Did patient achieve cure?
Yes
4
2.0
Treatment in
progress
34
17.0
No
5
2.5
Unknown
157
78.5
Risk factors
1
IDU
94
47.0
MSM
56
28.0
2
Intranasal drug use
72
36.0
Contact with a
household member
with hepatitis C
26
13.0
HIV infection
43
21.5
History of
homelessness
36
18.0
Medical procedure
involving injections,
anesthesia, or blood
23
11.5
Hospitalized
18
9.0
Dental work or oral
surgery
20
10.0
Non-professional
tattoo or body
piercing
24
12.0
Long term care
facility
7
3.5
Transfusion or
transplant before
1992, or outside of
the U.S.
0
0.0
Biological birthing
parent with
hepatitis C
1
0.5
Contact with blood
through work
0
0.0
History of
incarceration
14
7.0
Received dialysis
2
1.0
IDU
Patient self-reported
IDU
28
37.8
Self-reported IDU
Ever shared needles
10
13.5
Ever shared drug
supplies
12
16.2
1
Not mutually exclusive
2
41.5% of men interviewed reported as MSM.
›› Appendices
79
Appendix 16: RNA and genotype test results of people newly reported with chronic hepatitis C in NYC,
2021
Characteristics Number
Percentage of
each group
All new reports of hepatitis C
7,827
100.0
Any RNA test performed
1
6,676
85.3
Case definition
Not currently infected: antibody
positive, RNA negative only
4,995 63.8
Probable: antibody positive only
1,167
14.9
Confirmed: antibody positive,
RNA positive or genotype tested
2
1,665 21.3
Genotype test performed
3
Yes
814
48.9
No
851
51.1
Genotype
4
1a
372
45.7
1b
143
17.6
1 unspecified, 1 other, or 1a/1b
58
7.1
2
92
11.3
3
109
13.4
4
22
2.7
6
15
1.8
Mixed
3
0.4
1
Based on the Health Department’s hepatitis C surveillance data as of March 31, 2022. Reporting
of negative RNA test results to the Health Department was mandated on July 21, 2014.
2
Twenty-three people only had a genotype result and no RNA positive result.
3
Genotype data are presented for patients who had a positive RNA or genotype test reported
(n=1,665).
4
Percentage calculated out of those with a genotype test (n=814).

›› Appendices
80
Appendix 17: Treatment initiation among people newly reported with a positive hepatitis C RNA test,
2015–2021
Report year
Initiated hepatitis C
treatment
Did not initiate
hepatitis C treatment
Deceased before initiating
hepatitis C treatment
1
Number
Percentage
Number
Percentage
Number
Percentage
2015
2,322
53.3
1,825
41.9
208
4.8
2016
2,151
53.1
1,743
43.1
154
3.8
2017
1,838
51.4
1,658
46.4
81
2.3
2018
1,603
49.5
1,616
49.9
20
0.6
2019
1,300
44.9
1,577
54.5
19
0.7
2020
706
38.5
1,096
59.8
30
1.6
2021
433
25.5
1,248
73.5
18
1.1
1
Matching to 2018-2021 Office of Vital Statistics data incomplete

›› Appendices
81
Appendix 18: Conditional proportions, time frame, and definitions for the 2021 hepatitis C virus clearance cascade
Conditional Proportions for 2021 Laboratory-based Hepatitis C Virus Clearance Cascade by Subpopulation
Characteristics
Ever
infected
Viral testing Initial infection Cured/cleared
Persistent infection/
reinfection
Number
(1)
Number
(2b)
Percentage
(2b/1)
Number
(3b)
Percentage
(3b/2b)
Number
(4b)
Percentage
(4b/3b)
Number
(5b)
Percentage
(5b/4b)
Total
122,675
112,997
92.1
63,025
55.8
41,332
65.6
1,351
3.3
Gender Identity
1
Female
50,854
46,650
91.7
22,746
48.8
15,527
68.3
339
2.2
Male
71,644
66,197
92.4
40,023
60.5
25,784
64.4
1,012
3.9
Transgender
7
7
100.0
4
57.1
0
0.0
0
0.0
Age
2
0–19
403
323
80.1
101
31.3
47
46.5
0
0.0
20–39
18,087
16,096
89.0
6,660
41.4
3,579
53.7
254
7.1
40–59
39,948
36,728
91.9
19,916
54.2
12,864
64.6
562
4.4
≥ 60
64,236
59,849
93.2
36,347
60.7
24,842
68.3
535
2.2
Race and ethnicity
Asian/Pacific
Islander
3
5,655
5,166
91.4
2,004
38.8
1,547
77.2
20
1.3
Black
3
30,598
28,641
93.6
18,368
64.1
12,239
66.6
347
2.8
Latino/a
26,726
25,262
94.5
14,580
57.7
10,082
69.1
462
4.6
Native
American or
Alaska Native
3
190
177
93.2
85
48.0
55
64.7
2
3.6
White
3
27,408
25,578
93.3
14,621
57.2
9,998
68.4
309
3.1
Other/
Unknown
32,098
28,173
87.8
13,367
47.4
7,411
55.4
211
2.8
1
One hundred seventy patients had a missing gender identity
2
One person was missing a date of birth
3
Non-Latino/a
›› Appendices
82
Time Frame and Definitions for the 2021 Laboratory-Based Hepatitis C Virus Clearance Cascade
• Cascade starting point. July 1, 2014, the date when hepatitis C virus RNA negative/”not detected” reporting was fully implemented
in New York City.
• Evaluation time frame. The time period from the starting point to the analysis point (July 1, 2014).
• Step 1: Ever infected with hepatitis C. All individuals with any positive/”detected” hepatitis C virus test (anti-HCV, RNA, detectable
genotype, or core antigen) performed from the starting point through the end of the “ever-infected” period (December 31, 2020). The
test performance date is the specimen collection date (or laboratory result date if specimen collection date is not available).
• Step 2: Viral testing performed. This category includes all individuals who were ever infected (Step 1):
o 2a – No hepatitis C viral test reported. All individuals who have no hepatitis C viral test performed by the end of the follow-up
period (December 31, 2021).
o 2b – Hepatitis C viral test performed. All individuals who have any hepatitis C viral test performed by the end of the follow-up
period (December 31, 2021), regardless of result.
• Step 3: Initial infection status. This category includes all individuals with viral testing performed (Step 2b):
o 3a – Initial hepatitis C virus infection cured or cleared. All individuals whose initial hepatitis C viral test result performed
during the follow-up period (through December 31, 2021) was “not detected.”
o 3b – Initial hepatitis C virus infection present. All individuals whose initial hepatitis C viral test result performed during the
follow-up period (through December 31, 2021) was “detected.”
• Step 4: Cured or cleared. This category includes all individuals with an initial hepatitis C viral test result “detected” (Step 3b):
o 4a – Hepatitis C virus infection not cured or cleared during the cascade time frame. All individuals where no subsequent
hepatitis C viral test results were performed or where all subsequent hepatitis C viral test results during the follow-up period
(through December 31, 2021) were “detected.”
o 4b – Hepatitis C virus infection cured or cleared during the cascade time frame. All individuals where a subsequent hepatitis
C viral test result “not detected” was performed during the follow-up period (through December 31, 2021).
o Note: The cascade is unable to distinguish between cured (referring to successful treatment response) and cleared (referring
to natural, spontaneous clearance).
o Note: A patient with a single, detectable hepatitis C RNA result would populate all of the first four Steps: Step 1, Step 2b,
Step 3b, and Step 4a.
• Step 5: Persistent infection or reinfection.
o 5a – Persistent infection or reinfection. All individuals where a negative/“not detected” result (Step 3a) is followed by an
hepatitis C viral test result positive/“detected.”
o 5b – Persistent infection or reinfection. All individuals where a negative/“not detected” result (Step 4b) is followed by an
hepatitis C viral test result positive/“detected.”
o Note: The cascade is unable to distinguish among the reasons for persistent infection (for example, incomplete treatment,
treatment failure, viral breakthrough), reinfection or false positive reports (rare). For simplicity, there is no minimum time
period after a hepatitis C viral negative/“not detected” test result (cured or cleared) and before a subsequent hepatitis C
›› Appendices
83
viral positive/“detected” test result occurs to qualify as a persistent infection or reinfection. Regardless of whether these
infections represent persistent infections or reinfections, this group represents an important opportunity for linkage to care
and treatment.
• Pre-direct acting antiviral (DAA) medication treatment and cure rates are not included in the cascade.
• All individuals who are known to be living outside the jurisdiction or deceased as of the end of the follow-up period (December 31,
2021) were excluded from the cascade.
›› Appendices
84
Appendix 19: Number and percentage of people who had a recurrent hepatitis C RNA positive test,
by clinical interpretation, 2020
Interpretation Number
Percentage of
each group
False positive
2
3.2
Reinfection
56
90.3
Relapse/treatment failure
4
6.5
›› Appendices
85
Appendix 20: Number and percentage of people reinfected with hepatitis C infection in NYC, by
gender, age at reinfection, time to reinfection and reported risk factors, 2020
Interpretation Number
Percentage of
each group
Overall
56
100.0
Gender
Male
45
80.4
Female
11
19.6
Age at reinfection
20–29
5
8.9
30–39
19
33.9
40–49
11
19.6
50–59
19
33.9
60–69
2
3.6
Time to reinfection
≤ 1 year from cure date
23
41.1
> 1 year from cure date
33
58.9
Risk factors (not mutually exclusive)
Ever used intranasal or injection drugs
42
75.0
Ever incarcerated
16
28.6
HIV-positive
9
16.1
MSM
7
12.5

›› Appendices
86
Appendix 21: Characteristics of people reported with hepatitis C and HIV coinfection in NYC by end
of 2020
1,2
Characteristics
Total
Initiated hepatitis C
treatment
by end of 2020
3
Had not initiated
hepatitis C treatment
by end of 2020
Number
Percentage
(column)
Number
Percentage
(row)
Number
Percentage
(row)
Overall
11,203
100.0
7,883
70.4
3,320
29.6
Gender
Male
8,376
74.8
5,865
70.0
2,511
30.0
Female
2,619
23.4
1,887
72.1
732
27.9
Transgender
208
1.9
131
63.0
77
37.0
Age
0–19
3
0.0
2
66.7
1
33.3
20–29
172
1.5
81
47.1
91
52.9
30–39
923
8.2
491
53.2
432
46.8
40–49
1,339
12.0
847
63.3
492
36.7
50–59
3,443
30.7
2,430
70.6
1,013
29.4
60–69
4,206
37.5
3,200
76.1
1,006
23.9
≥ 70
1,117
10.0
832
74.5
285
25.5
Current borough of residence
Bronx
3,936
35.1
2,841
72.2
1,095
27.8
Brooklyn
2,761
24.6
1,990
72.1
771
27.9
Manhattan
2,803
25.0
1,898
67.7
905
32.3
Queens
1,387
12.4
913
65.8
474
34.2
Staten Island
316
2.8
241
76.3
75
23.7
Neighborhood poverty level by ZIP code
4
Low (< 10% below
poverty)
1,122
10.0
774
69.0
348
31.0
Medium (10 to < 20%)
3,586
32.0
2,474
69.0
1,112
31.0
High (20 to < 30%)
2,919
26.1
2,106
72.1
813
27.9
Very high (≥ 30%)
3,547
31.7
2,516
70.9
1,031
29.1
Unknown
29
0.3
13
44.8
16
55.2
Race and ethnicity
Asian/Pacific Islander,
non-Latino/a
164
1.5
110
67.1
54
32.9
Black, non-Latino/a
4,494
40.1
3,106
69.1
1,388
30.9
Latino/a
4,678
41.8
3,349
71.6
1,329
28.4
White, non-Latino/a
1,816
16.2
1,282
70.6
534
29.4
Other
5
44
0.4
33
75.0
11
25.0
Unknown
7
0.1
3
42.9
4
57.1

›› Appendices
87
Appendix 21: Characteristics of people reported with hepatitis C and HIV coinfection in NYC by end
of 2020 (continued)
1,2
Characteristics
Total
Initiated hepatitis C
treatment
by end of 2020
3
Had not initiated
hepatitis C treatment
by end of 2020
Number
Percentage
(column)
Number
Percentage
(row)
Number
Percentage
(row)
Birth cohort
Before 1945
374
3.3
263
70.3
111
29.7
1945–1965
7,703
68.8
5,737
74.5
1,966
25.5
1966–1983
2,545
22.7
1,589
62.4
956
37.6
1984–2017
581
5.2
294
50.6
287
49.4
Years since HIV diagnosis
< 5
377
3.4
208
55.2
169
44.8
5–9
751
6.7
461
61.4
290
38.6
10–19
3,282
29.3
2,204
67.2
1,078
32.8
≥ 20
6,793
60.6
5,010
73.8
1,783
26.2
HIV viral load < 200 copies per mL at most recent lab in 2020
Yes
7,293
65.1
6,072
83.3
1,221
16.7
No
1,454
13.0
884
60.8
570
39.2
Unknown (no HIV viral
loads in 2020)
2,456
21.9
927
37.7
1,529
62.3
1
Individuals were diagnosed with HIV and hepatitis C and living as of December 31, 2020, with at
least one HIV or hepatitis C lab reported since January 1, 2014. Individuals with a residential
address outside of NYC were excluded, as the Health Department only receives hepatitis C lab
results for NYC residents. Individuals were considered to have a history of confirmed hepatitis C
infection if they had at least one positive hepatitis C RNA test reported prior to the end of 2020.
2
Demographic characteristics and HIV clinical characteristics were obtained from the NYC HIV
surveillance registry. Hepatitis C outcomes were obtained from the NYC hepatitis C surveillance
registry.
3
Individuals were considered to have initiated hepatitis C treatment if they had at least one
negative hepatitis C RNA result reported after a positive RNA result prior to the end of 2020.
4
Based on ZIP code at most recent report.
5
Other race/ethnicity includes Native American and multiracial categories.

›› Appendices
88
Appendix 22: Conditional proportions, time frame, and definitions for the 2021 hepatitis C virus clearance cascade for people coinfected
with hepatitis C and HIV
Conditional Proportions for the 2021 Laboratory-Based Hepatitis C Virus Clearance Cascade for People Coinfected With Hepatitis C and
HIV by Subpopulation
Characteristics
Ever
infected
Viral testing Initial infection Cured/cleared
Persistent infection/
reinfection
Number
(1)
Number
(2b)
Percentage
(2b/1)
Number
(3b)
Percentage
(3b/2b)
Number
(4b)
Percentage
(4b/3b)
Number
(5b)
Percentage
(5b/4b)
Total
11,157
10,790
96.7
8,939
82.8
6,910
77.3
300
4.3
Gender identity
1
Female
2,819
2,723
96.6
2,200
80.8
1,688
76.7
46
2.7
Male
8,330
8,059
96.7
6,731
83.5
5,221
77.6
254
4.9
Transgender
2
2
100.0
2
100.0
1
50.0
0
0.0
Age
0–19
2
2
100.0
2
100.0
1
50.0
0
0.0
20–39
921
866
94.0
802
92.6
503
62.7
44
8.7
40–59
4,263
4,121
96.7
3,414
82.8
2,596
76.0
145
5.6
≥ 60
5,971
5,801
97.2
4,721
81.4
3,810
80.7
111
2.9
Race and ethnicity
Asian/Pacific
Islander
2
106
105
99.1
80
76.2
66
82.5
2
3.0
Black
2
4,374
4,226
96.6
3,663
86.7
2,824
77.1
106
3.8
Latino/a
4,013
3,932
98.0
3,130
79.6
2,487
79.5
143
5.7
Native
American or
Alaska Native
2
16
16
100.0
14
87.5
12
85.7
0
0.0
White
2
1,674
1,639
97.9
1,274
77.7
1,011
79.4
31
3.1
Other/
Unknown
974
872
89.5
778
89.2
510
65.6
18
3.5
1
Six patients had a missing gender identity
2
Non-Latino/a
See Appendix 17 for the time frame and definitions.

›› Appendices
89
Appendix 23: Characteristics of decedents where hepatitis C is listed as the underlying cause or
contributing cause of death, NYC, 2020
Characteristics Number
Percentage of
each group
Age-adjusted rate per
100,000 people
1
Overall
263
100
2.7
Sex
Female
94
35.7
1.7
Male
169
64.3
3.9
Race and ethnicity
Asian/Pacific Islander, non-
Latino/a
7
2.6
0.5
Black, non-Latino/a
93
35.0
4.2
Latino/a
93
35.0
3.9
White, non-Latino/a
64
24.1
1.8
Other/Unknown
9
3.4
N/A
Age
Age-specific rate per
100,000 population
1
0–24
0
0.0
0.0
25–44
10
3.8
0.4
45–64
79
30.0
4.0
65–84
151
57.4
13.4
≥ 85
23
8.7
12.7
1
The population used in the rate constructions are based on the Census 2020 population
estimates, 2021 vintage. However, the 2020 Census counts are substantially higher than the
estimates, rendering rates potentially overestimated.

›› Appendices
90
Appendix 24: Leading causes of deaths among decedents with hepatitis C in 2020, by number
All Decedents
Cause of death
Number
COVID-19
982
Heart diseases
942
Cancer
697
Drug-related
482
Diabetes
124
Chronic lower respiratory diseases
120
Influenza and pneumonia
106
HIV
104
Viral hepatitis
84
Essential hypertension and renal
diseases
82
All other causes
782
Total
4,505
Premature Decedents
Cause of death
Number
Drug-related
416
COVID-19
294
Heart diseases
268
Cancer
203
HIV
60
Diabetes
48
Chronic liver disease and cirrhosis
44
Chronic lower respiratory diseases
44
Influenza and pneumonia
39
Accidents except drug poisoning
35
All other causes
306
Total
1,757

›› Appendices
91
Appendix 25: Number of hepatitis A and B vaccines provided by Health Department facilities, 2021
Vaccine
Total hepatitis
vaccine doses
Completed hepatitis
vaccine series
Immunization clinics
Hepatitis A only, ages 4 to 18 years
1,798
351
Hepatitis A only, ages 19 years and older
218
84
Hepatitis B only, ages 4 to 18 years
1,645
351
Hepatitis B only, ages 19 years and older
1,202
229
NYC Sexual Health Clinics
Hepatitis A only
261
56
Hepatitis B only
483
22
Hepatitis A/B combination
744
78
1
Total of hepatitis A and hepatitis B vaccine doses
2
Total number of individuals who completed either hepatitis A or hepatitis B vaccine series in 2021
Appendix 26: Number of hepatitis A and B vaccines provided by NYC providers, 2021
Vaccine
Total hepatitis
vaccine doses
Completed hepatitis
vaccine series
Hepatitis A only, ages 0 to 18 years
198,475
95,123
Hepatitis A only, ages 19 years and older
10,637
2,384
Hepatitis B only, ages 0 to 18 years
202,378
46,455
Hepatitis B only, ages 19 years and older
74,809
8,737

›› Appendices
92
12.22
